Dashboard Icon
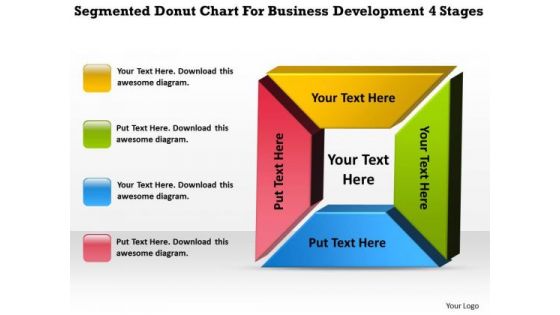
Donut Chart For Business Development 4 Stages Plan Excel PowerPoint Templates
We present our donut chart for business development 4 stages plan excel PowerPoint templates.Download our Finance PowerPoint Templates because Our PowerPoint Templates and Slides are created by a hardworking bunch of busybees. Always flitting around with solutions gauranteed to please. Present our Marketing PowerPoint Templates because Our PowerPoint Templates and Slides team portray an attitude of elegance. Personify this quality by using them regularly. Download and present our Shapes PowerPoint Templates because Our PowerPoint Templates and Slides are innately eco-friendly. Their high recall value negate the need for paper handouts. Download our Business PowerPoint Templates because It will mark the footprints of your journey. Illustrate how they will lead you to your desired destination. Download and present our Process and Flows PowerPoint Templates because Our PowerPoint Templates and Slides will provide you a launch platform. Give a lift off to your ideas and send them into orbit.Use these PowerPoint slides for presentations relating to chart, business, data, donut, market, sales, document, economy, display, bar, corporate, income, concept, success, presentation, symbol, diagram, percentage, graphic, finance, stock, clean, analysis, report, marketing, accounting, management, graph, forecast, design, growth, competition, progress, profit, information, background, trade, investment, statistic, financial, infographics, 3d. The prominent colors used in the PowerPoint template are Yellow, Green, Blue. Extend the effect with our Donut Chart For Business Development 4 Stages Plan Excel PowerPoint Templates. Get greater control of your domain.
Flow Chart Arrows Toolbox PowerPoint Slides
Flow Chart Arrows toolBox PowerPoint Slides-These high quality powerpoint pre-designed slides and powerpoint templates have been carefully created by our professional team to help you impress your audience. All slides have been created and are 100% editable in powerpoint. Each and every property of any graphic - color, size, orientation, shading, outline etc. can be modified to help you build an effective powerpoint presentation. Any text can be entered at any point in the powerpoint template or slide. Simply DOWNLOAD, TYPE and PRESENT! These PowerPoint presentation slides can be used to represent themes relating to --Business, businessman, chain, chart, communication, community, company, concept, connection, contact, corporate, creativity, data, database, diagram, draw, drawing, education, executive, flow, flowchart, global, graphic, group, illustration, internet, isolated, job, manager, meeting, net, network, networking, office, organization, people, person, plan, presentation, relationship, screen, social, structure, success, team, teamwork, web, white, work, writing-Flow Chart Arrows toolBox PowerPoint Slides Synthesize presentations with our Flow Chart Arrows Toolbox PowerPoint Slides. Download without worries with our money back guaranteee.
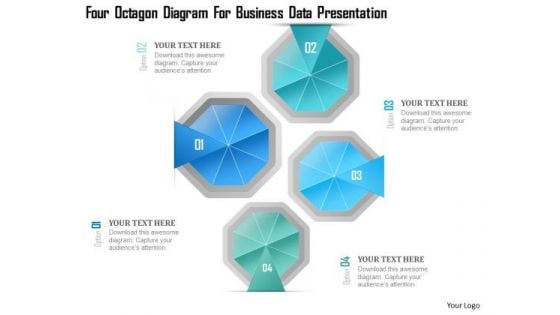
Busines Diagram Four Octagon Diagram For Business Data Presentation Template
This business diagram has been designed with graphic of four octagon and text boxes. This slide contains the concept of business data flow. Deliver amazing presentations to mesmerize your audience.
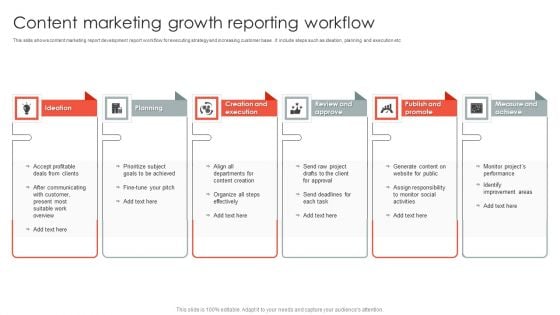
Content Marketing Growth Reporting Workflow Diagrams PDF
This slide shows content marketing report development report workflow for executing strategy and increasing customer base . It include steps such as ideation, planning and execution et. Presenting Content Marketing Growth Reporting Workflow Diagrams PDF to dispense important information. This template comprises six stages. It also presents valuable insights into the topics including Assign Responsibility, After Communicating, Goals Achieved. This is a completely customizable PowerPoint theme that can be put to use immediately. So, download it and address the topic impactfully.
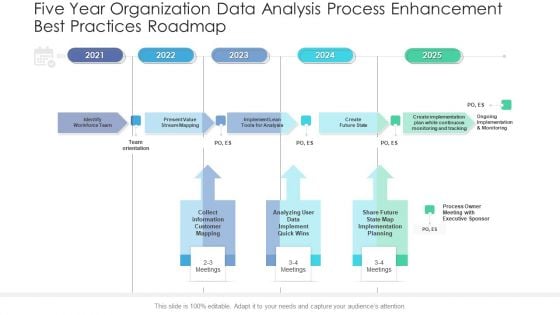
Five Year Organization Data Analysis Process Enhancement Best Practices Roadmap Rules
Presenting our innovatively structured five year organization data analysis process enhancement best practices roadmap rules Template. Showcase your roadmap process in different formats like PDF, PNG, and JPG by clicking the download button below. This PPT design is available in both Standard Screen and Widescreen aspect ratios. It can also be easily personalized and presented with modified font size, font type, color, and shapes to measure your progress in a clear way.
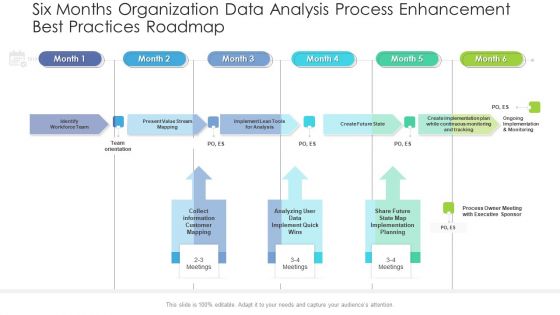
Six Months Organization Data Analysis Process Enhancement Best Practices Roadmap Inspiration
Presenting our innovatively structured six months organization data analysis process enhancement best practices roadmap inspiration Template. Showcase your roadmap process in different formats like PDF, PNG, and JPG by clicking the download button below. This PPT design is available in both Standard Screen and Widescreen aspect ratios. It can also be easily personalized and presented with modified font size, font type, color, and shapes to measure your progress in a clear way.
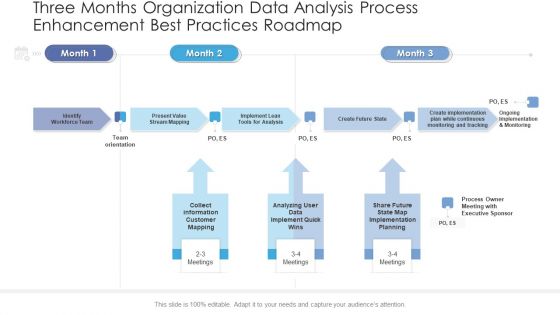
Three Months Organization Data Analysis Process Enhancement Best Practices Roadmap Portrait
Presenting our innovatively structured three months organization data analysis process enhancement best practices roadmap portrait Template. Showcase your roadmap process in different formats like PDF, PNG, and JPG by clicking the download button below. This PPT design is available in both Standard Screen and Widescreen aspect ratios. It can also be easily personalized and presented with modified font size, font type, color, and shapes to measure your progress in a clear way.
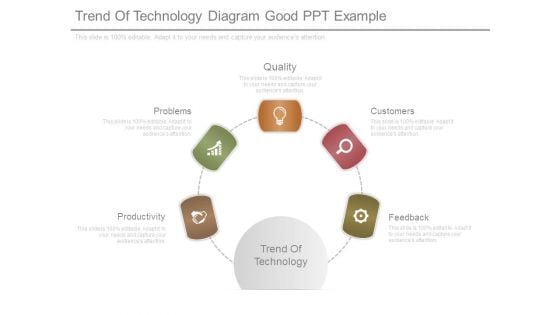
Trend Of Technology Diagram Good Ppt Example
This is a trend of technology diagram good ppt example. This is a five stage process. The stages in this process are productivity, problems, quality, customers, feedback, trend of technology.
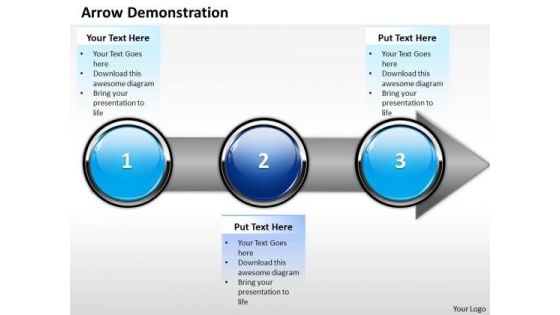
Ppt Consecutive Description Of Banking Process Using 3 State Diagram PowerPoint Templates
PPT consecutive description of banking process using 3 state diagram PowerPoint Templates-With this pre-designed process arrows diagram you can visualize almost any type of concept, chronological process or steps of your strategies.-PPT consecutive description of banking process using 3 state diagram PowerPoint Templates-Arrow, Bank, Benefit, Business, Calculate, Calculation, Capitalist, Communication, Company, Concern, Connection, Data, Diagram, Digital, Drawing, Earnings, Economic, Finance, Financial, Flow, Forecast, Gain, Goal, Graph, Growth, Illustration, Increase, Information, Interest, Investing, Management, Market, Money, Move, Network, Objective, Plan, Process, Profit, Progress, Report, Rise, Risk, Shares, Statistics, Stock, System, Technology Turn the heat up with our Ppt Consecutive Description Of Banking Process Using 3 State Diagram PowerPoint Templates. Make sure your presentation gets the attention it deserves.
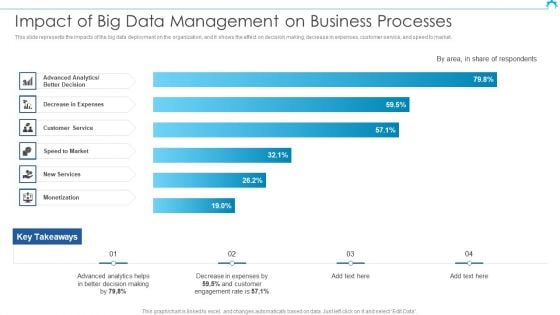
Big Data Architect Impact Of Big Data Management On Business Processes Designs PDF
This slide represents the impacts of the big data deployment on the organization, and it shows the effect on decision making, decrease in expenses, customer service, and speed to market.Deliver and pitch your topic in the best possible manner with this Big Data Architect Impact Of Big Data Management On Business Processes Designs PDF. Use them to share invaluable insights on Advanced Analytics, Better Decision, Decrease Expenses and impress your audience. This template can be altered and modified as per your expectations. So, grab it now.
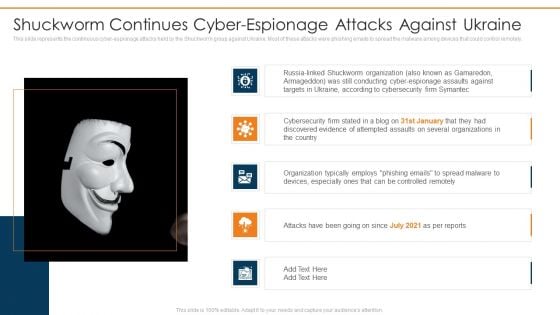
Data Wiper Spyware Attack Shuckworm Continues Cyber Espionage Attacks Against Ukraine Diagrams PDF
This slide represents the continuous cyber-espionage attacks held by the Shuckworm group against Ukraine. Most of these attacks were phishing emails to spread the malware among devices that could control remotely.Deliver an awe inspiring pitch with this creative data wiper spyware attack shuckworm continues cyber espionage attacks against ukraine diagrams pdf bundle. Topics like shuckworm continues cyber espionage attacks against ukraine can be discussed with this completely editable template. It is available for immediate download depending on the needs and requirements of the user.
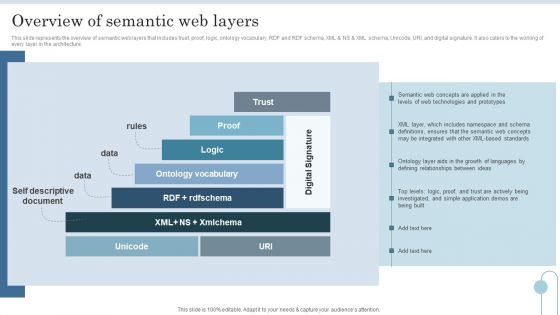
Semantic Data Searching Technique Overview Of Semantic Web Layers Diagrams PDF
This slide represents the overview of semantic web layers that includes trust, proof, logic, ontology vocabulary, RDF and RDF schema, XML and NS and XML schema, Unicode, URI, and digital signature. It also caters to the working of every layer in the architecture. The best PPT templates are a great way to save time, energy, and resources. Slidegeeks have 100 percent editable powerpoint slides making them incredibly versatile. With these quality presentation templates, you can create a captivating and memorable presentation by combining visually appealing slides and effectively communicating your message. Download Semantic Data Searching Technique Overview Of Semantic Web Layers Diagrams PDF from Slidegeeks and deliver a wonderful presentation.
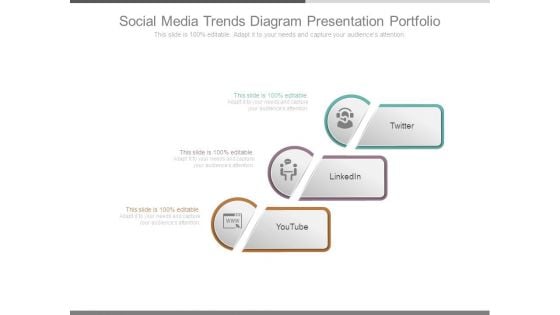
Social Media Trends Diagram Presentation Portfolio
This is a social media trends diagram presentation portfolio. This is a three stage process. The stages in this process are twitter, linkedin, youtube.
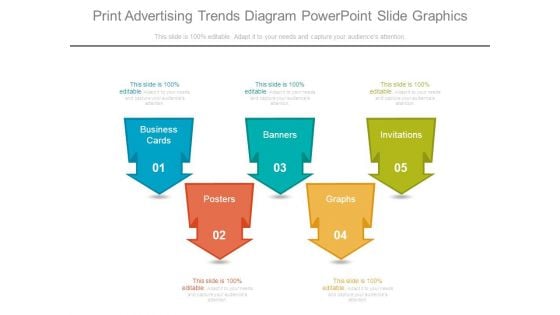
Print Advertising Trends Diagram Powerpoint Slide Graphics
This is a print advertising trends diagram powerpoint slide graphics. This is a five stage process. The stages in this process are business cards, banners, invitations, graphs, posters.
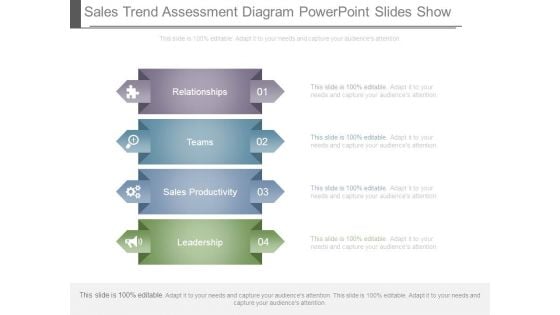
Sales Trend Assessment Diagram Powerpoint Slides Show
This is a sales trend assessment diagram powerpoint slides show. This is a four stage process. The stages in this process are relationships, teams, sales productivity, leadership.
Current Business Trend Diagram Presentation Background Images
This is a current business trend diagram presentation background images. This is a two stage process. The stages in this process are strongly agree, disagree.
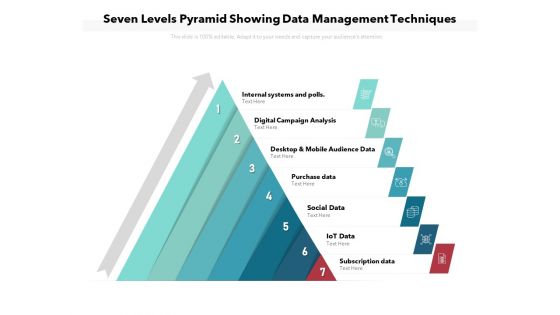
Seven Levels Pyramid Showing Data Management Techniques Ppt PowerPoint Presentation File Guide PDF
Presenting seven levels pyramid showing data management techniques ppt powerpoint presentation file guide pdf to dispense important information. This template comprises seven stages. It also presents valuable insights into the topics including analysis, social data, digital campaign. This is a completely customizable PowerPoint theme that can be put to use immediately. So, download it and address the topic impactfully.
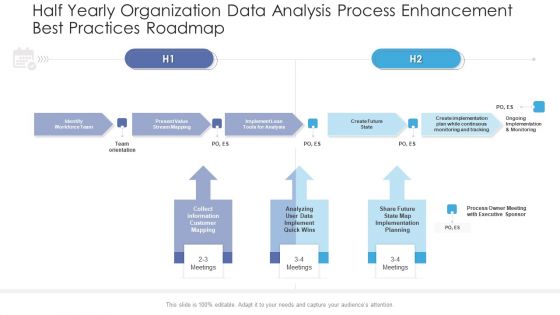
Half Yearly Organization Data Analysis Process Enhancement Best Practices Roadmap Portrait
Presenting the half yearly organization data analysis process enhancement best practices roadmap portrait. The template includes a roadmap that can be used to initiate a strategic plan. Not only this, the PowerPoint slideshow is completely editable and you can effortlessly modify the font size, font type, and shapes according to your needs. This PPT slide can be easily reached in standard screen and widescreen aspect ratios. The set is also available in various formats like PDF, PNG, and JPG. So download and use it multiple times as per your knowledge.
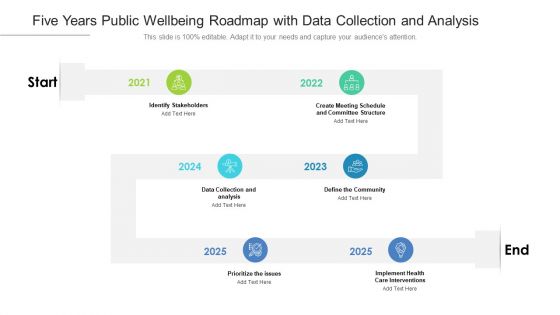
Five Years Public Wellbeing Roadmap With Data Collection And Analysis Topics
Presenting the five years public wellbeing roadmap with data collection and analysis topics. The template includes a roadmap that can be used to initiate a strategic plan. Not only this, the PowerPoint slideshow is completely editable and you can effortlessly modify the font size, font type, and shapes according to your needs. This PPT slide can be easily reached in standard screen and widescreen aspect ratios. The set is also available in various formats like PDF, PNG, and JPG. So download and use it multiple times as per your knowledge.
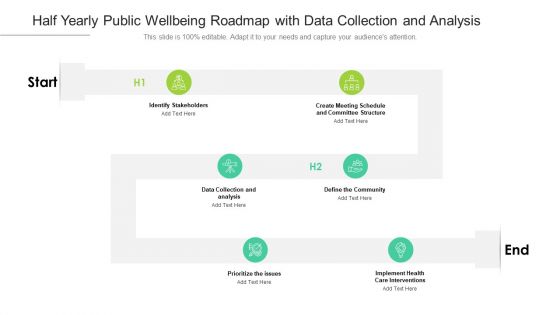
Half Yearly Public Wellbeing Roadmap With Data Collection And Analysis Graphics
Presenting the half yearly public wellbeing roadmap with data collection and analysis graphics. The template includes a roadmap that can be used to initiate a strategic plan. Not only this, the PowerPoint slideshow is completely editable and you can effortlessly modify the font size, font type, and shapes according to your needs. This PPT slide can be easily reached in standard screen and widescreen aspect ratios. The set is also available in various formats like PDF, PNG, and JPG. So download and use it multiple times as per your knowledge.
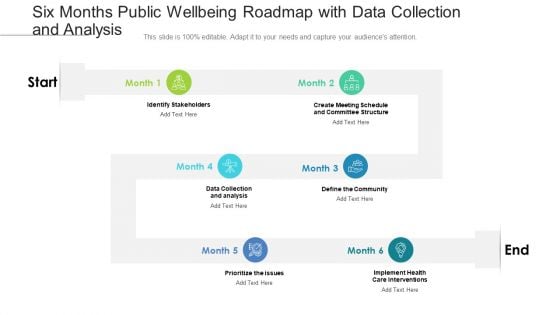
Six Months Public Wellbeing Roadmap With Data Collection And Analysis Clipart
Presenting the six months public wellbeing roadmap with data collection and analysis clipart. The template includes a roadmap that can be used to initiate a strategic plan. Not only this, the PowerPoint slideshow is completely editable and you can effortlessly modify the font size, font type, and shapes according to your needs. This PPT slide can be easily reached in standard screen and widescreen aspect ratios. The set is also available in various formats like PDF, PNG, and JPG. So download and use it multiple times as per your knowledge.
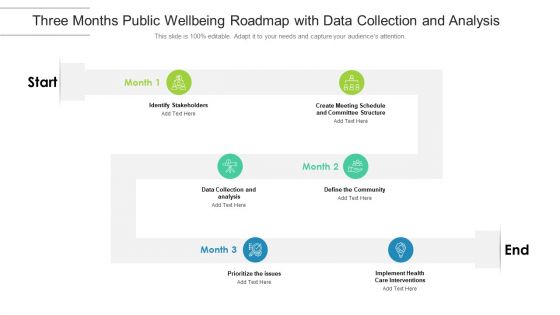
Three Months Public Wellbeing Roadmap With Data Collection And Analysis Guidelines
Presenting the three months public wellbeing roadmap with data collection and analysis guidelines. The template includes a roadmap that can be used to initiate a strategic plan. Not only this, the PowerPoint slideshow is completely editable and you can effortlessly modify the font size, font type, and shapes according to your needs. This PPT slide can be easily reached in standard screen and widescreen aspect ratios. The set is also available in various formats like PDF, PNG, and JPG. So download and use it multiple times as per your knowledge.
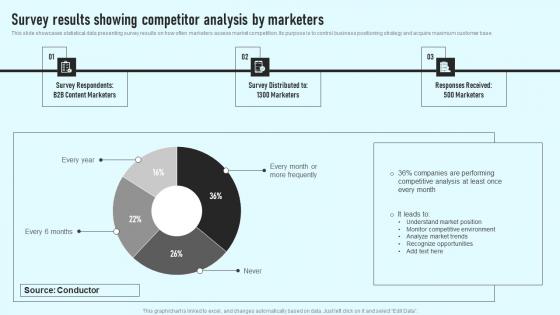
Survey Results Showing Competitor Analysis By Marketers Comprehensive Guide Brochure Pdf
This slide showcases statistical data presenting survey results on how often marketers assess market competition. Its purpose is to control business positioning strategy and acquire maximum customer base. This modern and well-arranged Survey Results Showing Competitor Analysis By Marketers Comprehensive Guide Brochure Pdf provides lots of creative possibilities. It is very simple to customize and edit with the Powerpoint Software. Just drag and drop your pictures into the shapes. All facets of this template can be edited with Powerpoint no extra software is necessary. Add your own material, put your images in the places assigned for them, adjust the colors, and then you can show your slides to the world, with an animated slide included. This slide showcases statistical data presenting survey results on how often marketers assess market competition. Its purpose is to control business positioning strategy and acquire maximum customer base.
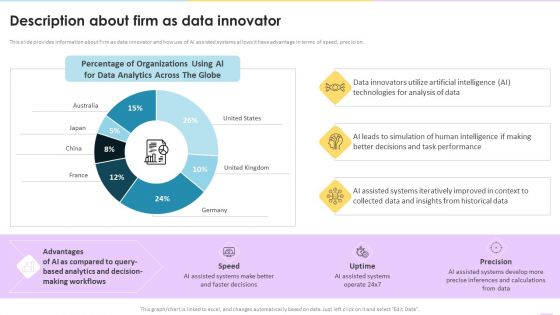
Data Valuation And Monetization Description About Firm As Data Innovator Microsoft PDF
This slide provides information about firm as data innovator and how use of AI assisted systems allows it have advantage in terms of speed, precision. Deliver an awe inspiring pitch with this creative Data Valuation And Monetization Description About Firm As Data Innovator Microsoft PDF bundle. Topics like Innovators Utilize, Artificial Intelligence, Technologies Analysis can be discussed with this completely editable template. It is available for immediate download depending on the needs and requirements of the user.
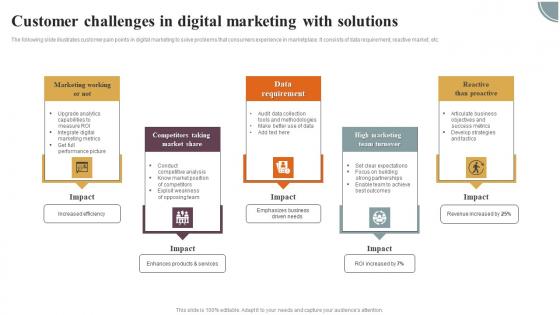
Customer Challenges In Digital Marketing With Solutions Diagrams Pdf
The following slide illustrates customer pain points in digital marketing to solve problems that consumers experience in marketplace. It consists of data requirement, reactive market, etc. Pitch your topic with ease and precision using this Customer Challenges In Digital Marketing With Solutions Diagrams Pdf This layout presents information on Marketing Working, Competitors Taking, Market Share It is also available for immediate download and adjustment. So, changes can be made in the color, design, graphics or any other component to create a unique layout. The following slide illustrates customer pain points in digital marketing to solve problems that consumers experience in marketplace. It consists of data requirement, reactive market, etc.
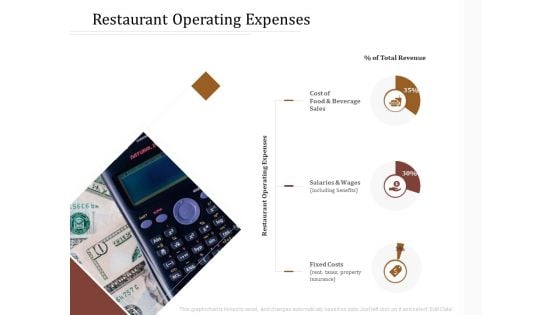
Key Metrics Hotel Administration Management Restaurant Operating Expenses Guidelines PDF
Presenting this set of slides with name key metrics hotel administration management restaurant operating expenses guidelines pdf. The topics discussed in these slides are cost, sales, salaries and wages, fixed costs, revenue. This is a completely editable PowerPoint presentation and is available for immediate download. Download now and impress your audience.
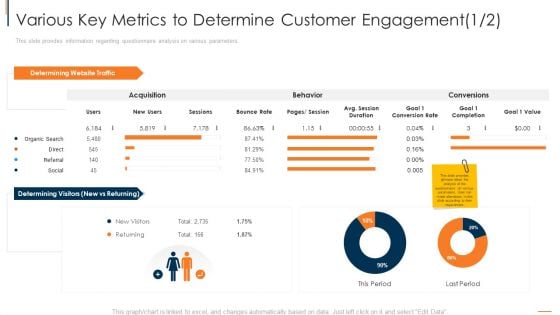
Various Key Metrics To Determine Customer Engagement Users Structure PDF
This slide provides information regarding questionnaire analysis on various parameters. Deliver an awe inspiring pitch with this creative various key metrics to determine customer engagement users structure pdf bundle. Topics like requirement, analysis, determining can be discussed with this completely editable template. It is available for immediate download depending on the needs and requirements of the user.
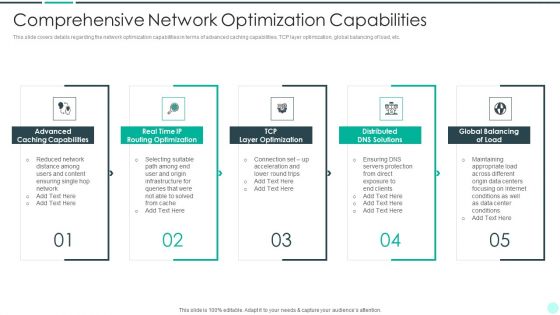
Executing Advance Data Analytics At Workspace Comprehensive Network Diagrams PDF
This slide helps in analyzing the performance of different executives representatives. It will help in tracking metrics such as cost per contact, percentage of tickets opened, etc. The staff performance will be assessed on various parameters such as cost, quality, productivity and service level. Deliver and pitch your topic in the best possible manner with this executing advance data analytics at workspace comprehensive network diagrams pdf. Use them to share invaluable insights on assessing staff performance on various parameters and impress your audience. This template can be altered and modified as per your expectations. So, grab it now.
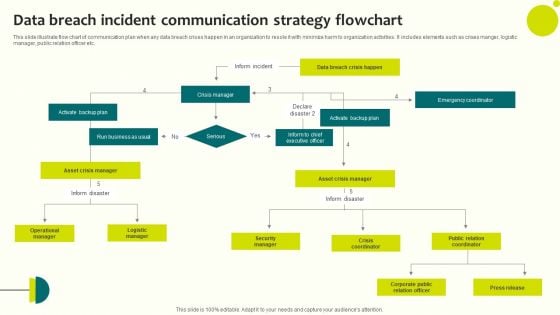
Data Breach Incident Communication Strategy Flowchart Clipart PDF
This slide illustrate flow chart of communication plan when any data breach crises happen in an organization to resole it with minimize harm to organization activities. It includes elements such as crises manger, logistic manager, public relation officer etc. Showcasing this set of slides titled Data Breach Incident Communication Strategy Flowchart Clipart PDF. The topics addressed in these templates are Crisis Manager, Flowchart, Operational Manager. All the content presented in this PPT design is completely editable. Download it and make adjustments in color, background, font etc. as per your unique business setting.
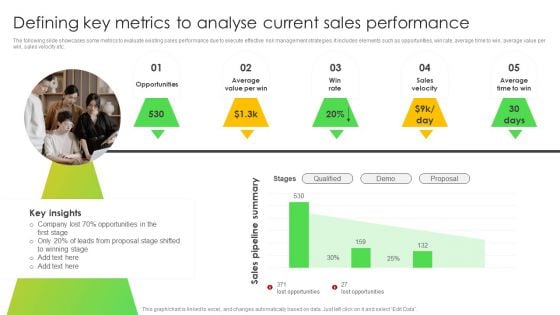
Defining Key Metrics To Analyse Current Sales Performance Background PDF
The following slide showcases some metrics to evaluate existing sales performance due to execute effective risk management strategies. It includes elements such as opportunities, win rate, average time to win, average value per win, sales velocity etc. Want to ace your presentation in front of a live audience Our Defining Key Metrics To Analyse Current Sales Performance Background PDF can help you do that by engaging all the users towards you. Slidegeeks experts have put their efforts and expertise into creating these impeccable powerpoint presentations so that you can communicate your ideas clearly. Moreover, all the templates are customizable, and easy to edit and downloadable. Use these for both personal and commercial use.
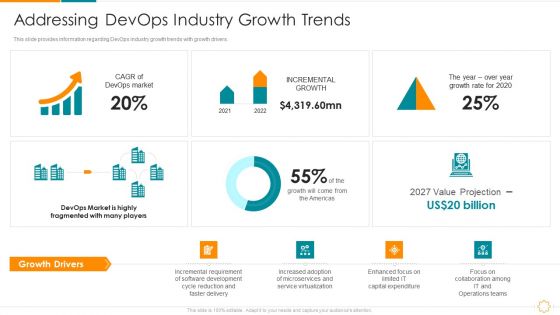
Addressing Devops Industry Growth Trends Ppt Model Diagrams PDF
Deliver an awe inspiring pitch with this creative addressing devops industry growth trends ppt model diagrams pdf bundle. Topics like growth, rate, devops market, development, requirement can be discussed with this completely editable template. It is available for immediate download depending on the needs and requirements of the user.
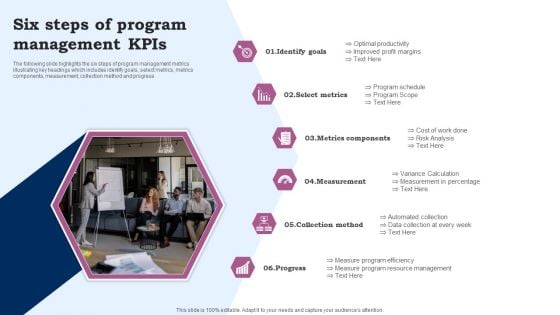
Six Steps Of Program Management Kpis Ppt Infographics Information PDF
The following slide highlights the six steps of program management metrics illustrating key headings which includes identify goals, select metrics, metrics components, measurement, collection method and progress. Presenting Six Steps Of Program Management Kpis Ppt Infographics Information PDF to dispense important information. This template comprises six stages. It also presents valuable insights into the topics including Identify Goals, Select Metrics, Metrics Components. This is a completely customizable PowerPoint theme that can be put to use immediately. So, download it and address the topic impactfully.
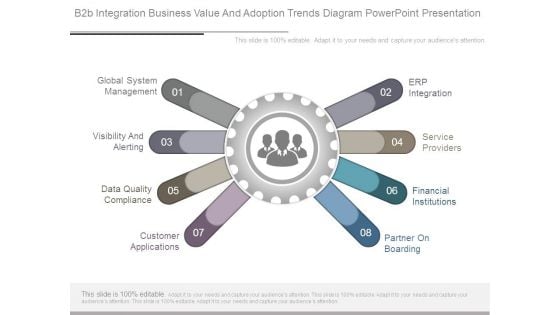
B2b Integration Business Value And Adoption Trends Diagram Powerpoint Presentation
This is a b2b integration business value and adoption trends diagram powerpoint presentation. This is a eight stage process. The stages in this process are global system management, visibility and alerting, data quality compliance, customer applications, erp integration, service providers, financial institutions, partner on boarding.
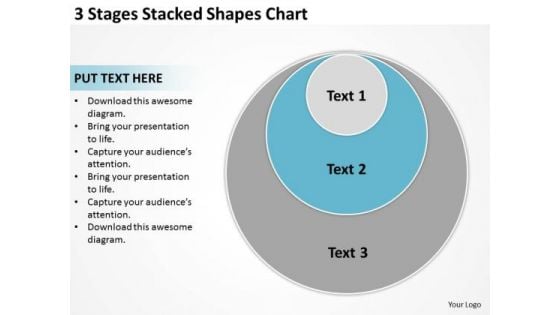
3 Stages Stacked Shapes Chart Simple Business Plan PowerPoint Slides
We present our 3 stages stacked shapes chart simple business plan PowerPoint Slides.Download and present our Business PowerPoint Templates because You can Double your output with our PowerPoint Templates and Slides. They make beating deadlines a piece of cake. Use our Venn Diagrams PowerPoint Templates because Our PowerPoint Templates and Slides are like the strings of a tennis racquet. Well strung to help you serve aces. Download and present our Layers PowerPoint Templates because You should Press the right buttons with our PowerPoint Templates and Slides. They will take your ideas down the perfect channel. Present our Circle Charts PowerPoint Templates because You can Channelise the thoughts of your team with our PowerPoint Templates and Slides. Urge them to focus on the goals you have set. Download our Shapes PowerPoint Templates because Our PowerPoint Templates and Slides will effectively help you save your valuable time. They are readymade to fit into any presentation structure. Use these PowerPoint slides for presentations relating to diagram, process, business, graphic, design, ideas, model, data, chart, project, schema, corporate, implementation, tag, plan, engineering, concept, vector, success, symbol, stack, circle, guide, work flow, development, shape, team, management, cycle, steps, illustration, system, strategy, objects, phase, professional, organization, implement, background, image, detail, structure, product. The prominent colors used in the PowerPoint template are Blue, Gray, White. Be exemplary with our 3 Stages Stacked Shapes Chart Simple Business Plan PowerPoint Slides. You will prove a class act to follow.

Business Diagram Eight Arrows Steps With Globe Presentation Template
Graphic of five staged film roll diagram has been used to craft this power point template diagram. This PPT contains the concept of data representation. Use this PPT for business and marketing data related presentations.
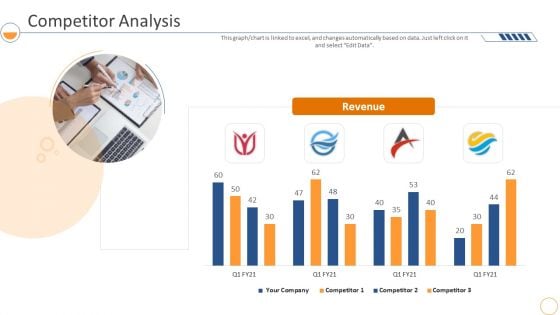
Monthly Company Performance Analysiscompetitor Analysis Pictures PDF
This graph or chart is linked to excel, and changes automatically based on data. Just left click on it and select Edit Data. Deliver and pitch your topic in the best possible manner with this monthly company performance analysiscompetitor analysis pictures pdf. Use them to share invaluable insights on revenue, competitor analysis and impress your audience. This template can be altered and modified as per your expectations. So, grab it now.
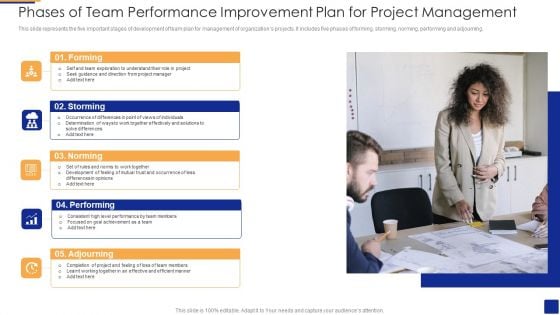
Phases Of Team Performance Improvement Plan For Project Management Infographics PDF
This slide represents the five important stages of development of team plan for management of organizations projects. It includes five phases of forming, storming, norming, performing and adjourning.Presenting Phases Of Team Performance Improvement Plan For Project Management Infographics PDF to dispense important information. This template comprises five stages. It also presents valuable insights into the topics including Team Exploration, Development Of Feeling, Working Together This is a completely customizable PowerPoint theme that can be put to use immediately. So, download it and address the topic impactfully.
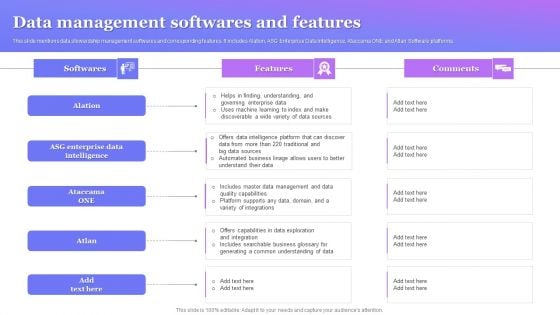
Data Management Softwares And Features Portrait PDF
This slide mentions data stewardship management softwares and corresponding features. It includes Alation, ASG Enterprise Data Intelligence, Ataccama ONE and Atlan Software platforms. Presenting Data Management Softwares And Features Portrait PDF to dispense important information. This template comprises six stages. It also presents valuable insights into the topics including Alation, ASG Enterprise Data Intelligence, Ataccama ONE. This is a completely customizable PowerPoint theme that can be put to use immediately. So, download it and address the topic impactfully.
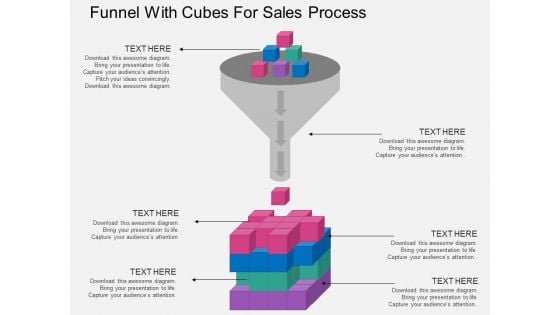
Funnel With Cubes For Sales Process Powerpoint Template
This PowerPoint template contains funnel diagram with cubes. This diagram may be used to display strategy for sales process. Earn appreciation with our slide. Your listeners will surely laud your performance.
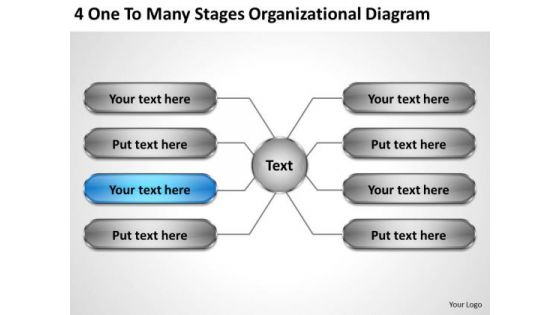
Business Strategy Formulation Many Stages Organizational Diagram Creative Marketing Concepts
We present our business strategy formulation many stages organizational diagram creative marketing concepts.Present our Marketing PowerPoint Templates because Our PowerPoint Templates and Slides will bullet point your ideas. See them fall into place one by one. Download our Business PowerPoint Templates because Our PowerPoint Templates and Slides will fulfill your every need. Use them and effectively satisfy the desires of your audience. Download our Curves and Lines PowerPoint Templates because Your ideas provide food for thought. Our PowerPoint Templates and Slides will help you create a dish to tickle the most discerning palate. Download and present our Process and Flows PowerPoint Templates because It will Strengthen your hand with your thoughts. They have all the aces you need to win the day. Download and present our Shapes PowerPoint Templates because You have gained great respect for your brilliant ideas. Use our PowerPoint Templates and Slides to strengthen and enhance your reputation.Use these PowerPoint slides for presentations relating to Arrow, Blue, Box, Brochure, Business, Button, Catalog, Chart, Circle, Company, Cross, Data, Design, Diagram, Direction, Document, Financial, Glossy, Goals, Graph, Junction, Management, Market, Marketing, Model, Multicolored, Multiple, Navigation, Network, Options, Orange, Pie, Plan, Presentation, Process, Red, Results, Shiny, Sphere, Statistics, Stock, Structure, Template. The prominent colors used in the PowerPoint template are White, Gray, Black. Kill doubts with our Business Strategy Formulation Many Stages Organizational Diagram Creative Marketing Concepts. You will come out on top.

Computer Mainframe Image With Various Wires Ppt PowerPoint Presentation Visual Aids Gallery PDF
Presenting computer mainframe image with various wires ppt powerpoint presentation visual aids gallery pdf to dispense important information. This template comprises three stages. It also presents valuable insights into the topics including computer mainframe image with various wires. This is a completely customizable PowerPoint theme that can be put to use immediately. So, download it and address the topic impactfully.
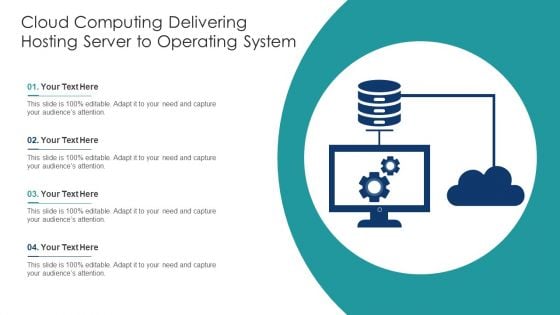
Cloud Computing Delivering Hosting Server To Operating System Ppt Model Designs Download PDF
Presenting Cloud Computing Delivering Hosting Server To Operating System Ppt Model Designs Download PDF to dispense important information. This template comprises four stages. It also presents valuable insights into the topics including Cloud Computing, Delivering Hosting Server, Operating System. This is a completely customizable PowerPoint theme that can be put to use immediately. So, download it and address the topic impactfully.

Cloud Computing To Deliver Hosting Server Over Internet Ppt Slides Layout Ideas PDF
Presenting Cloud Computing To Deliver Hosting Server Over Internet Ppt Slides Layout Ideas PDF to dispense important information. This template comprises four stages. It also presents valuable insights into the topics including Cloud Computing, Deliver Hosting, Server Over Internet. This is a completely customizable PowerPoint theme that can be put to use immediately. So, download it and address the topic impactfully.
Cloud Server Hosting For Connecting Services Ppt Model Rules PDF
Presenting Cloud Server Hosting For Connecting Services Ppt Model Rules PDF to dispense important information. This template comprises four stages. It also presents valuable insights into the topics including Cloud Server Hosting, Connecting Services. This is a completely customizable PowerPoint theme that can be put to use immediately. So, download it and address the topic impactfully.
Factors For Cloud Computing Security Assessment Ppt Gallery Deck PDF
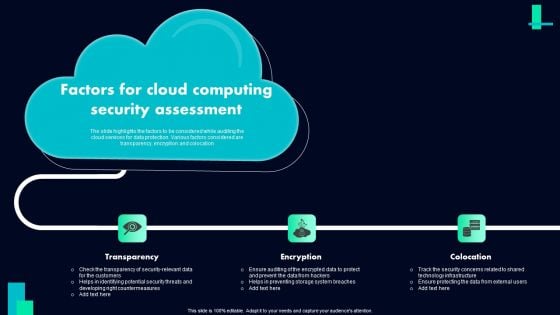
Presenting Factors For Cloud Computing Security Assessment Ppt Gallery Deck PDF to dispense important information. This template comprises three stages. It also presents valuable insights into the topics including Factors For, Cloud Computing, Security Assessment. This is a completely customizable PowerPoint theme that can be put to use immediately. So, download it and address the topic impactfully.
Big Data Management In Finance Sector Ppt PowerPoint Presentation File Diagrams PDF
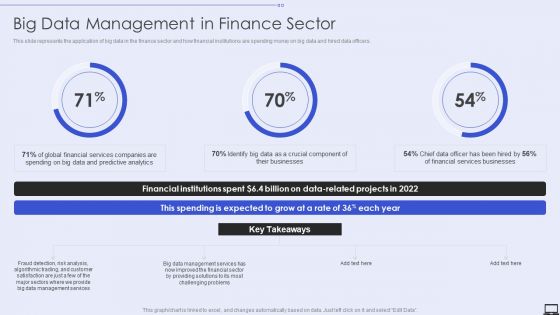
This slide represents the application of big data in the finance sector and how financial institutions are spending money on big data and hired data officers. Deliver and pitch your topic in the best possible manner with this Big Data Management In Finance Sector Ppt PowerPoint Presentation File Diagrams PDF. Use them to share invaluable insights on Big Data Management Services, Risk Analysis, Global Financial Services and impress your audience. This template can be altered and modified as per your expectations. So, grab it now.
Trends In Sales Management Presentation Diagrams
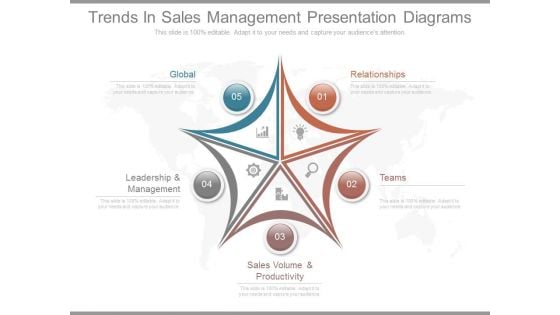
This is a trends in sales management presentation diagrams. This is a five stage process. The stages in this process are global, leadership and management, sales volume and productivity, relationships, teams.
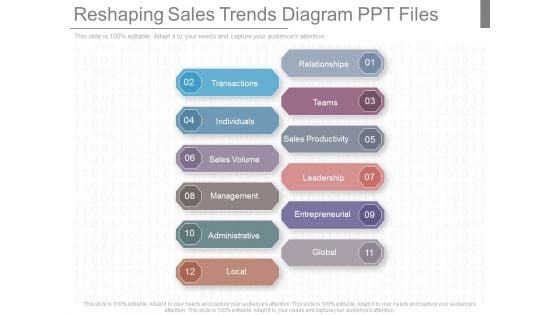
Reshaping Sales Trends Diagram Ppt Files
This is a reshaping sales trends diagram ppt files. This is a twelve stage process. The stages in this process are relationships, transactions, teams, individuals, sales productivity, sales volume, leadership, management, entrepreneurial, administrative, global, local.
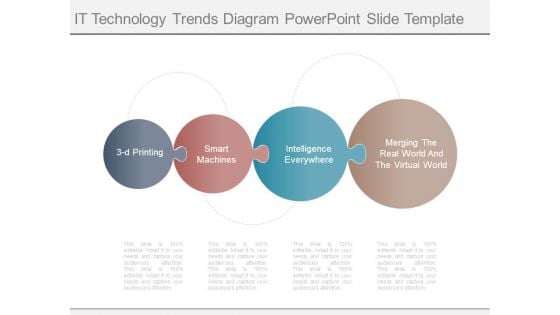
It Technology Trends Diagram Powerpoint Slide Template
This is a it technology trends diagram powerpoint slide template. This is a four stage process. The stages in this process are 3 d printing, smart machines, intelligence everywhere, merging the real world and the virtual world.
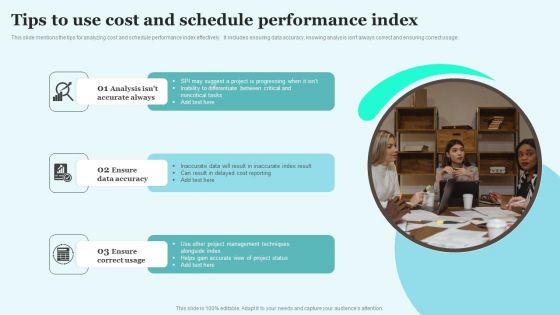
Tips To Use Cost And Schedule Performance Index Diagrams PDF
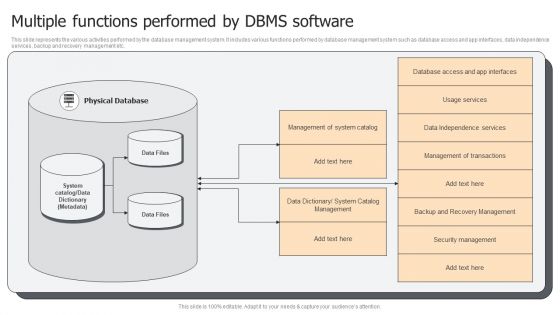
Multiple Functions Performed By DBMS Software Ppt PowerPoint Presentation File Graphics Template PDF
This slide represents the various activities performed by the database management system. It includes various functions performed by database management system such as database access and app interfaces, data independence services, backup and recovery management etc. Presenting Multiple Functions Performed By DBMS Software Ppt PowerPoint Presentation File Graphics Template PDF to dispense important information. This template comprises one stages. It also presents valuable insights into the topics including Physical Database, Data Files, System Catalog. This is a completely customizable PowerPoint theme that can be put to use immediately. So, download it and address the topic impactfully.
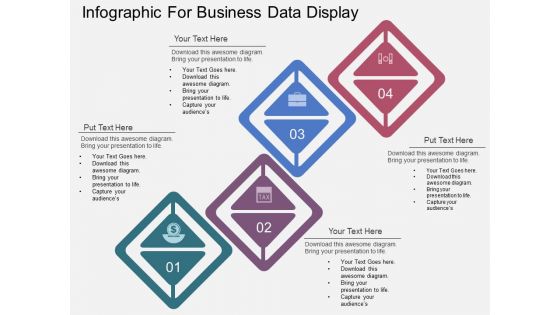
Four Steps Infographic For Business Data Display Powerpoint Template
This PowerPoint template has been designed with four steps infographic layout. This diagram can be used to display business data in visual manner. Capture the attention of your audience with this slide.
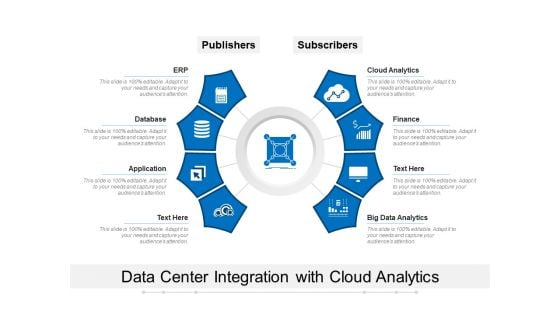
Data Center Integration With Cloud Analytics Ppt PowerPoint Presentation Slides Deck PDF
Presenting data center integration with cloud analytics ppt powerpoint presentation slides deck pdf to dispense important information. This template comprises eight stages. It also presents valuable insights into the topics including database, application, finance, big data analytics, cloud analytics, erp. This is a completely customizable PowerPoint theme that can be put to use immediately. So, download it and address the topic impactfully.
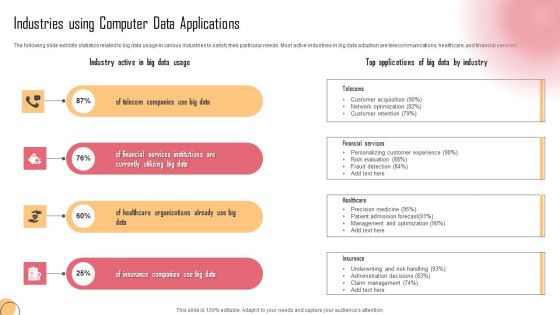
Industries Using Computer Data Applications Professional PDF
The following slide exhibits statistics related to big data usage in various industries to satisfy their particular needs. Most active industries in big data adoption are telecommunications, healthcare, and financial services. Presenting Industries Using Computer Data Applications Professional PDF to dispense important information. This template comprises four stages. It also presents valuable insights into the topics including Telecoms, Financial Services, Healthcare. This is a completely customizable PowerPoint theme that can be put to use immediately. So, download it and address the topic impactfully.
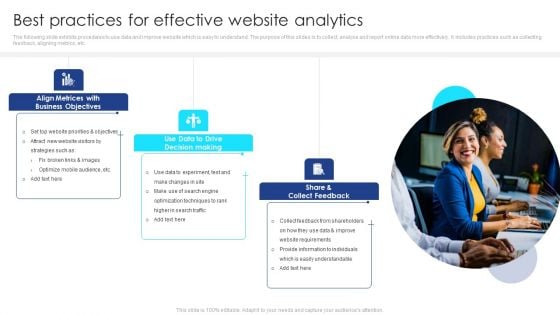
Best Practices For Effective Website Analytics Inspiration PDF
The following slide exhibits procedures to use data and improve website which is easy to understand. The purpose of this slides is to collect, analyse and report online data more effectively. It includes practices such as collecting feedback, aligning metrics, etc. Presenting Best Practices For Effective Website Analytics Inspiration PDF to dispense important information. This template comprises three stages. It also presents valuable insights into the topics including Align Metrices Business Objectives, Data Drive Decision Making, Share And Collect Feedback. This is a completely customizable PowerPoint theme that can be put to use immediately. So, download it and address the topic impactfully.
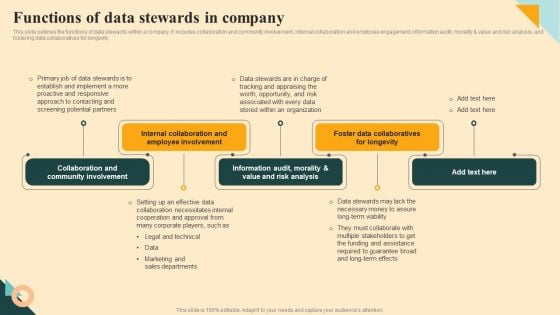
Functions Of Data Stewards In Company Themes PDF
This slide outlines the functions of data stewards within a company. It includes collaboration and community involvement, internal collaboration and employee engagement, information audit, morality and value and risk analysis, and fostering data collaboratives for longevity. Formulating a presentation can take up a lot of effort and time, so the content and message should always be the primary focus. The visuals of the PowerPoint can enhance the presenters message, so our Functions Of Data Stewards In Company Themes PDF was created to help save time. Instead of worrying about the design, the presenter can concentrate on the message while our designers work on creating the ideal templates for whatever situation is needed. Slidegeeks has experts for everything from amazing designs to valuable content, we have put everything into Functions Of Data Stewards In Company Themes PDF.
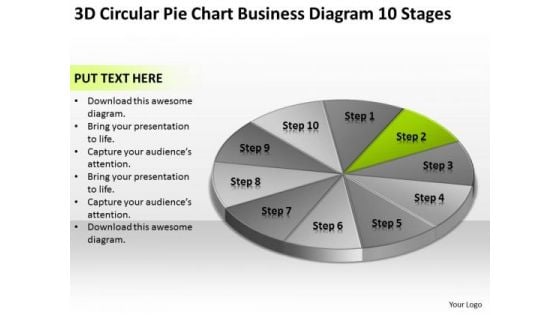
Circular Pie Chart Business Diagram 10 Stages Plan PowerPoint Slides
We present our circular pie chart business diagram 10 stages plan PowerPoint Slides.Present our Business PowerPoint Templates because Our PowerPoint Templates and Slides are conceived by a dedicated team. Use them and give form to your wondrous ideas. Present our Finance PowerPoint Templates because Our PowerPoint Templates and Slides are created with admirable insight. Use them and give your group a sense of your logical mind. Use our Circle Charts PowerPoint Templates because Our PowerPoint Templates and Slides come in all colours, shades and hues. They help highlight every nuance of your views. Download our Shapes PowerPoint Templates because Our PowerPoint Templates and Slides will let your team Walk through your plans. See their energy levels rise as you show them the way. Download and present our Process and Flows PowerPoint Templates because Timeline crunches are a fact of life. Meet all deadlines using our PowerPoint Templates and Slides.Use these PowerPoint slides for presentations relating to Chart, donut, market, isolated, diminishing, rate, downtrend, business, three-dimensional, success, presentation, diagram, circle, uptrend, percentage, graphic, finance, data, stock, holdings, report, marketing, analyzing, trading, graph, illustration, pie, sale, up, money, design, currency, growth, descriptive, representing, painting, moving, progress, part, increases, background, investment, index, financial, multi, counter. The prominent colors used in the PowerPoint template are Green, Gray, White. Our Circular Pie Chart Business Diagram 10 Stages Plan PowerPoint Slides are a great feeder line. They keep the energy coming to you.

Financial Analyst Growth Chart Presentation Diagrams
This is a financial analyst growth chart presentation diagrams. This is a three stage process. The stages in this process are reporting, growth, analysis.
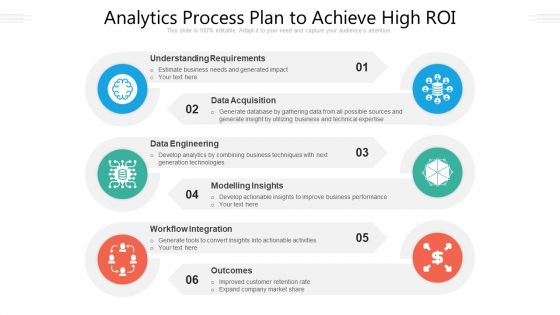
Analytics Process Plan To Achieve High ROI Ppt PowerPoint Presentation Gallery Graphic Tips PDF
Presenting analytics process plan to achieve high roi ppt powerpoint presentation gallery graphic tips pdf to dispense important information. This template comprises six stages. It also presents valuable insights into the topics including data acquisition, data engineering, workflow integration. This is a completely customizable PowerPoint theme that can be put to use immediately. So, download it and address the topic impactfully.
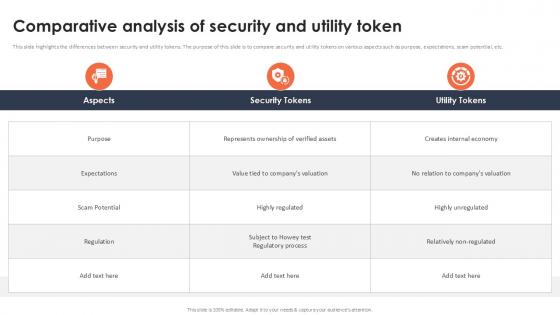
Comparative Analysis Of Security And Utility Token Securing Your Data Ppt Template
This slide highlights the differences between security and utility tokens. The purpose of this slide is to compare security and utility tokens on various aspects such as purpose, expectations, scam potential, etc. Whether you have daily or monthly meetings, a brilliant presentation is necessary. Comparative Analysis Of Security And Utility Token Securing Your Data Ppt Template can be your best option for delivering a presentation. Represent everything in detail using Comparative Analysis Of Security And Utility Token Securing Your Data Ppt Template and make yourself stand out in meetings. The template is versatile and follows a structure that will cater to your requirements. All the templates prepared by Slidegeeks are easy to download and edit. Our research experts have taken care of the corporate themes as well. So, give it a try and see the results. This slide highlights the differences between security and utility tokens. The purpose of this slide is to compare security and utility tokens on various aspects such as purpose, expectations, scam potential, etc.

 Home
Home