Dashboards Construction
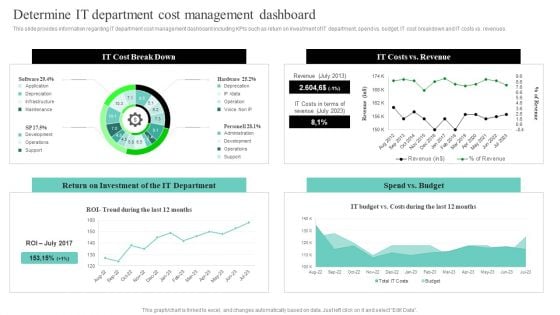
IT Cost Reduction Strategies Determine IT Department Cost Management Dashboard Guidelines PDF
This slide provides information regarding IT department cost management dashboard including KPIs such as return on investment of IT department, spend vs. budget, IT cost breakdown and IT costs vs. revenues. Get a simple yet stunning designed IT Cost Reduction Strategies Determine IT Department Cost Management Dashboard Guidelines PDF. It is the best one to establish the tone in your meetings. It is an excellent way to make your presentations highly effective. So, download this PPT today from Slidegeeks and see the positive impacts. Our easy-to-edit IT Cost Reduction Strategies Determine IT Department Cost Management Dashboard Guidelines PDF can be your go-to option for all upcoming conferences and meetings. So, what are you waiting for Grab this template today.
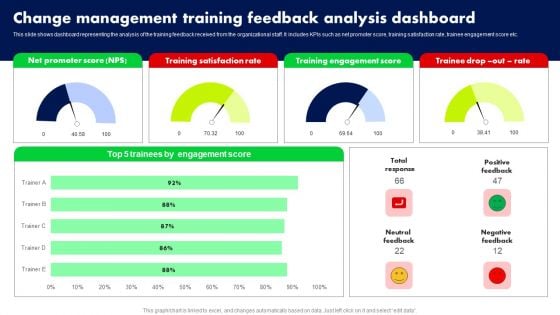
Change Management Training Feedback Analysis Dashboard Ppt PowerPoint Presentation File Diagrams PDF
This slide shows dashboard representing the analysis of the training feedback received from the organizational staff. It includes KPIs such as net promoter score, training satisfaction rate, trainee engagement score etc. Get a simple yet stunning designed Change Management Training Feedback Analysis Dashboard Ppt PowerPoint Presentation File Diagrams PDF. It is the best one to establish the tone in your meetings. It is an excellent way to make your presentations highly effective. So, download this PPT today from Slidegeeks and see the positive impacts. Our easy to edit Change Management Training Feedback Analysis Dashboard Ppt PowerPoint Presentation File Diagrams PDF can be your go to option for all upcoming conferences and meetings. So, what are you waiting for Grab this template today.
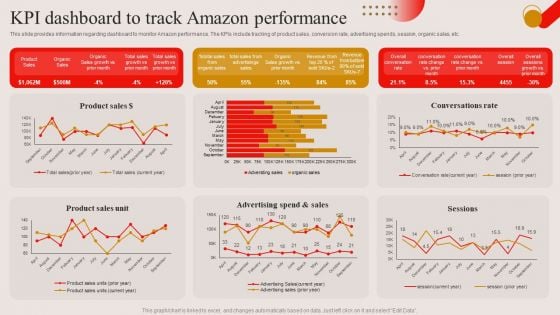
KPI Dashboard To Track Amazon Performance Ppt PowerPoint Presentation Diagram Lists PDF
This slide provides information regarding dashboard to monitor Amazon performance. The KPIs include tracking of product sales, conversion rate, advertising spends, session, organic sales, etc. Explore a selection of the finest KPI Dashboard To Track Amazon Performance Ppt PowerPoint Presentation Diagram Lists PDF here. With a plethora of professionally designed and pre made slide templates, you can quickly and easily find the right one for your upcoming presentation. You can use our KPI Dashboard To Track Amazon Performance Ppt PowerPoint Presentation Diagram Lists PDF to effectively convey your message to a wider audience. Slidegeeks has done a lot of research before preparing these presentation templates. The content can be personalized and the slides are highly editable. Grab templates today from Slidegeeks.
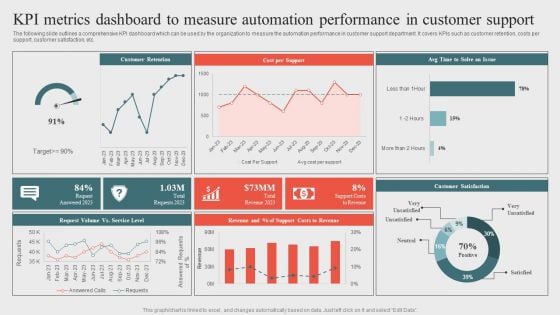
Kpi Metrics Dashboard To Measure Automation Performanceoptimizing Business Processes Through Automation Download PDF
The following slide outlines a comprehensive KPI dashboard which can be used by the organization to measure the automation performance in customer support department. It covers KPIs such as customer retention, costs per support, customer satisfaction, etc. Get a simple yet stunning designed Kpi Metrics Dashboard To Measure Automation Performanceoptimizing Business Processes Through Automation Download PDF. It is the best one to establish the tone in your meetings. It is an excellent way to make your presentations highly effective. So, download this PPT today from Slidegeeks and see the positive impacts. Our easy to edit Kpi Metrics Dashboard To Measure Automation Performanceoptimizing Business Processes Through Automation Download PDF can be your go to option for all upcoming conferences and meetings. So, what are you waiting for Grab this template today.
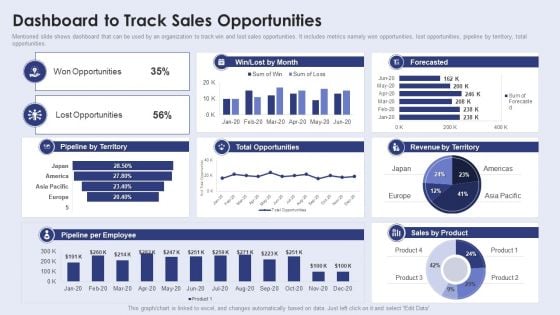
Creating New Product Launch Campaign Strategy Dashboard To Track Sales Opportunities Professional PDF
Mentioned slide shows dashboard that can be used by an organization to track win and lost sales opportunities. It includes metrics namely won opportunities, lost opportunities, pipeline by territory, total opportunities. Formulating a presentation can take up a lot of effort and time, so the content and message should always be the primary focus. The visuals of the PowerPoint can enhance the presenters message, so our Creating New Product Launch Campaign Strategy Dashboard To Track Sales Opportunities Professional PDF was created to help save time. Instead of worrying about the design, the presenter can concentrate on the message while our designers work on creating the ideal templates for whatever situation is needed. Slidegeeks has experts for everything from amazing designs to valuable content, we have put everything into Creating New Product Launch Campaign Strategy Dashboard To Track Sales Opportunities Professional PDF
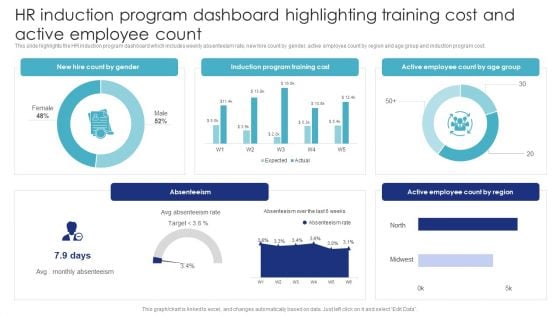
HR Induction Program Dashboard Highlighting Training Cost And Active Employee Count Brochure PDF
This slide highlights the HR induction program dashboard which includes weekly absenteeism rate, new hire count by gender, active employee count by region and age group and induction program cost. Formulating a presentation can take up a lot of effort and time, so the content and message should always be the primary focus. The visuals of the PowerPoint can enhance the presenters message, so our HR Induction Program Dashboard Highlighting Training Cost And Active Employee Count Brochure PDF was created to help save time. Instead of worrying about the design, the presenter can concentrate on the message while our designers work on creating the ideal templates for whatever situation is needed. Slidegeeks has experts for everything from amazing designs to valuable content, we have put everything into HR Induction Program Dashboard Highlighting Training Cost And Active Employee Count Brochure PDF.
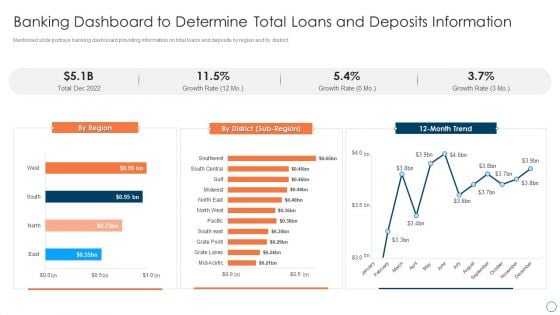
BPM Tools Application To Increase Banking Dashboard To Determine Total Loans Information PDF
Mentioned slide portrays banking dashboard providing information on total loans and deposits by region and by district. Formulating a presentation can take up a lot of effort and time, so the content and message should always be the primary focus. The visuals of the PowerPoint can enhance the presenters message, so our BPM Tools Application To Increase Banking Dashboard To Determine Total Loans Information PDF was created to help save time. Instead of worrying about the design, the presenter can concentrate on the message while our designers work on creating the ideal templates for whatever situation is needed. Slidegeeks has experts for everything from amazing designs to valuable content, we have put everything into BPM Tools Application To Increase Banking Dashboard To Determine Total Loans Information PDF.
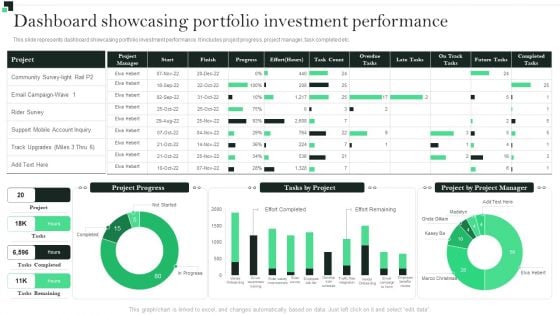
Dashboard Showcasing Portfolio Investment Performance Strategies To Enhance Portfolio Management Summary PDF
This slide represents dashboard showcasing portfolio investment performance. It includes project progress, project manager, task completed etc.Formulating a presentation can take up a lot of effort and time, so the content and message should always be the primary focus. The visuals of the PowerPoint can enhance the presenters message, so our Dashboard Showcasing Portfolio Investment Performance Strategies To Enhance Portfolio Management Summary PDF was created to help save time. Instead of worrying about the design, the presenter can concentrate on the message while our designers work on creating the ideal templates for whatever situation is needed. Slidegeeks has experts for everything from amazing designs to valuable content, we have put everything into Dashboard Showcasing Portfolio Investment Performance Strategies To Enhance Portfolio Management Summary PDF.
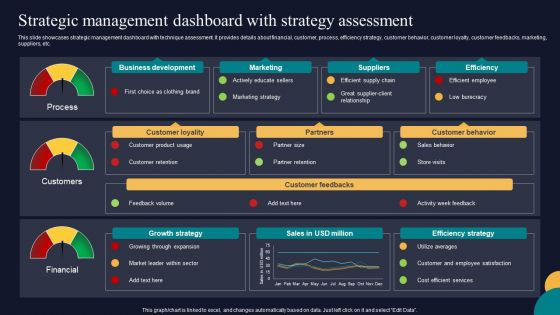
Strategic Management Dashboard With Strategy Assessment Tactics To Gain Sustainable Competitive Edge Pictures PDF
This slide showcases strategic management dashboard with technique assessment. It provides details about financial, customer, process, efficiency strategy, customer behavior, customer loyalty, customer feedbacks, marketing, suppliers, etc. Formulating a presentation can take up a lot of effort and time, so the content and message should always be the primary focus. The visuals of the PowerPoint can enhance the presenters message, so our Strategic Management Dashboard With Strategy Assessment Tactics To Gain Sustainable Competitive Edge Pictures PDF was created to help save time. Instead of worrying about the design, the presenter can concentrate on the message while our designers work on creating the ideal templates for whatever situation is needed. Slidegeeks has experts for everything from amazing designs to valuable content, we have put everything into Strategic Management Dashboard With Strategy Assessment Tactics To Gain Sustainable Competitive Edge Pictures PDF.
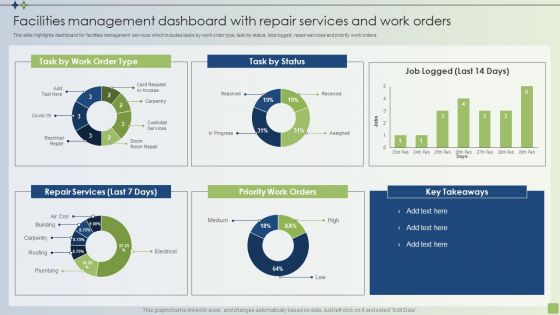
Strategic FM Services Facilities Management Dashboard With Repair Services And Work Orders Infographics PDF
This slide highlights dashboard for facilities management services which includes tasks by work order type, task by status, lobs logged, repair services and priority work orders. Formulating a presentation can take up a lot of effort and time, so the content and message should always be the primary focus. The visuals of the PowerPoint can enhance the presenters message, so our Strategic FM Services Facilities Management Dashboard With Repair Services And Work Orders Infographics PDF was created to help save time. Instead of worrying about the design, the presenter can concentrate on the message while our designers work on creating the ideal templates for whatever situation is needed. Slidegeeks has experts for everything from amazing designs to valuable content, we have put everything into Strategic FM Services Facilities Management Dashboard With Repair Services And Work Orders Infographics PDF.
New Staff Onboarding Program HR Induction Dashboard Highlighting Employee Headcount And Turnover Ratio Icons PDF
This slide highlights the HR induction dashboard which includes average salary, headcount, turnover rate, employees hired and employees left rate, average age with employment contract and status. Formulating a presentation can take up a lot of effort and time, so the content and message should always be the primary focus. The visuals of the PowerPoint can enhance the presenters message, so our New Staff Onboarding Program HR Induction Dashboard Highlighting Employee Headcount And Turnover Ratio Icons PDF was created to help save time. Instead of worrying about the design, the presenter can concentrate on the message while our designers work on creating the ideal templates for whatever situation is needed. Slidegeeks has experts for everything from amazing designs to valuable content, we have put everything into New Staff Onboarding Program HR Induction Dashboard Highlighting Employee Headcount And Turnover Ratio Icons PDF.
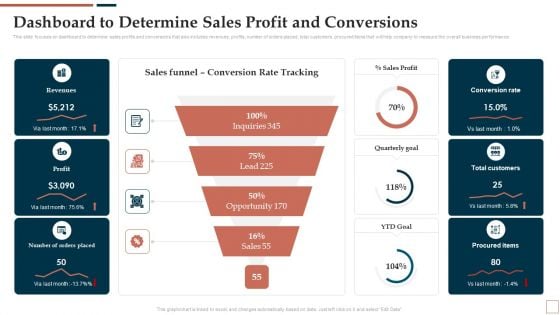
BPR To Develop Operational Effectiveness Dashboard To Determine Sales Profit And Conversions Slides PDF
This slide focuses on dashboard to determine sales profits and conversions that also includes revenues, profits, number of orders placed, total customers, procured items that will help company to measure the overall business performance. Formulating a presentation can take up a lot of effort and time, so the content and message should always be the primary focus. The visuals of the PowerPoint can enhance the presenters message, so our BPR To Develop Operational Effectiveness Dashboard To Determine Sales Profit And Conversions Slides PDF was created to help save time. Instead of worrying about the design, the presenter can concentrate on the message while our designers work on creating the ideal templates for whatever situation is needed. Slidegeeks has experts for everything from amazing designs to valuable content, we have put everything into BPR To Develop Operational Effectiveness Dashboard To Determine Sales Profit And Conversions Slides PDF.
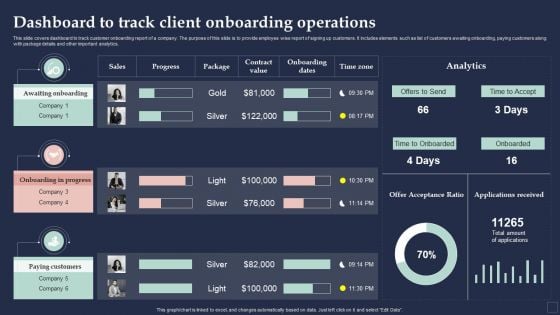
BPM System Methodology Dashboard To Track Client Onboarding Operations Sample PDF
This slide covers dashboard to track customer onboarding report of a company. The purpose of this slide is to provide employee wise report of signing up customers. It includes elements such as list of customers awaiting onboarding, paying customers along with package details and other important analytics. Formulating a presentation can take up a lot of effort and time, so the content and message should always be the primary focus. The visuals of the PowerPoint can enhance the presenters message, so our BPM System Methodology Dashboard To Track Client Onboarding Operations Sample PDF was created to help save time. Instead of worrying about the design, the presenter can concentrate on the message while our designers work on creating the ideal templates for whatever situation is needed. Slidegeeks has experts for everything from amazing designs to valuable content, we have put everything into BPM System Methodology Dashboard To Track Client Onboarding Operations Sample PDF
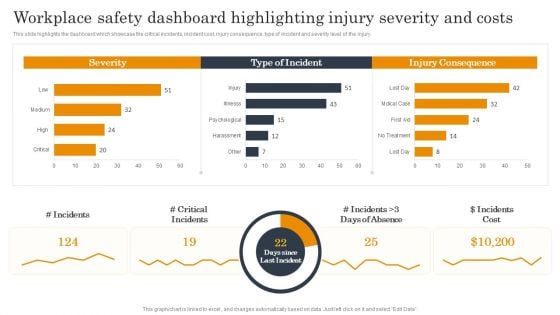
Employee Health And Safety Workplace Safety Dashboard Highlighting Injury Severity And Costs Sample PDF
This slide highlights the dashboard which showcase the critical incidents, incident cost, injury consequence, type of incident and severity level of the injury. Formulating a presentation can take up a lot of effort and time, so the content and message should always be the primary focus. The visuals of the PowerPoint can enhance the presenters message, so our Employee Health And Safety Workplace Safety Dashboard Highlighting Injury Severity And Costs Sample PDF was created to help save time. Instead of worrying about the design, the presenter can concentrate on the message while our designers work on creating the ideal templates for whatever situation is needed. Slidegeeks has experts for everything from amazing designs to valuable content, we have put everything into Employee Health And Safety Workplace Safety Dashboard Highlighting Injury Severity And Costs Sample PDF.
Effective Brand Reputation Management Customer Tracking Dashboard To Monitor Brand Introduction PDF
This slide provides information brand loyalty tracking dashboard in order to monitor customer engagement, average revenues, new vs. Returning visitors performance, etc. Formulating a presentation can take up a lot of effort and time, so the content and message should always be the primary focus. The visuals of the PowerPoint can enhance the presenters message, so our Effective Brand Reputation Management Customer Tracking Dashboard To Monitor Brand Introduction PDF was created to help save time. Instead of worrying about the design, the presenter can concentrate on the message while our designers work on creating the ideal templates for whatever situation is needed. Slidegeeks has experts for everything from amazing designs to valuable content, we have put everything into Effective Brand Reputation Management Customer Tracking Dashboard To Monitor Brand Introduction PDF.

Positive Impact Of Effective Dashboard To Track And Analyze Event Attendees Elements PDF
This slide showcases dashboard depicting tickets sold for event. It further includes total engagement, selling overview, registrations received and RSVP total count. Formulating a presentation can take up a lot of effort and time, so the content and message should always be the primary focus. The visuals of the PowerPoint can enhance the presenters message, so our Positive Impact Of Effective Dashboard To Track And Analyze Event Attendees Elements PDF was created to help save time. Instead of worrying about the design, the presenter can concentrate on the message while our designers work on creating the ideal templates for whatever situation is needed. Slidegeeks has experts for everything from amazing designs to valuable content, we have put everything intoPositive Impact Of Effective Dashboard To Track And Analyze Event Attendees Elements PDF.
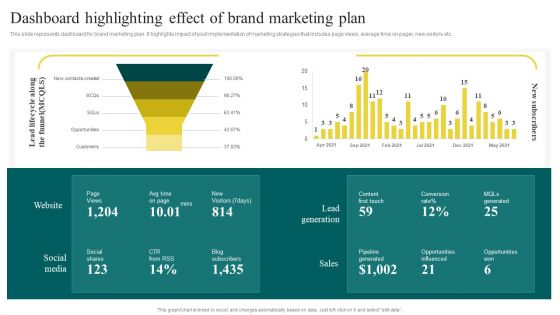
Yearly Brand Promotion Plan Dashboard Highlighting Effect Of Brand Marketing Plan Pictures PDF
This slide represents dashboard for brand marketing plan. It highlights impact of post implementation of marketing strategies that includes page views, average time on pager, new visitors etc. Formulating a presentation can take up a lot of effort and time, so the content and message should always be the primary focus. The visuals of the PowerPoint can enhance the presenters message, so our Yearly Brand Promotion Plan Dashboard Highlighting Effect Of Brand Marketing Plan Pictures PDF was created to help save time. Instead of worrying about the design, the presenter can concentrate on the message while our designers work on creating the ideal templates for whatever situation is needed. Slidegeeks has experts for everything from amazing designs to valuable content, we have put everything into Yearly Brand Promotion Plan Dashboard Highlighting Effect Of Brand Marketing Plan Pictures PDF.
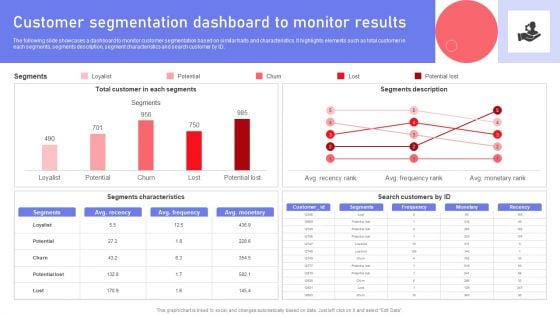
Customer Segmentation Dashboard To Monitor Results Ppt PowerPoint Presentation File Deck PDF
The following slide showcases a dashboard to monitor customer segmentation based on similar traits and characteristics. It highlights elements such as total customer in each segments, segments description, segment characteristics and search customer by ID. Formulating a presentation can take up a lot of effort and time, so the content and message should always be the primary focus. The visuals of the PowerPoint can enhance the presenters message, so our Customer Segmentation Dashboard To Monitor Results Ppt PowerPoint Presentation File Deck PDF was created to help save time. Instead of worrying about the design, the presenter can concentrate on the message while our designers work on creating the ideal templates for whatever situation is needed. Slidegeeks has experts for everything from amazing designs to valuable content, we have put everything into Customer Segmentation Dashboard To Monitor Results Ppt PowerPoint Presentation File Deck PDF.
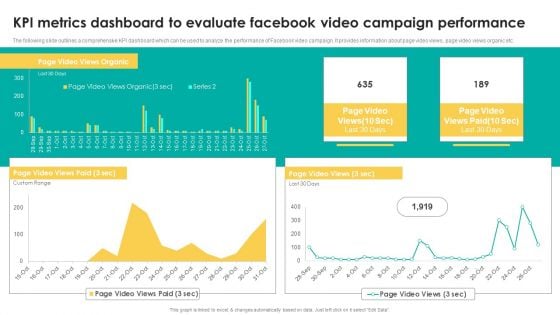
KPI Metrics Dashboard To Evaluate Facebook Video Campaign Performance Introduction PDF
The following slide outlines a comprehensive KPI dashboard which can be used to analyze the performance of Facebook video campaign. It provides information about page video views, page video views organic etc. Formulating a presentation can take up a lot of effort and time, so the content and message should always be the primary focus. The visuals of the PowerPoint can enhance the presenters message, so our KPI Metrics Dashboard To Evaluate Facebook Video Campaign Performance Introduction PDF was created to help save time. Instead of worrying about the design, the presenter can concentrate on the message while our designers work on creating the ideal templates for whatever situation is needed. Slidegeeks has experts for everything from amazing designs to valuable content, we have put everything into KPI Metrics Dashboard To Evaluate Facebook Video Campaign Performance Introduction PDF.
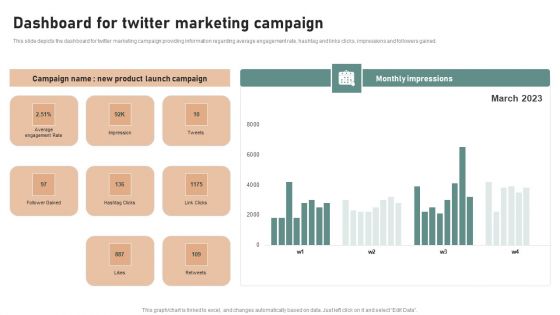
Utilizing Twitter For Social Media Dashboard For Twitter Marketing Campaign Mockup PDF
This slide depicts the dashboard for twitter marketing campaign providing information regarding average engagement rate, hashtag and links clicks, impressions and followers gained. Formulating a presentation can take up a lot of effort and time, so the content and message should always be the primary focus. The visuals of the PowerPoint can enhance the presenters message, so our Utilizing Twitter For Social Media Dashboard For Twitter Marketing Campaign Mockup PDF was created to help save time. Instead of worrying about the design, the presenter can concentrate on the message while our designers work on creating the ideal templates for whatever situation is needed. Slidegeeks has experts for everything from amazing designs to valuable content, we have put everything into Utilizing Twitter For Social Media Dashboard For Twitter Marketing Campaign Mockup PDF.
IT Alignment For Strategic Dashboard For Tracking Business And IT Alignment Professional PDF
This slide depicts the dashboard for business and IT alignment by covering details of total sales, customer support service, percentage of business operations aligned IT, usage of communication channels, and top performer associates. Formulating a presentation can take up a lot of effort and time, so the content and message should always be the primary focus. The visuals of the PowerPoint can enhance the presenters message, so our IT Alignment For Strategic Dashboard For Tracking Business And IT Alignment Professional PDF was created to help save time. Instead of worrying about the design, the presenter can concentrate on the message while our designers work on creating the ideal templates for whatever situation is needed. Slidegeeks has experts for everything from amazing designs to valuable content, we have put everything into IT Alignment For Strategic Dashboard For Tracking Business And IT Alignment Professional PDF.
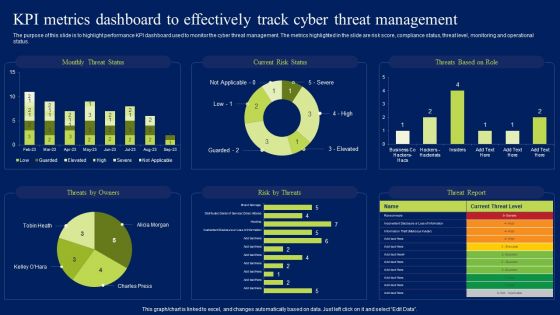
Kpi Metrics Dashboard To Effectively Track Cyber Threat Management Ppt Styles Guide PDF
The purpose of this slide is to highlight performance KPI dashboard used to monitor the cyber threat management. The metrics highlighted in the slide are risk score, compliance status, threat level, monitoring and operational status. Formulating a presentation can take up a lot of effort and time, so the content and message should always be the primary focus. The visuals of the PowerPoint can enhance the presenters message, so our Kpi Metrics Dashboard To Effectively Track Cyber Threat Management Ppt Styles Guide PDF was created to help save time. Instead of worrying about the design, the presenter can concentrate on the message while our designers work on creating the ideal templates for whatever situation is needed. Slidegeeks has experts for everything from amazing designs to valuable content, we have put everything into Kpi Metrics Dashboard To Effectively Track Cyber Threat Management Ppt Styles Guide PDF.
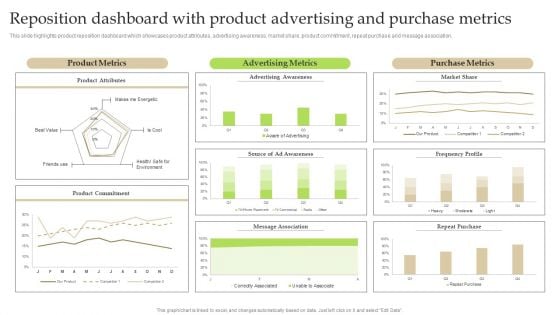
Reposition Dashboard With Product Advertising And Purchase Metrics Ppt PowerPoint Presentation File Show PDF
This slide highlights product reposition dashboard which showcases product attributes, advertising awareness, market share, product commitment, repeat purchase and message association. Formulating a presentation can take up a lot of effort and time, so the content and message should always be the primary focus. The visuals of the PowerPoint can enhance the presenters message, so our Reposition Dashboard With Product Advertising And Purchase Metrics Ppt PowerPoint Presentation File Show PDF was created to help save time. Instead of worrying about the design, the presenter can concentrate on the message while our designers work on creating the ideal templates for whatever situation is needed. Slidegeeks has experts for everything from amazing designs to valuable content, we have put everything into Reposition Dashboard With Product Advertising And Purchase Metrics Ppt PowerPoint Presentation File Show PDF
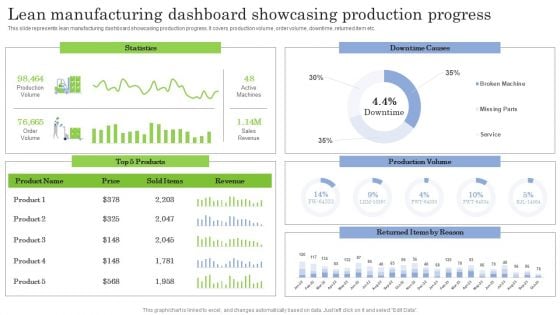
Lean Manufacturing Dashboard Showcasing Production Progress Ppt PowerPoint Presentation File Model PDF
This slide represents lean manufacturing dashboard showcasing production progress. It covers production volume, order volume, downtime, returned item etc. Formulating a presentation can take up a lot of effort and time, so the content and message should always be the primary focus. The visuals of the PowerPoint can enhance the presenters message, so our Lean Manufacturing Dashboard Showcasing Production Progress Ppt PowerPoint Presentation File Model PDF was created to help save time. Instead of worrying about the design, the presenter can concentrate on the message while our designers work on creating the ideal templates for whatever situation is needed. Slidegeeks has experts for everything from amazing designs to valuable content, we have put everything into Lean Manufacturing Dashboard Showcasing Production Progress Ppt PowerPoint Presentation File Model PDF
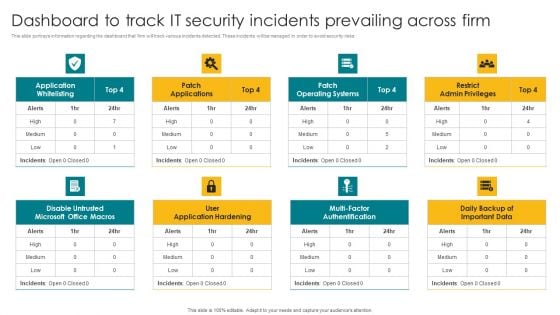
Dashboard To Track IT Security Incidents Prevailing Across Firm Elements PDF
This slide portrays information regarding the dashboard that firm will track various incidents detected. These incidents will be managed in order to avoid security risks. Formulating a presentation can take up a lot of effort and time, so the content and message should always be the primary focus. The visuals of the PowerPoint can enhance the presenters message, so our Dashboard To Track IT Security Incidents Prevailing Across Firm Elements PDF was created to help save time. Instead of worrying about the design, the presenter can concentrate on the message while our designers work on creating the ideal templates for whatever situation is needed. Slidegeeks has experts for everything from amazing designs to valuable content, we have put everything into Dashboard To Track IT Security Incidents Prevailing Across Firm Elements PDF.
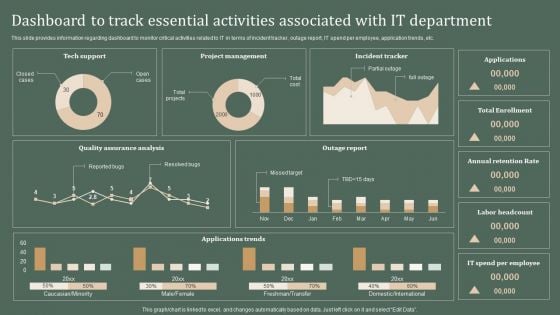
Deploying Corporate Aligned IT Strategy Dashboard To Track Essential Activities Associated With IT Department Structure PDF
This slide provides information regarding dashboard to monitor critical activities related to IT in terms of incident tracker, outage report, IT spend per employee, application trends, etc. Formulating a presentation can take up a lot of effort and time, so the content and message should always be the primary focus. The visuals of the PowerPoint can enhance the presenters message, so our Deploying Corporate Aligned IT Strategy Dashboard To Track Essential Activities Associated With IT Department Structure PDF was created to help save time. Instead of worrying about the design, the presenter can concentrate on the message while our designers work on creating the ideal templates for whatever situation is needed. Slidegeeks has experts for everything from amazing designs to valuable content, we have put everything into Deploying Corporate Aligned IT Strategy Dashboard To Track Essential Activities Associated With IT Department Structure PDF
Influencers Marketing Campaign Performance Tracking Dashboard Ppt PowerPoint Presentation Diagram Lists PDF
This slide covers performance monitoring dashboard of influencer based referral marketing program. It includes elements such as impressions on Instagram, likes, comments, clicks, sales generated along with value calculators and campaign breakdown based on gender and age. Formulating a presentation can take up a lot of effort and time, so the content and message should always be the primary focus. The visuals of the PowerPoint can enhance the presenters message, so our Influencers Marketing Campaign Performance Tracking Dashboard Ppt PowerPoint Presentation Diagram Lists PDF was created to help save time. Instead of worrying about the design, the presenter can concentrate on the message while our designers work on creating the ideal templates for whatever situation is needed. Slidegeeks has experts for everything from amazing designs to valuable content, we have put everything into Influencers Marketing Campaign Performance Tracking Dashboard Ppt PowerPoint Presentation Diagram Lists PDF
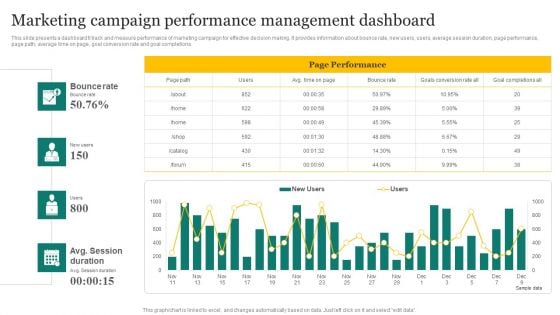
Strategic Promotion Plan Development Stages Marketing Campaign Performance Management Dashboard Formats PDF
This slide presents a dashboard ti track and measure performance of marketing campaign for effective decision making. It provides information about bounce rate, new users, users, average session duration, page performance, page path, average time on page, goal conversion rate and goal completions. Formulating a presentation can take up a lot of effort and time, so the content and message should always be the primary focus. The visuals of the PowerPoint can enhance the presenters message, so our Strategic Promotion Plan Development Stages Marketing Campaign Performance Management Dashboard Formats PDF was created to help save time. Instead of worrying about the design, the presenter can concentrate on the message while our designers work on creating the ideal templates for whatever situation is needed. Slidegeeks has experts for everything from amazing designs to valuable content, we have put everything into Strategic Promotion Plan Development Stages Marketing Campaign Performance Management Dashboard Formats PDF
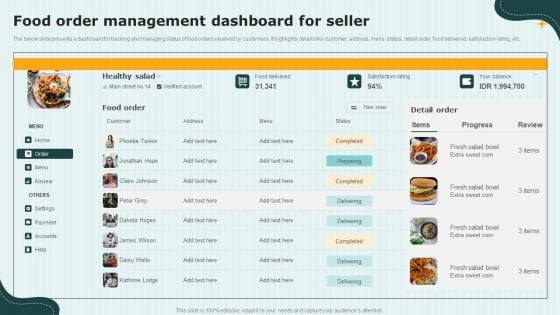
International Cloud Kitchen Industry Analysis Food Order Management Dashboard For Seller Slides PDF
The below slide presents a dashboard for tracking and managing status of food orders received by customers. It highlights details like customer, address, menu, status, detail order, food delivered, satisfaction rating, etc. Formulating a presentation can take up a lot of effort and time, so the content and message should always be the primary focus. The visuals of the PowerPoint can enhance the presenters message, so our International Cloud Kitchen Industry Analysis Food Order Management Dashboard For Seller Slides PDF was created to help save time. Instead of worrying about the design, the presenter can concentrate on the message while our designers work on creating the ideal templates for whatever situation is needed. Slidegeeks has experts for everything from amazing designs to valuable content, we have put everything into International Cloud Kitchen Industry Analysis Food Order Management Dashboard For Seller Slides PDF
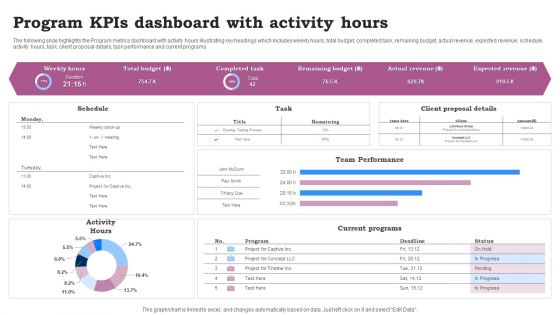
Program Kpis Dashboard With Activity Hours Ppt Infographics Clipart Images PDF
The following slide highlights the Program metrics dashboard with activity hours illustrating key headings which includes weekly hours, total budget, completed task, remaining budget, actual revenue, expected revenue, schedule, activity hours, task, client proposal details, task performance and current programs. Pitch your topic with ease and precision using this Program Kpis Dashboard With Activity Hours Ppt Infographics Clipart Images PDF. This layout presents information on Team Performance, Current Programs, Activity Hours. It is also available for immediate download and adjustment. So, changes can be made in the color, design, graphics or any other component to create a unique layout.
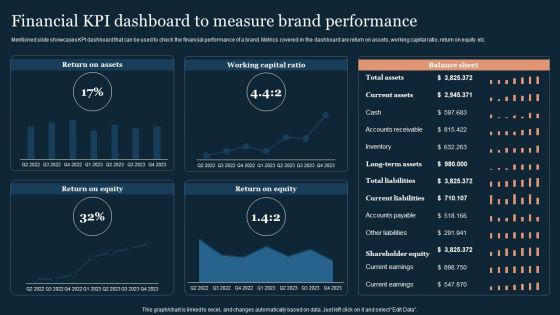
Guide To Develop And Estimate Brand Value Financial KPI Dashboard To Measure Brand Performance Formats PDF
Mentioned slide showcases KPI dashboard that can be used to check the financial performance of a brand. Metrics covered in the dashboard are return on assets, working capital ratio, return on equity etc.Coming up with a presentation necessitates that the majority of the effort goes into the content and the message you intend to convey. The visuals of a PowerPoint presentation can only be effective if it supplements and supports the story that is being told. Keeping this in mind our experts created Guide To Develop And Estimate Brand Value Financial KPI Dashboard To Measure Brand Performance Formats PDF to reduce the time that goes into designing the presentation. This way, you can concentrate on the message while our designers take care of providing you with the right template for the situation.
Deploying Cloud Technology Cloud Platform Dashboard For Tracking Project Team Activities Ppt Inspiration Summary PDF
The following slide depicts project team task tracking cloud dashboard. It provides information about hours worked, projects worked, time spent, daily limit, product design, weekly activity, etc. Create an editable Deploying Cloud Technology Cloud Platform Dashboard For Tracking Project Team Activities Ppt Inspiration Summary PDF that communicates your idea and engages your audience. Whether you are presenting a business or an educational presentation, pre-designed presentation templates help save time. Deploying Cloud Technology Cloud Platform Dashboard For Tracking Project Team Activities Ppt Inspiration Summary PDF is highly customizable and very easy to edit, covering many different styles from creative to business presentations. Slidegeeks has creative team members who have crafted amazing templates. So, go and get them without any delay.
Cloud Platform Dashboard For Tracking Project Integrating Cloud Computing To Enhance Projects Effectiveness Demonstration PDF
The following slide depicts project team task tracking cloud dashboard. It provides information about hours worked, projects worked, time spent, daily limit, product design, weekly activity, etc. Create an editable Cloud Platform Dashboard For Tracking Project Integrating Cloud Computing To Enhance Projects Effectiveness Demonstration PDF that communicates your idea and engages your audience. Whether you are presenting a business or an educational presentation, pre designed presentation templates help save time. Cloud Platform Dashboard For Tracking Project Integrating Cloud Computing To Enhance Projects Effectiveness Demonstration PDF is highly customizable and very easy to edit, covering many different styles from creative to business presentations. Slidegeeks has creative team members who have crafted amazing templates. So, go and get them without any delay.
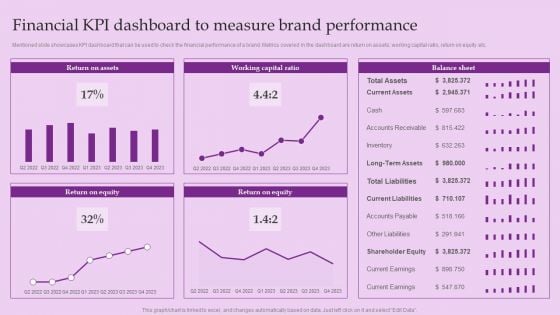
Financial KPI Dashboard To Measure Brand Performance Brand And Equity Evaluation Techniques Elements PDF
Mentioned slide showcases KPI dashboard that can be used to check the financial performance of a brand. Metrics covered in the dashboard are return on assets, working capital ratio, return on equity etc.Coming up with a presentation necessitates that the majority of the effort goes into the content and the message you intend to convey. The visuals of a PowerPoint presentation can only be effective if it supplements and supports the story that is being told. Keeping this in mind our experts created Financial KPI Dashboard To Measure Brand Performance Brand And Equity Evaluation Techniques Elements PDF to reduce the time that goes into designing the presentation. This way, you can concentrate on the message while our designers take care of providing you with the right template for the situation.
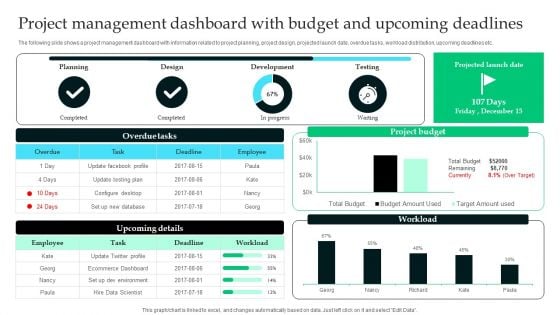
Analyzing The Economic Project Management Dashboard With Budget And Upcoming Graphics PDF
The following slide shows a project management dashboard with information related to project planning, project design, projected launch date, overdue tasks, workload distribution, upcoming deadlines etc. If you are looking for a format to display your unique thoughts, then the professionally designed Analyzing The Economic Project Management Dashboard With Budget And Upcoming Graphics PDF is the one for you. You can use it as a Google Slides template or a PowerPoint template. Incorporate impressive visuals, symbols, images, and other charts. Modify or reorganize the text boxes as you desire. Experiment with shade schemes and font pairings. Alter, share or cooperate with other people on your work. Download Analyzing The Economic Project Management Dashboard With Budget And Upcoming Graphics PDF and find out how to give a successful presentation. Present a perfect display to your team and make your presentation unforgettable.
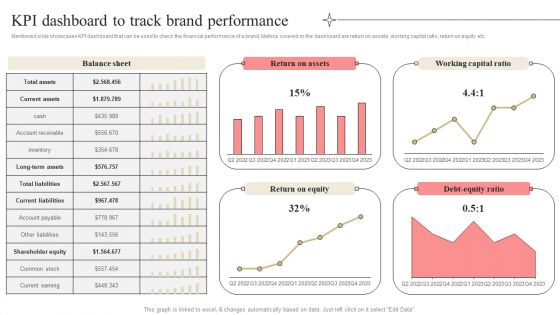
Developing Market Leading Businesses KPI Dashboard To Track Brand Performance Summary PDF
Mentioned slide showcases KPI dashboard that can be used to check the financial performance of a brand. Metrics covered in the dashboard are return on assets, working capital ratio, return on equity etc. Coming up with a presentation necessitates that the majority of the effort goes into the content and the message you intend to convey. The visuals of a PowerPoint presentation can only be effective if it supplements and supports the story that is being told. Keeping this in mind our experts created Developing Market Leading Businesses KPI Dashboard To Track Brand Performance Summary PDF to reduce the time that goes into designing the presentation. This way, you can concentrate on the message while our designers take care of providing you with the right template for the situation.
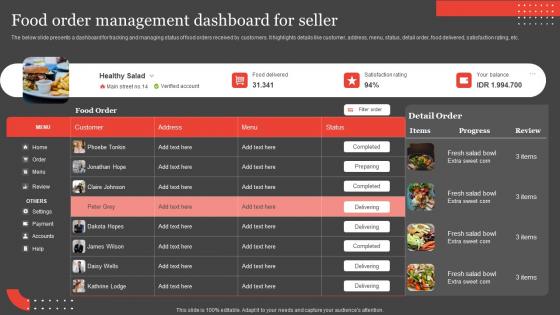
International Food Delivery Market Food Order Management Dashboard For Seller Graphics Pdf
The below slide presents a dashboard for tracking and managing status of food orders received by customers. It highlights details like customer, address, menu, status, detail order, food delivered, satisfaction rating, etc. Coming up with a presentation necessitates that the majority of the effort goes into the content and the message you intend to convey. The visuals of a PowerPoint presentation can only be effective if it supplements and supports the story that is being told. Keeping this in mind our experts created International Food Delivery Market Food Order Management Dashboard For Seller Graphics Pdf to reduce the time that goes into designing the presentation. This way, you can concentrate on the message while our designers take care of providing you with the right template for the situation. The below slide presents a dashboard for tracking and managing status of food orders received by customers. It highlights details like customer, address, menu, status, detail order, food delivered, satisfaction rating, etc.
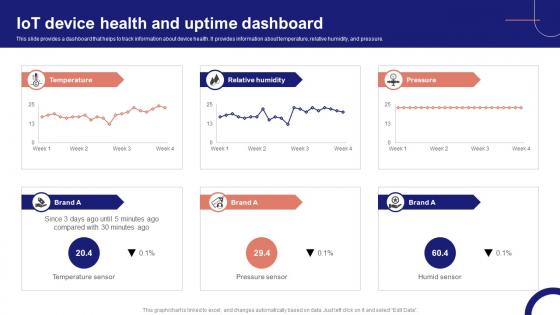
IoT Device Management Fundamentals IoT Device Health And Uptime Dashboard IoT Ss V
This slide provides a dashboard that helps to track information about device health. It provides information about temperature, relative humidity, and pressure. Take your projects to the next level with our ultimate collection of IoT Device Management Fundamentals IoT Device Health And Uptime Dashboard IoT SS V. Slidegeeks has designed a range of layouts that are perfect for representing task or activity duration, keeping track of all your deadlines at a glance. Tailor these designs to your exact needs and give them a truly corporate look with your own brand colors they will make your projects stand out from the rest This slide provides a dashboard that helps to track information about device health. It provides information about temperature, relative humidity, and pressure.
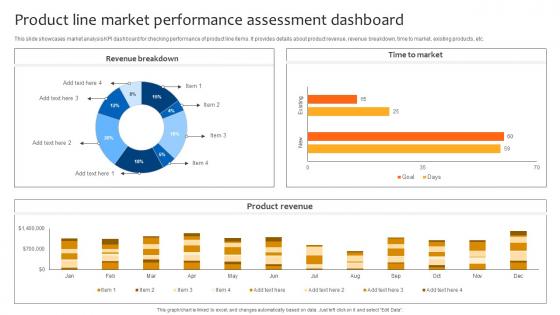
Deploying Strategies For Business Product Line Market Performance Assessment Dashboard Strategy SS V
This slide showcases market analysis KPI dashboard for checking performance of product line items. It provides details about product revenue, revenue breakdown, time to market, existing products, etc. Take your projects to the next level with our ultimate collection of Deploying Strategies For Business Product Line Market Performance Assessment Dashboard Strategy SS V. Slidegeeks has designed a range of layouts that are perfect for representing task or activity duration, keeping track of all your deadlines at a glance. Tailor these designs to your exact needs and give them a truly corporate look with your own brand colors they will make your projects stand out from the rest This slide showcases market analysis KPI dashboard for checking performance of product line items. It provides details about product revenue, revenue breakdown, time to market, existing products, etc.
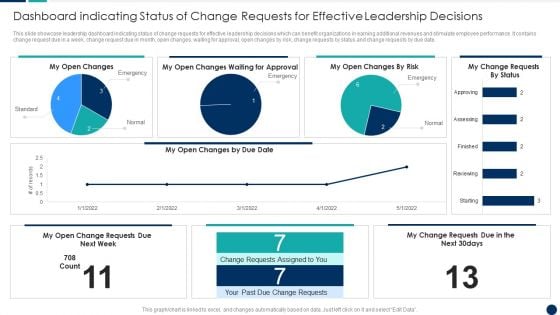
Dashboard Indicating Status Of Change Requests For Effective Leadership Decisions Themes PDF
This slide showcase leadership dashboard indicating status of change requests for effective leadership decisions which can benefit organizations in earning additional revenues and stimulate employee performance. It contains change request due in a week, change request due in month, open changes, waiting for approval, open changes by risk, change requests by status and change requests by due date.Showcasing this set of slides titled Dashboard Indicating Status Of Change Requests For Effective Leadership Decisions Themes PDF The topics addressed in these templates are Dashboard Indicating, Requests Effective, Leadership Decisions All the content presented in this PPT design is completely editable. Download it and make adjustments in color, background, font etc. as per your unique business setting.
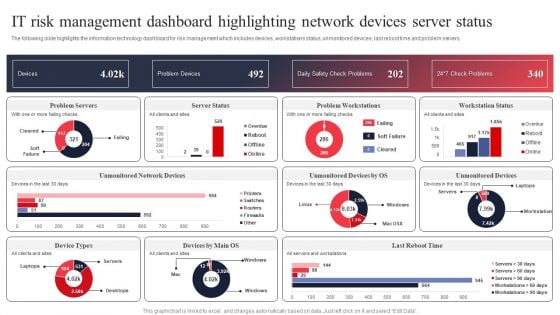
IT System Risk Management Guide IT Risk Management Dashboard Highlighting Network Devices Server Status Elements PDF
The following slide highlights the information technology dashboard for risk management which includes devices, workstations status, unmonitored devices, last reboot time and problem servers. If you are looking for a format to display your unique thoughts, then the professionally designed IT System Risk Management Guide IT Risk Management Dashboard Highlighting Network Devices Server Status Elements PDF is the one for you. You can use it as a Google Slides template or a PowerPoint template. Incorporate impressive visuals, symbols, images, and other charts. Modify or reorganize the text boxes as you desire. Experiment with shade schemes and font pairings. Alter, share or cooperate with other people on your work. Download IT System Risk Management Guide IT Risk Management Dashboard Highlighting Network Devices Server Status Elements PDF and find out how to give a successful presentation. Present a perfect display to your team and make your presentation unforgettable.
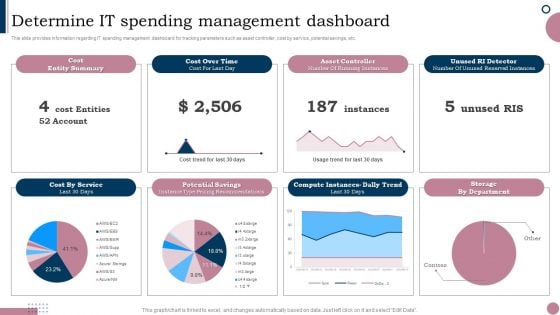
Cios Guide To Optimize Determine IT Spending Management Dashboard Portrait PDF
This slide provides information regarding IT spending management dashboard for tracking parameters such as asset controller, cost by service, potential savings, etc. If you are looking for a format to display your unique thoughts, then the professionally designed Cios Guide To Optimize Determine IT Spending Management Dashboard Portrait PDF is the one for you. You can use it as a Google Slides template or a PowerPoint template. Incorporate impressive visuals, symbols, images, and other charts. Modify or reorganize the text boxes as you desire. Experiment with shade schemes and font pairings. Alter, share or cooperate with other people on your work. Download Cios Guide To Optimize Determine IT Spending Management Dashboard Portrait PDF and find out how to give a successful presentation. Present a perfect display to your team and make your presentation unforgettable.
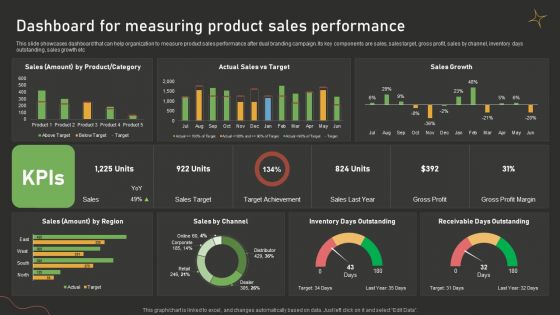
Dashboard For Measuring Product Sales Performance Dual Branding Campaign For Product Promotion Microsoft PDF
This slide showcases dashboard that can help organization to measure product sales performance after dual branding campaign. Its key components are sales, sales target, gross profit, sales by channel, inventory days outstanding, sales growth etc. Do you have an important presentation coming up Are you looking for something that will make your presentation stand out from the rest Look no further than Dashboard For Measuring Product Sales Performance Dual Branding Campaign For Product Promotion Microsoft PDF. With our professional designs, you can trust that your presentation will pop and make delivering it a smooth process. And with Slidegeeks, you can trust that your presentation will be unique and memorable. So why wait Grab Dashboard For Measuring Product Sales Performance Dual Branding Campaign For Product Promotion Microsoft PDF today and make your presentation stand out from the rest.
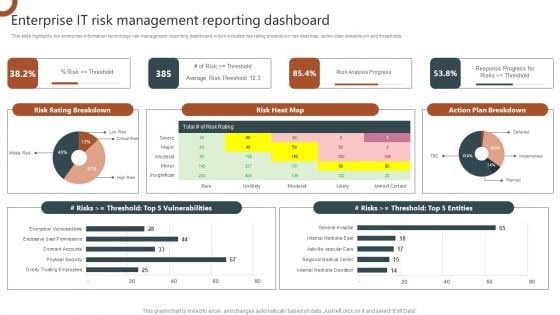
Organizations Risk Management And IT Security Enterprise IT Risk Management Reporting Dashboard Diagrams PDF
This slide highlights the enterprise information technology risk management reporting dashboard which includes risk rating breakdown risk heat map, action plan breakdown and thresholds. This Organizations Risk Management And IT Security Enterprise IT Risk Management Reporting Dashboard Diagrams PDF is perfect for any presentation, be it in front of clients or colleagues. It is a versatile and stylish solution for organizing your meetings. The Organizations Risk Management And IT Security Enterprise IT Risk Management Reporting Dashboard Diagrams PDF features a modern design for your presentation meetings. The adjustable and customizable slides provide unlimited possibilities for acing up your presentation. Slidegeeks has done all the homework before launching the product for you. So, do not wait, grab the presentation templates today.

Call Center Action Plan Dashboard Highlighting Agent Performance With Satisfaction Score Information PDF
This slide showcases dashboard for call center action plan which includes total calls, average answer speed, abandon rate, average calls per minute with agent performance and overall customer satisfaction score. If you are looking for a format to display your unique thoughts, then the professionally designed Call Center Action Plan Dashboard Highlighting Agent Performance With Satisfaction Score Information PDF is the one for you. You can use it as a Google Slides template or a PowerPoint template. Incorporate impressive visuals, symbols, images, and other charts. Modify or reorganize the text boxes as you desire. Experiment with shade schemes and font pairings. Alter, share or cooperate with other people on your work. Download Call Center Action Plan Dashboard Highlighting Agent Performance With Satisfaction Score Information PDF and find out how to give a successful presentation. Present a perfect display to your team and make your presentation unforgettable.
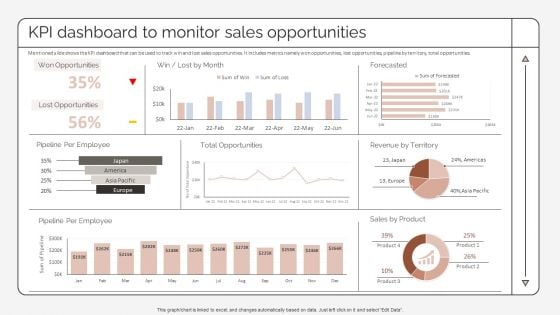
Kpi Dashboard To Monitor Sales Opportunities Strategic Promotion Plan To Improve Product Diagrams PDF
Mentioned slide shows the KPI dashboard that can be used to track win and lost sales opportunities. It includes metrics namely won opportunities, lost opportunities, pipeline by territory, total opportunities.Explore a selection of the finest Kpi Dashboard To Monitor Sales Opportunities Strategic Promotion Plan To Improve Product Diagrams PDF here. With a plethora of professionally designed and pre-made slide templates, you can quickly and easily find the right one for your upcoming presentation. You can use our Kpi Dashboard To Monitor Sales Opportunities Strategic Promotion Plan To Improve Product Diagrams PDF to effectively convey your message to a wider audience. Slidegeeks has done a lot of research before preparing these presentation templates. The content can be personalized and the slides are highly editable. Grab templates today from Slidegeeks.
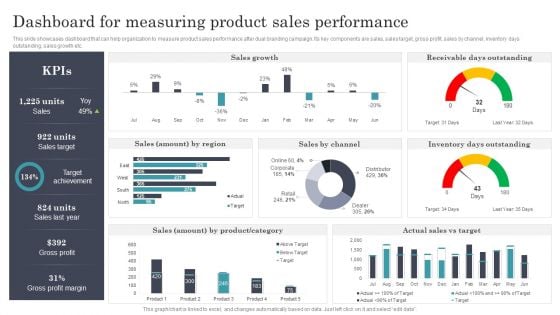
Developing Dual Branding Campaign For Brand Marketing Dashboard For Measuring Product Sales Performance Clipart PDF
This slide showcases dashboard that can help organization to measure product sales performance after dual branding campaign. Its key components are sales, sales target, gross profit, sales by channel, inventory days outstanding, sales growth etc. Create an editable Developing Dual Branding Campaign For Brand Marketing Dashboard For Measuring Product Sales Performance Clipart PDF that communicates your idea and engages your audience. Whether you are presenting a business or an educational presentation, pre designed presentation templates help save time. Developing Dual Branding Campaign For Brand Marketing Dashboard For Measuring Product Sales Performance Clipart PDF is highly customizable and very easy to edit, covering many different styles from creative to business presentations. Slidegeeks has creative team members who have crafted amazing templates. So, go and get them without any delay.
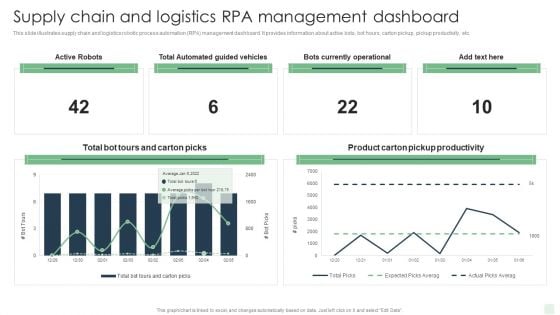
Supply Chain And Logistics Rpa Management Dashboard Automated Manufacturing Process Deployment Ideas PDF
This slide illustrates supply chain and logistics robotic process automation RPA management dashboard. It provides information about active bots, bot hours, carton pickup, pickup productivity, etc.Explore a selection of the finest Supply Chain And Logistics Rpa Management Dashboard Automated Manufacturing Process Deployment Ideas PDF here. With a plethora of professionally designed and pre-made slide templates, you can quickly and easily find the right one for your upcoming presentation. You can use our Supply Chain And Logistics Rpa Management Dashboard Automated Manufacturing Process Deployment Ideas PDF to effectively convey your message to a wider audience. Slidegeeks has done a lot of research before preparing these presentation templates. The content can be personalized and the slides are highly editable. Grab templates today from Slidegeeks.
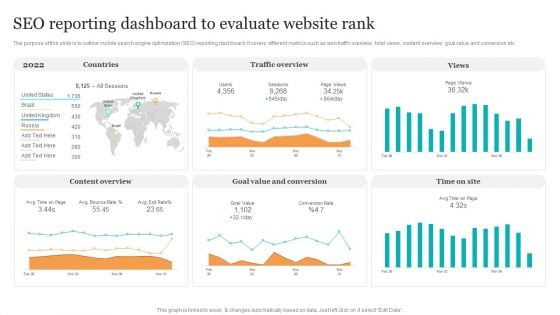
Seo Reporting Dashboard To Evaluate Website Rank Search Engine Optimization Services To Minimize Template PDF
The purpose of this slide is to outline mobile search engine optimization SEO reporting dashboard. It covers different metrics such as web traffic overview, total views, content overview, goal value and conversion etc. This Seo Reporting Dashboard To Evaluate Website Rank Search Engine Optimization Services To Minimize Template PDF is perfect for any presentation, be it in front of clients or colleagues. It is a versatile and stylish solution for organizing your meetings. The Seo Reporting Dashboard To Evaluate Website Rank Search Engine Optimization Services To Minimize Template PDF features a modern design for your presentation meetings. The adjustable and customizable slides provide unlimited possibilities for acing up your presentation. Slidegeeks has done all the homework before launching the product for you. So, do not wait, grab the presentation templates today.
Organizing Security Awareness KPI Metrics Dashboard To Effectively Track Cyber Threat Icons PDF
The purpose of this slide is to highlight performance KPI dashboard used to monitor the cyber threat management.. The metrics highlighted in the slide are risk score, compliance status, threat level, monitoring and operational status. This Organizing Security Awareness KPI Metrics Dashboard To Effectively Track Cyber Threat Icons PDF is perfect for any presentation, be it in front of clients or colleagues. It is a versatile and stylish solution for organizing your meetings. The Organizing Security Awareness KPI Metrics Dashboard To Effectively Track Cyber Threat Icons PDF features a modern design for your presentation meetings. The adjustable and customizable slides provide unlimited possibilities for acing up your presentation. Slidegeeks has done all the homework before launching the product for you. So, dont wait, grab the presentation templates today.
Dashboard For Tracking Brand Communication Campaign Results Communication Strategy Professional PDF
This slide covers the dashboard for monitoring various audience segments. It includes metrics such as ad mentions, engagement, top occupation of the audience, top interest of the audience, age, language, etc.Create an editable Dashboard For Tracking Brand Communication Campaign Results Communication Strategy Professional PDF that communicates your idea and engages your audience. Whether you are presenting a business or an educational presentation, pre-designed presentation templates help save time. Dashboard For Tracking Brand Communication Campaign Results Communication Strategy Professional PDF is highly customizable and very easy to edit, covering many different styles from creative to business presentations. Slidegeeks has creative team members who have crafted amazing templates. So, go and get them without any delay.
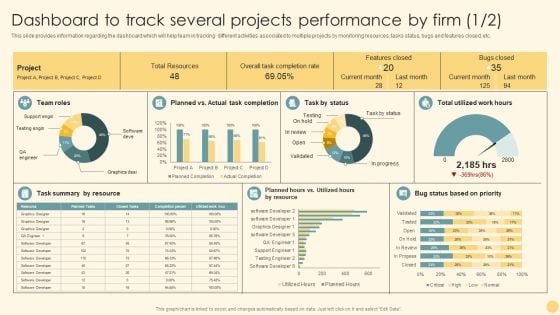
Dashboard To Track Several Projects Performance By Firm Ppt PowerPoint Presentation File Styles PDF
This slide provides information regarding the dashboard which will help team in tracking different activities associated to multiple projects by monitoring resources, tasks status, bugs and features closed, etc. Create an editable Dashboard To Track Several Projects Performance By Firm Ppt PowerPoint Presentation File Styles PDF that communicates your idea and engages your audience. Whether youre presenting a business or an educational presentation, pre designed presentation templates help save time. Dashboard To Track Several Projects Performance By Firm Ppt PowerPoint Presentation File Styles PDF is highly customizable and very easy to edit, covering many different styles from creative to business presentations. Slidegeeks has creative team members who have crafted amazing templates. So, go and get them without any delay.
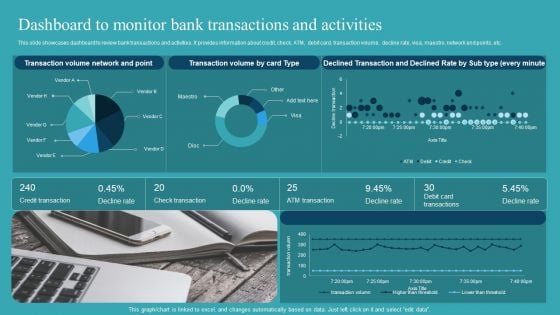
Integrating AML And Transaction Dashboard To Monitor Bank Transactions Demonstration PDF
This slide showcases dashboard to review bank transactions and activities. It provides information about credit, check, ATM, debit card, transaction volume, decline rate, visa, maestro, network end points, etc. Do you have an important presentation coming up Are you looking for something that will make your presentation stand out from the rest Look no further than Integrating AML And Transaction Dashboard To Monitor Bank Transactions Demonstration PDF. With our professional designs, you can trust that your presentation will pop and make delivering it a smooth process. And with Slidegeeks, you can trust that your presentation will be unique and memorable. So why wait Grab Integrating AML And Transaction Dashboard To Monitor Bank Transactions Demonstration PDF today and make your presentation stand out from the rest.
Process Enhancement Plan To Boost Sales Performance Social Media Performance Tracking And Monitoring Dashboard Elements PDF
The following slide showcases a dashboard to track and measure social media platforms performance. It includes key elements such as website traffic, social media referral rate, site revenue, social media site revenue, etc. Get a simple yet stunning designed Process Enhancement Plan To Boost Sales Performance Social Media Performance Tracking And Monitoring Dashboard Elements PDF. It is the best one to establish the tone in your meetings. It is an excellent way to make your presentations highly effective. So, download this PPT today from Slidegeeks and see the positive impacts. Our easy to edit Process Enhancement Plan To Boost Sales Performance Social Media Performance Tracking And Monitoring Dashboard Elements PDF can be your go-to option for all upcoming conferences and meetings. So, what are you waiting for Grab this template today.
Efficient Administration Of Product Business And Umbrella Branding Activity Tracking Dashboard For Umbrella Brand Icons PDF
This slide provides information regarding activities tracking dashboard for umbrella brand in terms of customer retention, market share, etc. If you are looking for a format to display your unique thoughts, then the professionally designed Efficient Administration Of Product Business And Umbrella Branding Activity Tracking Dashboard For Umbrella Brand Icons PDF is the one for you. You can use it as a Google Slides template or a PowerPoint template. Incorporate impressive visuals, symbols, images, and other charts. Modify or reorganize the text boxes as you desire. Experiment with shade schemes and font pairings. Alter, share or cooperate with other people on your work. Download Efficient Administration Of Product Business And Umbrella Branding Activity Tracking Dashboard For Umbrella Brand Icons PDF and find out how to give a successful presentation. Present a perfect display to your team and make your presentation unforgettable.
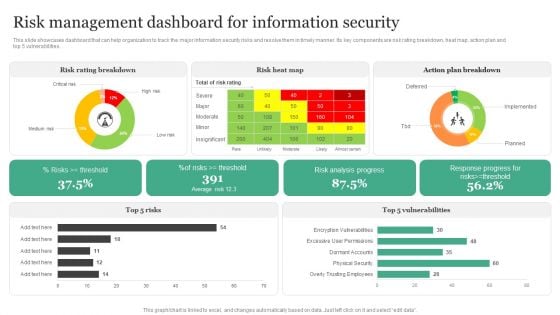
Risk Management Dashboard For Information Security Information Security Risk Administration Diagrams PDF
This slide showcases dashboard that can help organization to track the major information security risks and resolve them in timely manner. Its key components are risk rating breakdown, heat map, action plan and top 5 vulnerabilities.Create an editable Risk Management Dashboard For Information Security Information Security Risk Administration Diagrams PDF that communicates your idea and engages your audience. Whether you are presenting a business or an educational presentation, pre-designed presentation templates help save time. Risk Management Dashboard For Information Security Information Security Risk Administration Diagrams PDF is highly customizable and very easy to edit, covering many different styles from creative to business presentations. Slidegeeks has creative team members who have crafted amazing templates. So, go and get them without any delay.
Brand Awareness Strategy Dashboard For Tracking Brand Awareness Advertisement Ideas PDF
This slide showcases dashboard that can help organization to track results of online advertisement campaigns. Its key components ad impressions, click through rate, cost per conversion, revenue per click, impressions, new users and sessions. Get a simple yet stunning designed Brand Awareness Strategy Dashboard For Tracking Brand Awareness Advertisement Ideas PDF. It is the best one to establish the tone in your meetings. It is an excellent way to make your presentations highly effective. So, download this PPT today from Slidegeeks and see the positive impacts. Our easy-to-edit Brand Awareness Strategy Dashboard For Tracking Brand Awareness Advertisement Ideas PDF can be your go-to option for all upcoming conferences and meetings. So, what are you waiting for Grab this template today.
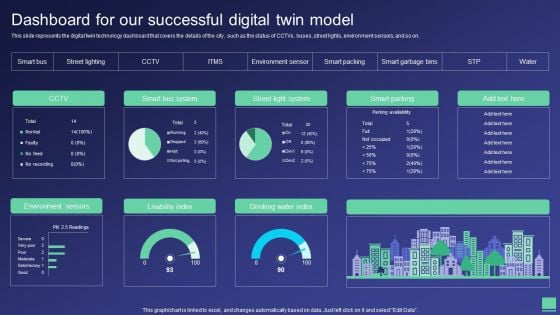
Digital Twin Tech IT Dashboard For Our Successful Digital Twin Model Microsoft PDF
This slide represents the digital twin technology dashboard that covers the details of the city, such as the status of CCTVs, buses, street lights, environment sensors, and so on. Do you have an important presentation coming up Are you looking for something that will make your presentation stand out from the rest Look no further than Digital Twin Tech IT Dashboard For Our Successful Digital Twin Model Microsoft PDF. With our professional designs, you can trust that your presentation will pop and make delivering it a smooth process. And with Slidegeeks, you can trust that your presentation will be unique and memorable. So why wait Grab Digital Twin Tech IT Dashboard For Our Successful Digital Twin Model Microsoft PDF today and make your presentation stand out from the rest.
Food Processing Industry Latest Insights Trends And Analytics Performance Monitoring Dashboard For Consumer Goods Icons PDF
This slide showcase the performance monitoring dashboard for consumer goods providing information regarding the overview of food and beverages sales, top selling products and on shelf availability. Get a simple yet stunning designed Food Processing Industry Latest Insights Trends And Analytics Performance Monitoring Dashboard For Consumer Goods Icons PDF. It is the best one to establish the tone in your meetings. It is an excellent way to make your presentations highly effective. So, download this PPT today from Slidegeeks and see the positive impacts. Our easy to edit Food Processing Industry Latest Insights Trends And Analytics Performance Monitoring Dashboard For Consumer Goods Icons PDF can be your go to option for all upcoming conferences and meetings. So, what are you waiting for Grab this template today.
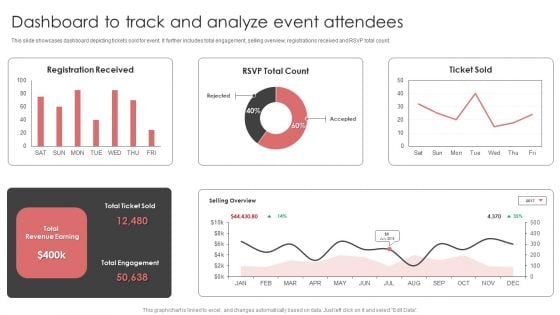
New Product Launch Event Management Activities Dashboard To Track And Analyze Event Attendees Rules PDF
This slide showcases dashboard depicting tickets sold for event. It further includes total engagement, selling overview, registrations received and RSVP total count.Get a simple yet stunning designed New Product Launch Event Management Activities Dashboard To Track And Analyze Event Attendees Rules PDF. It is the best one to establish the tone in your meetings. It is an excellent way to make your presentations highly effective. So, download this PPT today from Slidegeeks and see the positive impacts. Our easy-to-edit New Product Launch Event Management Activities Dashboard To Track And Analyze Event Attendees Rules PDF can be your go-to option for all upcoming conferences and meetings. So, what are you waiting for Grab this template today.


 Continue with Email

 Home
Home


