Dashboards Construction
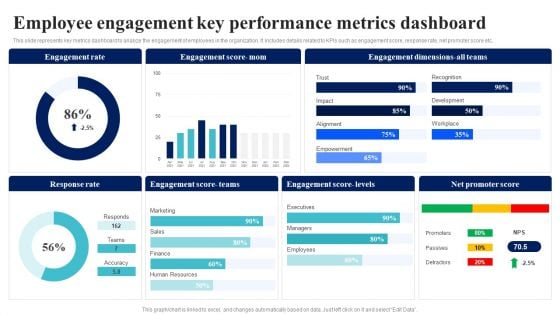
BI Implementation To Enhance Hiring Process Employee Engagement Key Performance Metrics Dashboard Ideas PDF
This slide represents key metrics dashboard to analyze the engagement of employees in the organization. It includes details related to KPIs such as engagement score, response rate, net promoter score etc.Formulating a presentation can take up a lot of effort and time, so the content and message should always be the primary focus. The visuals of the PowerPoint can enhance the presenters message, so our BI Implementation To Enhance Hiring Process Employee Engagement Key Performance Metrics Dashboard Ideas PDF was created to help save time. Instead of worrying about the design, the presenter can concentrate on the message while our designers work on creating the ideal templates for whatever situation is needed. Slidegeeks has experts for everything from amazing designs to valuable content, we have put everything into BI Implementation To Enhance Hiring Process Employee Engagement Key Performance Metrics Dashboard Ideas PDF.
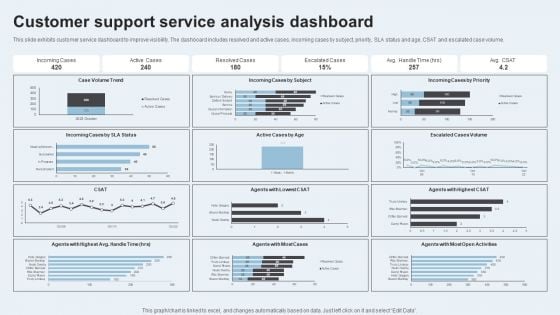
Action Plan To Enhance Client Service Customer Support Service Analysis Dashboard Graphics PDF
This slide exhibits customer service dashboard to improve visibility. The dashboard includes resolved and active cases, incoming cases by subject, priority, SLA status and age, CSAT and escalated case volume. The Action Plan To Enhance Client Service Customer Support Service Analysis Dashboard Graphics PDF is a compilation of the most recent design trends as a series of slides. It is suitable for any subject or industry presentation, containing attractive visuals and photo spots for businesses to clearly express their messages. This template contains a variety of slides for the user to input data, such as structures to contrast two elements, bullet points, and slides for written information. Slidegeeks is prepared to create an impression.
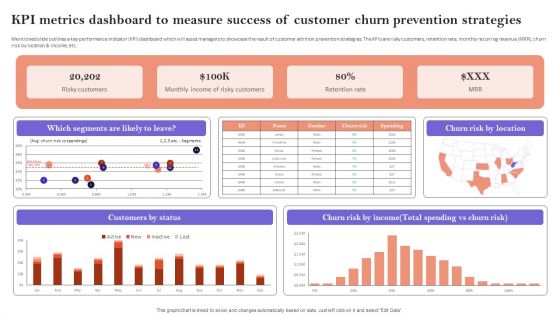
KPI Metrics Dashboard To Measure Success Of Customer Churn Prevention Strategies Diagrams PDF
Mentioned slide outlines a key performance indicator KPI dashboard which will assist managers to showcase the result of customer attrition prevention strategies. The KPIs are risky customers, retention rate, monthly recurring revenue MRR, churn risk by location and income, etc. This KPI Metrics Dashboard To Measure Success Of Customer Churn Prevention Strategies Diagrams PDF is perfect for any presentation, be it in front of clients or colleagues. It is a versatile and stylish solution for organizing your meetings. The KPI Metrics Dashboard To Measure Success Of Customer Churn Prevention Strategies Diagrams PDF features a modern design for your presentation meetings. The adjustable and customizable slides provide unlimited possibilities for acing up your presentation. Slidegeeks has done all the homework before launching the product for you. So, do not wait, grab the presentation templates today
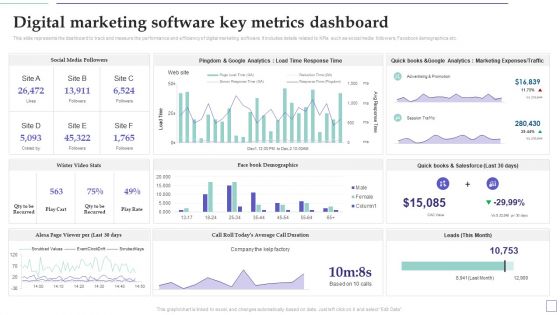
System Deployment Project Digital Marketing Software Key Metrics Dashboard Graphics PDF
This slide represents the dashboard to track and measure the performance and efficiency of digital marketing software. It includes details related to KPIs such as social media followers, Facebook demographics etc. If you are looking for a format to display your unique thoughts, then the professionally designed System Deployment Project Digital Marketing Software Key Metrics Dashboard Graphics PDF is the one for you. You can use it as a Google Slides template or a PowerPoint template. Incorporate impressive visuals, symbols, images, and other charts. Modify or reorganize the text boxes as you desire. Experiment with shade schemes and font pairings. Alter, share or cooperate with other people on your work. Download System Deployment Project Digital Marketing Software Key Metrics Dashboard Graphics PDF and find out how to give a successful presentation. Present a perfect display to your team and make your presentation unforgettable.
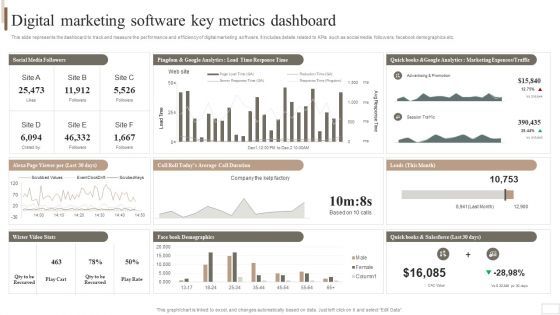
Strategic Plan For Enterprise Digital Marketing Software Key Metrics Dashboard Brochure PDF
This slide represents the dashboard to track and measure the performance and efficiency of digital marketing software. It includes details related to KPIs such as social media followers, facebook demographics etc. Do you have an important presentation coming up Are you looking for something that will make your presentation stand out from the rest Look no further than Strategic Plan For Enterprise Digital Marketing Software Key Metrics Dashboard Brochure PDF. With our professional designs, you can trust that your presentation will pop and make delivering it a smooth process. And with Slidegeeks, you can trust that your presentation will be unique and memorable. So why wait Grab Strategic Plan For Enterprise Digital Marketing Software Key Metrics Dashboard Brochure PDF today and make your presentation stand out from the rest.
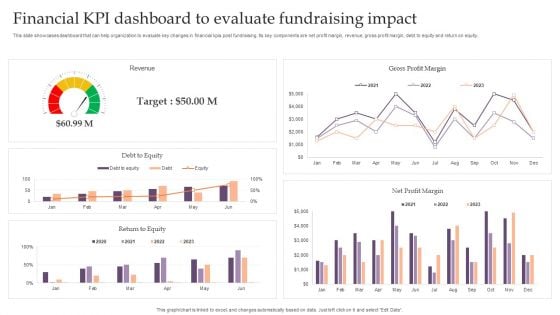
Assessing Debt And Equity Fundraising Alternatives For Business Growth Financial KPI Dashboard To Evaluate Infographics PDF
This slide showcases dashboard that can help organization to evaluate key changes in financial kpis post fundraising. Its key components are net profit margin, revenue, gross profit margin, debt to equity and return on equity. This Assessing Debt And Equity Fundraising Alternatives For Business Growth Financial KPI Dashboard To Evaluate Infographics PDF is perfect for any presentation, be it in front of clients or colleagues. It is a versatile and stylish solution for organizing your meetings. TheAssessing Debt And Equity Fundraising Alternatives For Business Growth Financial KPI Dashboard To Evaluate Infographics PDF features a modern design for your presentation meetings. The adjustable and customizable slides provide unlimited possibilities for acing up your presentation. Slidegeeks has done all the homework before launching the product for you. So, do not wait, grab the presentation templates today
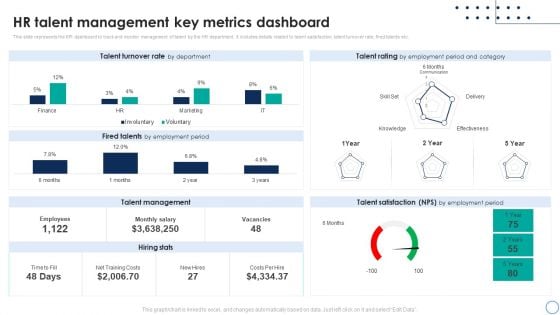
Business Analytics Application HR Talent Management Key Metrics Dashboard Rules PDF
This slide represents the KPI dashboard to track and monitor management of talent by the HR department. It includes details related to talent satisfaction, talent turnover rate, fired talents etc. This Business Analytics Application HR Talent Management Key Metrics Dashboard Rules PDF is perfect for any presentation, be it in front of clients or colleagues. It is a versatile and stylish solution for organizing your meetings. The Business Analytics Application HR Talent Management Key Metrics Dashboard Rules PDF features a modern design for your presentation meetings. The adjustable and customizable slides provide unlimited possibilities for acing up your presentation. Slidegeeks has done all the homework before launching the product for you. So, dont wait, grab the presentation templates today.
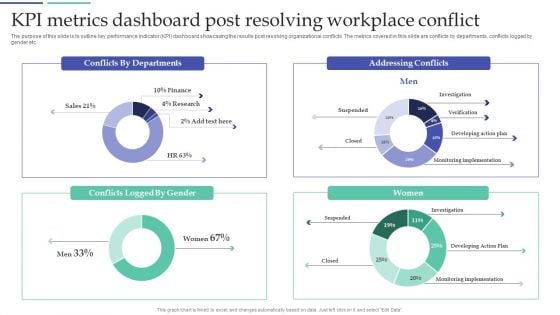
Resolving Team Disputes In Organization KPI Metrics Dashboard Post Resolving Workplace Conflict Pictures PDF
The purpose of this slide is to outline key performance indicator KPI dashboard showcasing the results post resolving organizational conflicts. The metrics covered in this slide are conflicts by departments, conflicts logged by gender etc. Get a simple yet stunning designed Resolving Team Disputes In Organization KPI Metrics Dashboard Post Resolving Workplace Conflict Pictures PDF. It is the best one to establish the tone in your meetings. It is an excellent way to make your presentations highly effective. So, download this PPT today from Slidegeeks and see the positive impacts. Our easy to edit Resolving Team Disputes In Organization KPI Metrics Dashboard Post Resolving Workplace Conflict Pictures PDF can be your go-to option for all upcoming conferences and meetings. So, what are you waiting for Grab this template today.
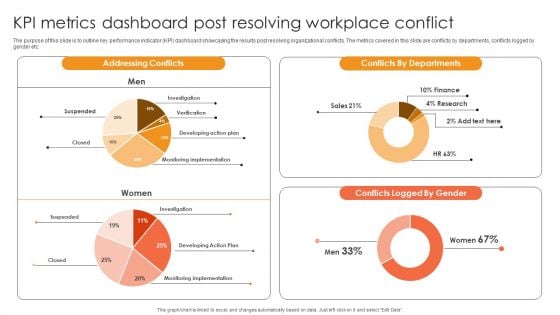
Kpi Metrics Dashboard Post Resolving Workplace Conflict Ppt Inspiration Graphics Download PDF
The purpose of this slide is to outline key performance indicator KPI dashboard showcasing the results post resolving organizational conflicts. The metrics covered in this slide are conflicts by departments, conflicts logged by gender etc. This Kpi Metrics Dashboard Post Resolving Workplace Conflict Ppt Inspiration Graphics Download PDF is perfect for any presentation, be it in front of clients or colleagues. It is a versatile and stylish solution for organizing your meetings. The Kpi Metrics Dashboard Post Resolving Workplace Conflict Ppt Inspiration Graphics Download PDF features a modern design for your presentation meetings. The adjustable and customizable slides provide unlimited possibilities for acing up your presentation. Slidegeeks has done all the homework before launching the product for you. So, do not wait, grab the presentation templates today
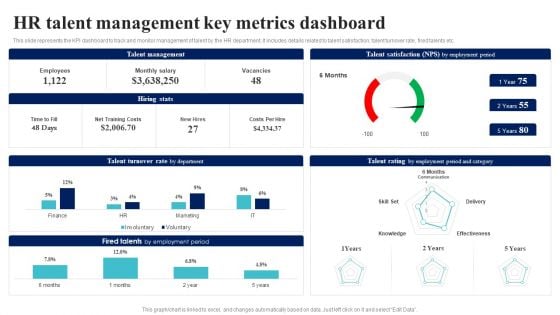
BI Implementation To Enhance Hiring Process Hr Talent Management Key Metrics Dashboard Brochure PDF
This slide represents the KPI dashboard to track and monitor management of talent by the HR department. It includes details related to talent satisfaction, talent turnover rate, fired talents etc.This BI Implementation To Enhance Hiring Process Hr Talent Management Key Metrics Dashboard Brochure PDF is perfect for any presentation, be it in front of clients or colleagues. It is a versatile and stylish solution for organizing your meetings. The BI Implementation To Enhance Hiring Process Hr Talent Management Key Metrics Dashboard Brochure PDF features a modern design for your presentation meetings. The adjustable and customizable slides provide unlimited possibilities for acing up your presentation. Slidegeeks has done all the homework before launching the product for you. So, do not wait, grab the presentation templates today.
Human Augmented Machine Learning IT Augmented Intelligence Information Tracking Dashboard Diagrams PDF
This slide depicts the information tracking dashboard by augmented intelligence model covering the data analysis. Data analysis includes image analysis, storage size, new users on the cloud platform, etc. Get a simple yet stunning designed Human Augmented Machine Learning IT Augmented Intelligence Information Tracking Dashboard Diagrams PDF. It is the best one to establish the tone in your meetings. It is an excellent way to make your presentations highly effective. So, download this PPT today from Slidegeeks and see the positive impacts. Our easy-to-edit Human Augmented Machine Learning IT Augmented Intelligence Information Tracking Dashboard Diagrams PDF can be your go-to option for all upcoming conferences and meetings. So, what are you waiting for. Grab this template today.
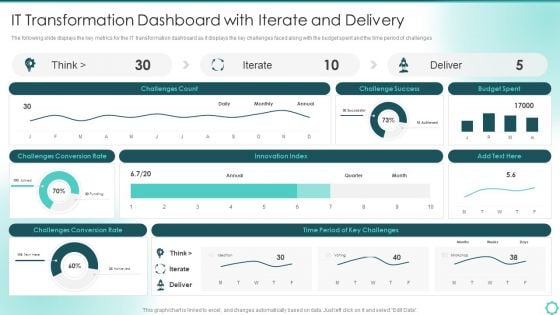
Digitalization Of Transportation Enterprise IT Transformation Dashboard With Iterate And Delivery Designs PDF
The following slide displays the key metrics for the IT transformation dashboard as it displays the key challenges faced along with the budget spent and the time period of challenges. Deliver and pitch your topic in the best possible manner with this Digitalization Of Transportation Enterprise IT Transformation Dashboard With Iterate And Delivery Designs PDF. Use them to share invaluable insights on Innovation Index, Budget Spent, Conversion Rate and impress your audience. This template can be altered and modified as per your expectations. So, grab it now.
Artificial Intelligence Transformation Playbook Kpi Dashboard For Tracking Business Performance Designs PDF
Mentioned slide portrays KPI dashboard that can be used by organizations to measure their business performance post AI introduction. KPIS covered here are progress, Before versus After AI Implementation, risks and issues. Deliver an awe inspiring pitch with this creative artificial intelligence transformation playbook kpi dashboard for tracking business performance designs pdf bundle. Topics like risk and issues, progress, performance kpis, before versus after all implementation can be discussed with this completely editable template. It is available for immediate download depending on the needs and requirements of the user.
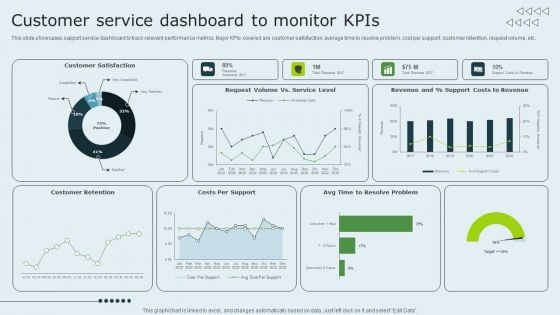
Enhancing Client Experience Customer Service Dashboard To Monitor Kpis Summary PDF
This slide showcases support service dashboard to track relevant performance metrics. Major KPIs covered are customer satisfaction, average time to resolve problem, cost per support, customer retention, request volume, etc. Formulating a presentation can take up a lot of effort and time, so the content and message should always be the primary focus. The visuals of the PowerPoint can enhance the presentes message, so our Enhancing Client Experience Customer Service Dashboard To Monitor Kpis Summary PDF was created to help save time. Instead of worrying about the design, the presenter can concentrate on the message while our designers work on creating the ideal templates for whatever situation is needed. Slidegeeks has experts for everything from amazing designs to valuable content, we have put everything into Enhancing Client Experience Customer Service Dashboard To Monitor Kpis Summary PDF.
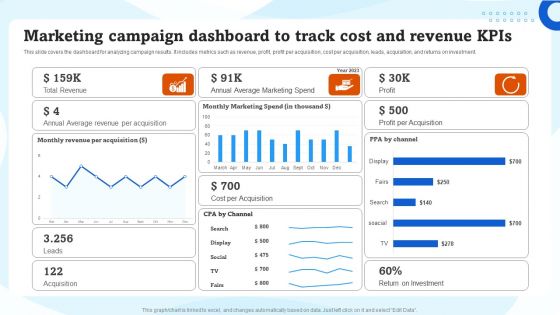
Marketing Campaign Dashboard To Track Cost And Revenue Kpis Ppt Infographics Good PDF
This slide covers the dashboard for analyzing campaign results. It includes metrics such as revenue, profit, profit per acquisition, cost per acquisition, leads, acquisition, and returns on investment. Formulating a presentation can take up a lot of effort and time, so the content and message should always be the primary focus. The visuals of the PowerPoint can enhance the presenters message, so our Marketing Campaign Dashboard To Track Cost And Revenue Kpis Ppt Infographics Good PDF was created to help save time. Instead of worrying about the design, the presenter can concentrate on the message while our designers work on creating the ideal templates for whatever situation is needed. Slidegeeks has experts for everything from amazing designs to valuable content, we have put everything into Marketing Campaign Dashboard To Track Cost And Revenue Kpis Ppt Infographics Good PDF.
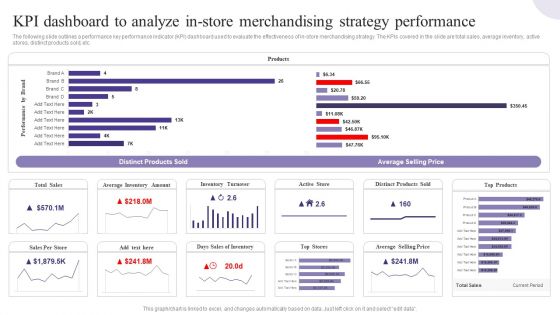
KPI Dashboard To Analyze In Store Merchandising Strategy Performance Introduction PDF
The following slide outlines a performance key performance indicator KPI dashboard used to evaluate the effectiveness of in-store merchandising strategy. The KPIs covered in the slide are total sales, average inventory, active stores, distinct products sold, etc. Formulating a presentation can take up a lot of effort and time, so the content and message should always be the primary focus. The visuals of the PowerPoint can enhance the presenters message, so our KPI Dashboard To Analyze In Store Merchandising Strategy Performance Introduction PDF was created to help save time. Instead of worrying about the design, the presenter can concentrate on the message while our designers work on creating the ideal templates for whatever situation is needed. Slidegeeks has experts for everything from amazing designs to valuable content, we have put everything into KPI Dashboard To Analyze In Store Merchandising Strategy Performance Introduction PDF.
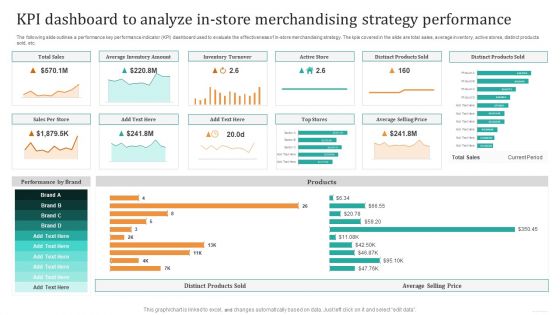
KPI Dashboard To Analyze In Store Merchandising Strategy Performance Pictures PDF
The following slide outlines a performance key performance indicator KPI dashboard used to evaluate the effectiveness of in-store merchandising strategy. The KPIs covered in the slide are total sales, average inventory, active stores, distinct products sold, etc. Formulating a presentation can take up a lot of effort and time, so the content and message should always be the primary focus. The visuals of the PowerPoint can enhance the presenters message, so our KPI Dashboard To Analyze In Store Merchandising Strategy Performance Pictures PDF was created to help save time. Instead of worrying about the design, the presenter can concentrate on the message while our designers work on creating the ideal templates for whatever situation is needed. Slidegeeks has experts for everything from amazing designs to valuable content, we have put everything into KPI Dashboard To Analyze In Store Merchandising Strategy Performance Pictures PDF.
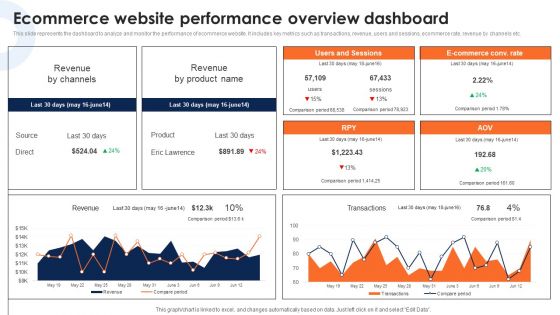
Ecommerce Website Performance Overview Dashboard Deploying Ecommerce Order Management Infographics PDF
This slide represents the dashboard to analyze and monitor the performance of ecommerce website. It includes key metrics such as transactions, revenue, users and sessions, ecommerce rate, revenue by channels etc.If you are looking for a format to display your unique thoughts, then the professionally designed Ecommerce Website Performance Overview Dashboard Deploying Ecommerce Order Management Infographics PDF is the one for you. You can use it as a Google Slides template or a PowerPoint template. Incorporate impressive visuals, symbols, images, and other charts. Modify or reorganize the text boxes as you desire. Experiment with shade schemes and font pairings. Alter, share or cooperate with other people on your work. Download Ecommerce Website Performance Overview Dashboard Deploying Ecommerce Order Management Infographics PDF and find out how to give a successful presentation. Present a perfect display to your team and make your presentation unforgettable.
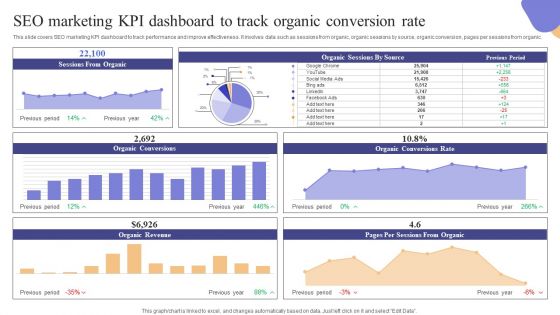
SEO Marketing KPI Dashboard To Track Organic Conversion Rate Microsoft PDF
This slide covers SEO marketing KPI dashboard to track performance and improve effectiveness. It involves data such as sessions from organic, organic sessions by source, organic conversion, pages per sessions from organic. Formulating a presentation can take up a lot of effort and time, so the content and message should always be the primary focus. The visuals of the PowerPoint can enhance the presenters message, so our SEO Marketing KPI Dashboard To Track Organic Conversion Rate Microsoft PDF was created to help save time. Instead of worrying about the design, the presenter can concentrate on the message while our designers work on creating the ideal templates for whatever situation is needed. Slidegeeks has experts for everything from amazing designs to valuable content, we have put everything into SEO Marketing KPI Dashboard To Track Organic Conversion Rate Microsoft PDF
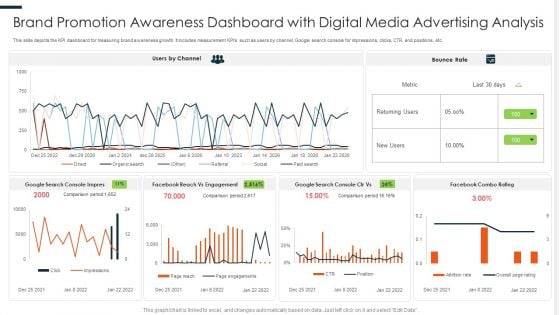
Brand Promotion Awareness Dashboard With Digital Media Advertising Analysis Ppt PowerPoint Presentation Design Ideas PDF
This slide depicts the KPI dashboard for measuring brand awareness growth. It includes measurement KPIs such as users by channel, Google search console for impressions, clicks, CTR, and positions, etc. Pitch your topic with ease and precision using this Brand Promotion Awareness Dashboard With Digital Media Advertising Analysis Ppt PowerPoint Presentation Design Ideas PDF. This layout presents information on Console Impress, Reach Engagement, Combo Rating. It is also available for immediate download and adjustment. So, changes can be made in the color, design, graphics or any other component to create a unique layout.

Patient Health And Risk Key Performance Indicator Dashboard Ppt Infographic Template Summary PDF
The following slide highlights the patient health and safety key performance indicator dashboard illustrating admission by department, admission by cost, patient satisfaction, total patients, operations cost, patient density, total staff, waiting time, treatment satisfaction and treatment confidence. Pitch your topic with ease and precision using this Patient Health And Risk Key Performance Indicator Dashboard Ppt Infographic Template Summary PDF. This layout presents information on Admission By Department, Admission Vs Cost, Patient Satisfaction. It is also available for immediate download and adjustment. So, changes can be made in the color, design, graphics or any other component to create a unique layout.
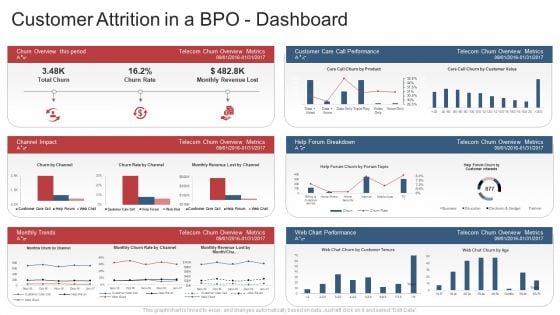
Customer Attrition In A Bpo Dashboard Rate Ppt Slides Designs Download PDF
This slide shows a Customer Attrition Rate Dashboard with KPIs such as Company Revenue , Customer Attrition Rate in 2021 , Annual Growth Rate , Average Customer Queue Time , Onboarding Process Effectiveness etc. Deliver an awe-inspiring pitch with this creative customer attrition in a bpo dashboard rate ppt slides designs download pdf. bundle. Topics like company revenue, customer attrition rate, annual growth rate, customer satisfaction, rate, operational efficiency can be discussed with this completely editable template. It is available for immediate download depending on the needs and requirements of the user.
Why Is Agile Cost Effective IT Agile Dashboard For Tracking Sprint Progress Designs PDF
Mentioned slide displays agile dashboard that can be used by organization to track sprint progress. KPIs covered here are overall sprint progress, statistics by priority and statistics by status. Deliver an awe inspiring pitch with this creative Why Is Agile Cost Effective IT Agile Dashboard For Tracking Sprint Progress Designs PDF bundle. Topics like Assignee, Statistics By Priority, Progress, Contract Review can be discussed with this completely editable template. It is available for immediate download depending on the needs and requirements of the user.
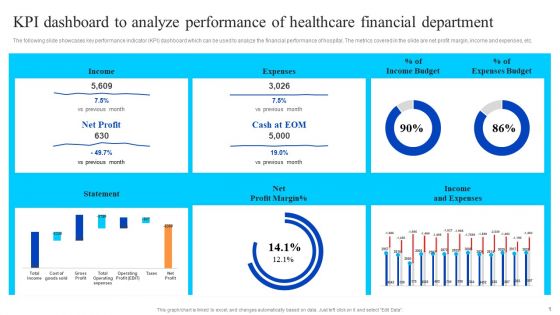
KPI Dashboard To Analyze Performance Of Healthcare Financial Department Summary PDF
The following slide showcases key performance indicator KPI dashboard which can be used to analyze the financial performance of hospital. The metrics covered in the slide are net profit margin, income and expenses, etc. Do you have an important presentation coming up Are you looking for something that will make your presentation stand out from the rest Look no further than KPI Dashboard To Analyze Performance Of Healthcare Financial Department Summary PDF. With our professional designs, you can trust that your presentation will pop and make delivering it a smooth process. And with Slidegeeks, you can trust that your presentation will be unique and memorable. So why wait Grab KPI Dashboard To Analyze Performance Of Healthcare Financial Department Summary PDF today and make your presentation stand out from the rest.

Prevention Of Information KPI Dashboard To Monitor Cyber Security Performance Information PDF
The purpose of this slide is to highlight key performance indicator KPI dashboard which can be used to track the performance of organization cyber security. The KPI metrics covered in the slide are asset type control, control issues by standard AND regulation etc. This Prevention Of Information KPI Dashboard To Monitor Cyber Security Performance Information PDF is perfect for any presentation, be it in front of clients or colleagues. It is a versatile and stylish solution for organizing your meetings. The Prevention Of Information KPI Dashboard To Monitor Cyber Security Performance Information PDF features a modern design for your presentation meetings. The adjustable and customizable slides provide unlimited possibilities for acing up your presentation. Slidegeeks has done all the homework before launching the product for you. So, dont wait, grab the presentation templates today
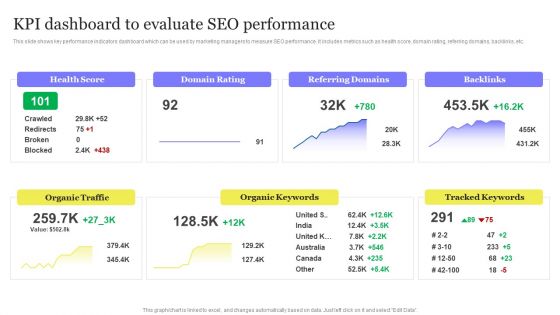
Enhancing Digital Visibility Using SEO Content Strategy KPI Dashboard To Evaluate SEO Performance Diagrams PDF
This slide shows key performance indicators dashboard which can be used by marketing managers to measure SEO performance. It includes metrics such as health score, domain rating, referring domains, backlinks, etc. This Enhancing Digital Visibility Using SEO Content Strategy KPI Dashboard To Evaluate SEO Performance Diagrams PDF is perfect for any presentation, be it in front of clients or colleagues. It is a versatile and stylish solution for organizing your meetings. The Enhancing Digital Visibility Using SEO Content Strategy KPI Dashboard To Evaluate SEO Performance Diagrams PDF features a modern design for your presentation meetings. The adjustable and customizable slides provide unlimited possibilities for acing up your presentation. Slidegeeks has done all the homework before launching the product for you. So, do not wait, grab the presentation templates today
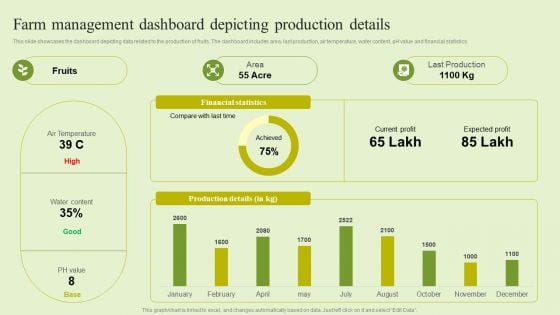
Agriculture Marketing Strategy To Improve Revenue Performance Farm Management Dashboard Depicting Production Themes PDF
This slide showcases the dashboard depicting data related to the production of fruits. The dashboard includes area, last production, air temperature, water content, pH value and financial statistics. Coming up with a presentation necessitates that the majority of the effort goes into the content and the message you intend to convey. The visuals of a PowerPoint presentation can only be effective if it supplements and supports the story that is being told. Keeping this in mind our experts created Agriculture Marketing Strategy To Improve Revenue Performance Farm Management Dashboard Depicting Production Themes PDF to reduce the time that goes into designing the presentation. This way, you can concentrate on the message while our designers take care of providing you with the right template for the situation.
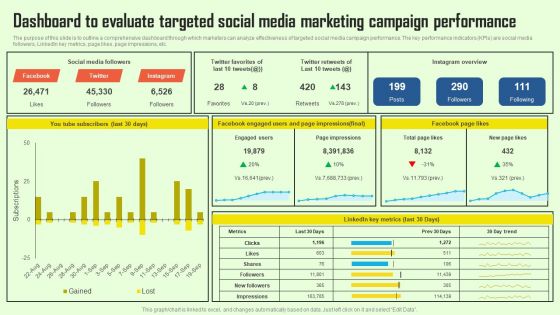
Increasing Consumer Engagement With Database Dashboard To Evaluate Targeted Social Media Portrait PDF
The purpose of this slide is to outline a comprehensive dashboard through which marketers can analyze effectiveness of targeted social media campaign performance. The key performance indicators KPIs are social media followers, LinkedIn key metrics, page likes, page impressions, etc. If you are looking for a format to display your unique thoughts, then the professionally designed Increasing Consumer Engagement With Database Dashboard To Evaluate Targeted Social Media Portrait PDF is the one for you. You can use it as a Google Slides template or a PowerPoint template. Incorporate impressive visuals, symbols, images, and other charts. Modify or reorganize the text boxes as you desire. Experiment with shade schemes and font pairings. Alter, share or cooperate with other people on your work. Download Increasing Consumer Engagement With Database Dashboard To Evaluate Targeted Social Media Portrait PDF and find out how to give a successful presentation. Present a perfect display to your team and make your presentation unforgettable.
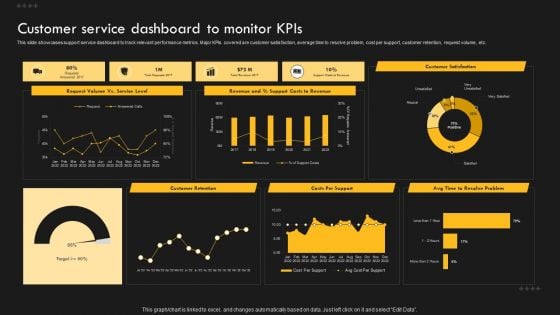
Service Improvement Techniques For Client Retention Customer Service Dashboard To Monitor Kpis Clipart PDF
This slide showcases support service dashboard to track relevant performance metrics. Major KPIs covered are customer satisfaction, average time to resolve problem, cost per support, customer retention, request volume, etc. Do you have an important presentation coming up. Are you looking for something that will make your presentation stand out from the rest. Look no further than Service Improvement Techniques For Client Retention Customer Service Dashboard To Monitor Kpis Clipart PDF. With our professional designs, you can trust that your presentation will pop and make delivering it a smooth process. And with Slidegeeks, you can trust that your presentation will be unique and memorable. So why wait. Grab Service Improvement Techniques For Client Retention Customer Service Dashboard To Monitor Kpis Clipart PDF today and make your presentation stand out from the rest.
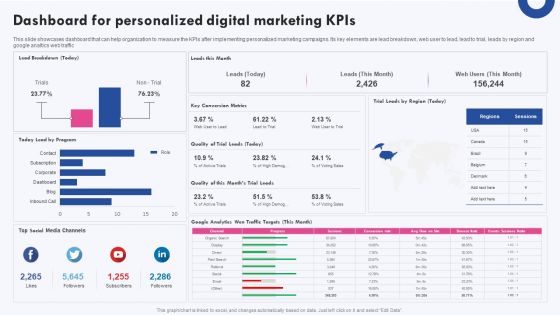
Targeted Marketing Campaigns To Improve Buyers Experience Dashboard For Personalized Digital Marketing Kpis Diagrams PDF
This slide showcases dashboard that can help organization to measure the KPIs after implementing personalized marketing campaigns. Its key elements are lead breakdown, web user to lead, lead to trial, leads by region and google analtics web traffic If you are looking for a format to display your unique thoughts, then the professionally designed Targeted Marketing Campaigns To Improve Buyers Experience Dashboard For Personalized Digital Marketing Kpis Diagrams PDF is the one for you. You can use it as a Google Slides template or a PowerPoint template. Incorporate impressive visuals, symbols, images, and other charts. Modify or reorganize the text boxes as you desire. Experiment with shade schemes and font pairings. Alter, share or cooperate with other people on your work. Download Targeted Marketing Campaigns To Improve Buyers Experience Dashboard For Personalized Digital Marketing Kpis Diagrams PDF and find out how to give a successful presentation. Present a perfect display to your team and make your presentation unforgettable.
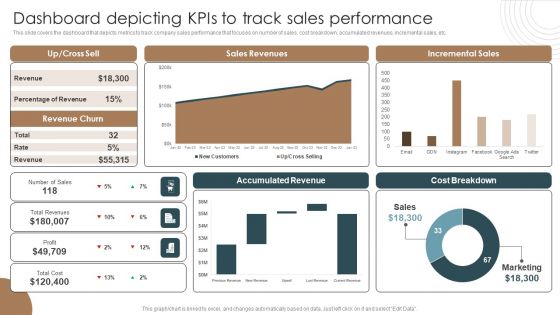
Dashboard Depicting Kpis To Track Sales Performance Integrating Technology To Transform Change Portrait PDF
This slide covers the dashboard that depicts metrics to track company sales performance that focuses on number of sales, cost breakdown, accumulated revenues, incremental sales, etc.If you are looking for a format to display your unique thoughts, then the professionally designed Dashboard Depicting Kpis To Track Sales Performance Integrating Technology To Transform Change Portrait PDF is the one for you. You can use it as a Google Slides template or a PowerPoint template. Incorporate impressive visuals, symbols, images, and other charts. Modify or reorganize the text boxes as you desire. Experiment with shade schemes and font pairings. Alter, share or cooperate with other people on your work. Download Dashboard Depicting Kpis To Track Sales Performance Integrating Technology To Transform Change Portrait PDF and find out how to give a successful presentation. Present a perfect display to your team and make your presentation unforgettable.
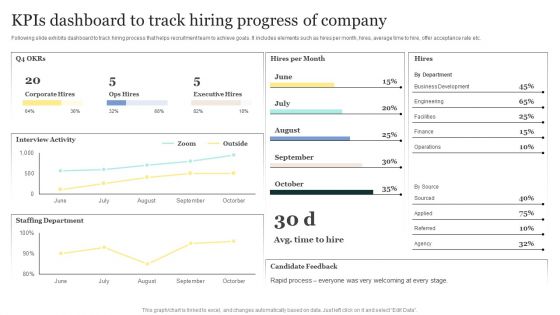
Strategic Approaches To Efficient Candidate Selection Kpis Dashboard To Track Hiring Progress Of Company Pictures PDF
Following slide exhibits dashboard to track hiring process that helps recruitment team to achieve goals. It includes elements such as hires per month, hires, average time to hire, offer acceptance rate etc. Explore a selection of the finest Strategic Approaches To Efficient Candidate Selection Kpis Dashboard To Track Hiring Progress Of Company Pictures PDF here. With a plethora of professionally designed and pre-made slide templates, you can quickly and easily find the right one for your upcoming presentation. You can use our Strategic Approaches To Efficient Candidate Selection Kpis Dashboard To Track Hiring Progress Of Company Pictures PDF to effectively convey your message to a wider audience. Slidegeeks has done a lot of research before preparing these presentation templates. The content can be personalized and the slides are highly editable. Grab templates today from Slidegeeks.
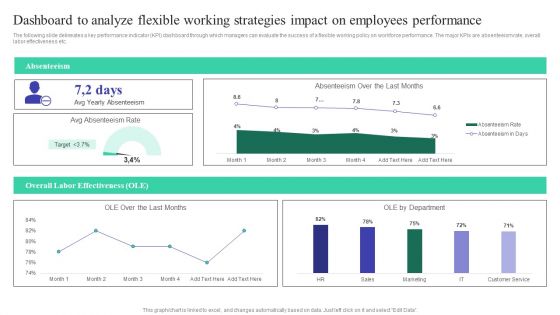
Dashboard To Analyze Flexible Working Strategies Impact On Employees Performance Professional PDF
The following slide delineates a key performance indicator KPI dashboard through which managers can evaluate the success of a flexible working policy on workforce performance. The major KPIs are absenteeism rate, overall labor effectiveness etc. If you are looking for a format to display your unique thoughts, then the professionally designed Dashboard To Analyze Flexible Working Strategies Impact On Employees Performance Professional PDF is the one for you. You can use it as a Google Slides template or a PowerPoint template. Incorporate impressive visuals, symbols, images, and other charts. Modify or reorganize the text boxes as you desire. Experiment with shade schemes and font pairings. Alter, share or cooperate with other people on your work. Download Dashboard To Analyze Flexible Working Strategies Impact On Employees Performance Professional PDF and find out how to give a successful presentation. Present a perfect display to your team and make your presentation unforgettable.
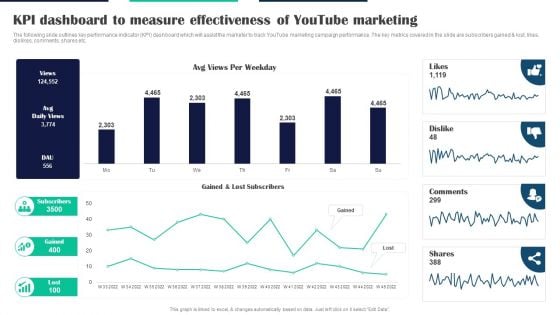
Executing Video Promotional KPI Dashboard To Measure Effectiveness Of Youtube Marketing Professional PDF
The following slide outlines key performance indicator KPI dashboard which will assist the marketer to track YouTube marketing campaign performance. The key metrics covered in the slide are subscribers gained and lost, likes, dislikes, comments, shares etc. Formulating a presentation can take up a lot of effort and time, so the content and message should always be the primary focus. The visuals of the PowerPoint can enhance the presenters message, so our Executing Video Promotional KPI Dashboard To Measure Effectiveness Of Youtube Marketing Professional PDF was created to help save time. Instead of worrying about the design, the presenter can concentrate on the message while our designers work on creating the ideal templates for whatever situation is needed. Slidegeeks has experts for everything from amazing designs to valuable content, we have put everything into Executing Video Promotional KPI Dashboard To Measure Effectiveness Of Youtube Marketing Professional PDF
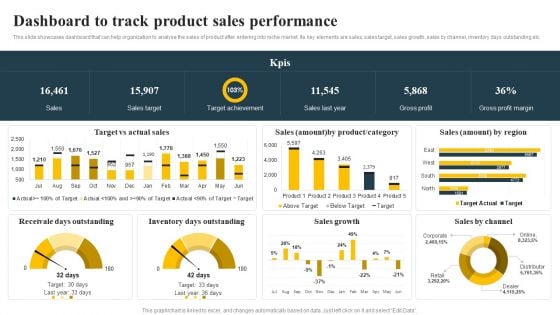
Dashboard To Track Product Sales Performance Implementing Focus Strategy To Improve Designs PDF
This slide showcases dashboard that can help organization to analyse the sales of product after entering into niche market. Its key elements are sales, sales target, sales growth, sales by channel, inventory days outstanding etc.Take your projects to the next level with our ultimate collection of Dashboard To Track Product Sales Performance Implementing Focus Strategy To Improve Designs PDF. Slidegeeks has designed a range of layouts that are perfect for representing task or activity duration, keeping track of all your deadlines at a glance. Tailor these designs to your exact needs and give them a truly corporate look with your own brand colors they all make your projects stand out from the rest.
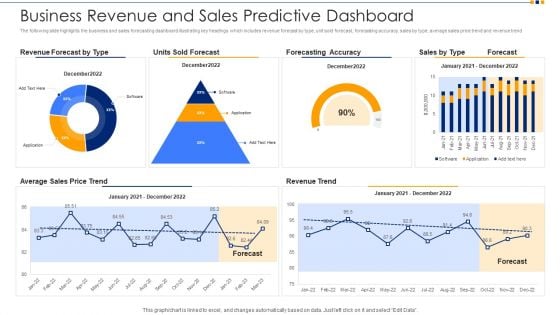
Business Revenue And Sales Predictive Dashboard Ppt Inspiration Background Designs PDF
The following slide highlights the business and sales forecasting dashboard illustrating key headings which includes revenue forecast by type, unit sold forecast, forecasting accuracy, sales by type, average sales price trend and revenue trend. Pitch your topic with ease and precision using this business revenue and sales predictive dashboard ppt inspiration background designs pdf. This layout presents information on revenue forecast by type, units sold forecast, forecasting accuracy, average sales price trend, revenue trend. It is also available for immediate download and adjustment. So, changes can be made in the color, design, graphics or any other component to create a unique layout.
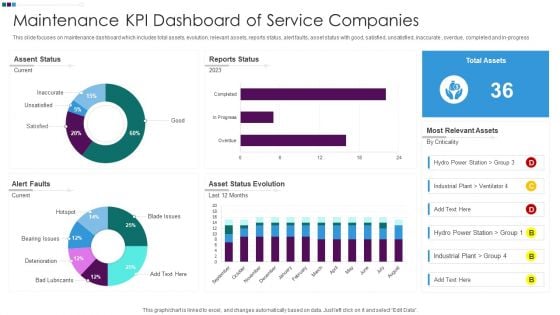
Maintenance KPI Dashboard Of Service Companies Ppt Outline Graphics Design PDF
This slide focuses on maintenance dashboard which includes total assets, evolution, relevant assets, reports status, alert faults, asset status with good, satisfied, unsatisfied, inaccurate , overdue, completed and in-progress. Pitch your topic with ease and precision using this Maintenance KPI Dashboard Of Service Companies Ppt Outline Graphics Design PDF. This layout presents information on Assent Status Current, Reports Status 2023, Asset Status Evolution. It is also available for immediate download and adjustment. So, changes can be made in the color, design, graphics or any other component to create a unique layout.
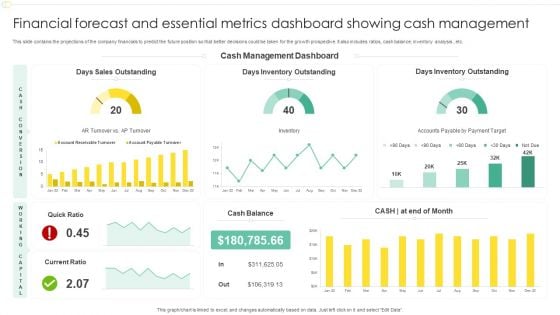
Financial Forecast And Essential Metrics Dashboard Showing Cash Management Designs PDF
This slide contains the projections of the company financials to predict the future position so that better decisions could be taken for the growth prospective. It also includes ratios, cash balance, inventory analysis , etc. Showcasing this set of slides titled Financial Forecast And Essential Metrics Dashboard Showing Cash Management Designs PDF. The topics addressed in these templates are Days Sales Outstanding, Cash Management Dashboard, Days Inventory Outstanding. All the content presented in this PPT design is completely editable. Download it and make adjustments in color, background, font etc. as per your unique business setting.
Half Yearly Content Project Plan Analysis Dashboard Ppt Icon Background Designs PDF
This slide defines the dashboard for 6 month content project plan analysis . it includes information related to the progress, risk , project summary, tasks, etc. Pitch your topic with ease and precision using this Half Yearly Content Project Plan Analysis Dashboard Ppt Icon Background Designs PDF. This layout presents information on Overall Progress, Planning, Risks. It is also available for immediate download and adjustment. So, changes can be made in the color, design, graphics or any other component to create a unique layout.
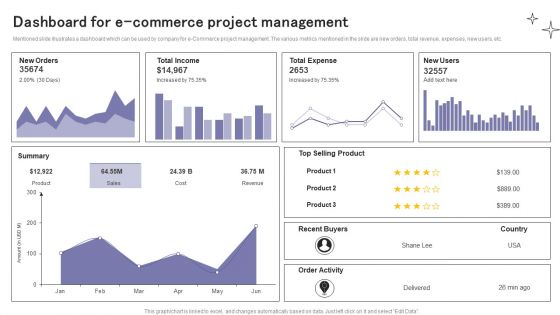
Dashboard For E Commerce Project Management Ppt Ideas Design Inspiration PDF
Mentioned slide illustrates a dashboard which can be used by company for e-Commerce project management. The various metrics mentioned in the slide are new orders, total revenue, expenses, new users, etc. Showcasing this set of slides titled Dashboard For E Commerce Project Management Ppt Ideas Design Inspiration PDF. The topics addressed in these templates are New Orders, Total Income, Total Expense. All the content presented in this PPT design is completely editable. Download it and make adjustments in color, background, font etc. as per your unique business setting.
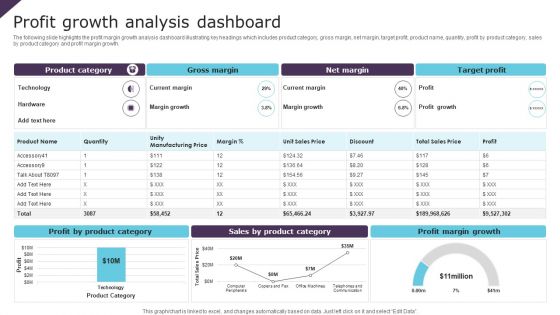
Profit Growth Analysis Dashboard Ppt PowerPoint Presentation File Design Templates PDF
The following slide highlights the profit margin growth analysis dashboard illustrating key headings which includes product category, gross margin, net margin, target profit, product name, quantity, profit by product category, sales by product category and profit margin growth. Showcasing this set of slides titled Profit Growth Analysis Dashboard Ppt PowerPoint Presentation File Design Templates PDF. The topics addressed in these templates are Gross Margin, Net Margin, Target Profit. All the content presented in this PPT design is completely editable. Download it and make adjustments in color, background, font etc. as per your unique business setting.
Project Status Dashboard With Stages And Deliverables Ppt Icon Design Inspiration PDF
This slide shows dashboard with project status based on stages and tasks. It provides information such as project cost performance, actual cost, budget, timeline, resource capacity, etc. Showcasing this set of slides titled Project Status Dashboard With Stages And Deliverables Ppt Icon Design Inspiration PDF. The topics addressed in these templates are Project Cost Performance, Actual Cost, Total Budget. All the content presented in this PPT design is completely editable. Download it and make adjustments in color, background, font etc. as per your unique business setting.
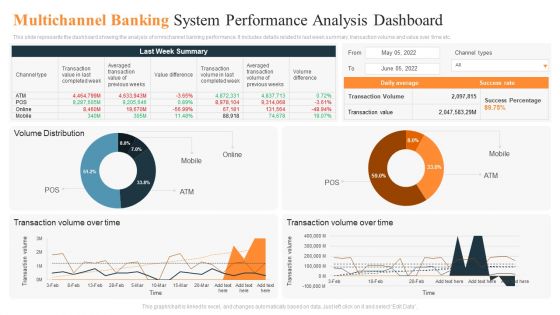
Multichannel Banking System Performance Analysis Dashboard Ppt Pictures Background Designs PDF
This slide represents the dashboard showing the analysis of omnichannel banking performance. It includes details related to last week summary, transaction volume and value over time etc. Showcasing this set of slides titled Multichannel Banking System Performance Analysis Dashboard Ppt Pictures Background Designs PDF. The topics addressed in these templates are Last Week Summary, Transaction Volume, Over Time. All the content presented in this PPT design is completely editable. Download it and make adjustments in color, background, font etc. as per your unique business setting.
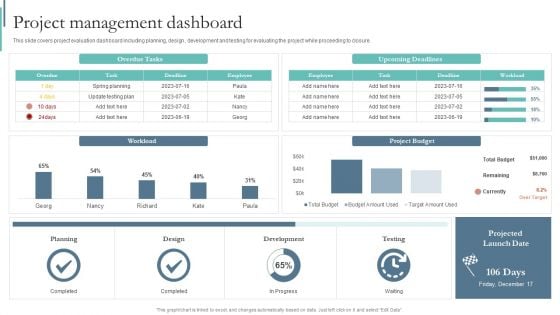
Agile Playbook For Program Designers Project Management Dashboard Ppt Gallery Shapes PDF
This slide covers project evaluation dashboard including planning, design , development and testing for evaluating the project while proceeding to closure. Slidegeeks is one of the best resources for PowerPoint templates. You can download easily and regulate Agile Playbook For Program Designers Project Management Dashboard Ppt Gallery Shapes PDF for your personal presentations from our wonderful collection. A few clicks is all it takes to discover and get the most relevant and appropriate templates. Use our Templates to add a unique zing and appeal to your presentation and meetings. All the slides are easy to edit and you can use them even for advertisement purposes.
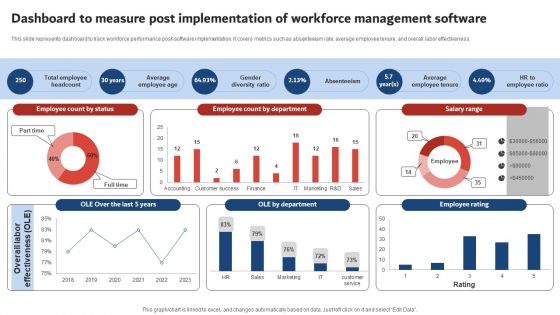
Dashboard To Measure Post Implementation Of Workforce Management Software Designs PDF
This slide represents dashboard to track workforce performance post-software implementation. It covers metrics such as absenteeism rate, average employee tenure, and overall labor effectiveness. Find a pre designed and impeccable Dashboard To Measure Post Implementation Of Workforce Management Software Designs PDF. The templates can ace your presentation without additional effort. You can download these easy to edit presentation templates to make your presentation stand out from others. So, what are you waiting for Download the template from Slidegeeks today and give a unique touch to your presentation.
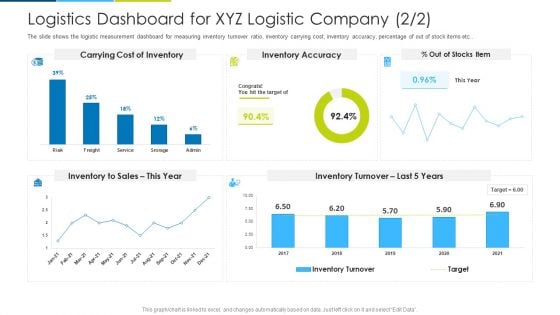
Logistics Dashboard For XYZ Logistic Company Sales Ppt Inspiration Designs Download PDF
The slide shows the logistic measurement dashboard for measuring inventory turnover ratio, inventory carrying cost, inventory accuracy, percentage of out of stock items etc. Deliver an awe inspiring pitch with this creative logistics dashboard for xyz logistic company sales ppt inspiration designs download pdf bundle. Topics like carrying cost of inventory, inventory accuracy, out of stocks item, inventory to sales, inventory turnover can be discussed with this completely editable template. It is available for immediate download depending on the needs and requirements of the user.
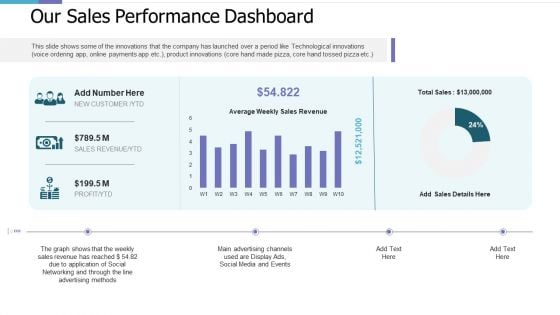
Our Sales Performance Dashboard Investor Pitch Deck For PE Funding Designs PDF
This slide shows some of the innovations that the company has launched over a period like Technological innovations voice ordering app, online payments app etc, product innovations core hand made pizza, core hand tossed pizza etc. Deliver and pitch your topic in the best possible manner with this our sales performance dashboard investor pitch deck for pe funding designs pdf. Use them to share invaluable insights on our sales performance dashboard and impress your audience. This template can be altered and modified as per your expectations. So, grab it now.
Improvising Hiring Process Essential Activities In Recruitment Process Tracking Dashboard Seniority Designs PDF
This slide provides information regarding tracking of essential activities associated to recruitment process and presented in dashboard. Deliver an awe inspiring pitch with this creative improvising hiring process essential activities in recruitment process tracking dashboard seniority designs pdf bundle. Topics like recruitment conversion rate, avg cost of hiring by seniority level, recruiting funnel, avg time to fill by department, turnover rate by age group year can be discussed with this completely editable template. It is available for immediate download depending on the needs and requirements of the user.
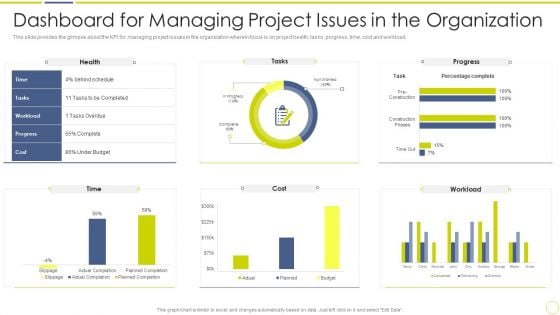
Incident And Issue Management Procedure Dashboard For Managing Project Issues In The Organization Designs PDF
This slide provides the glimpse about the KPI for managing project issues in the organization wherein focus is on project health, tasks, progress, time, cost and workload. Deliver and pitch your topic in the best possible manner with this incident and issue management procedure dashboard for managing project issues in the organization designs pdf. Use them to share invaluable insights on dashboard for managing project issues in the organization and impress your audience. This template can be altered and modified as per your expectations. So, grab it now.
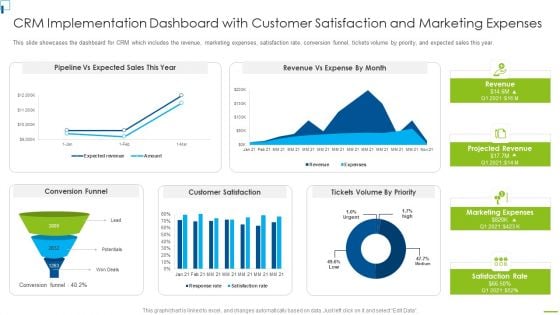
Designing And Deployment CRM Implementation Dashboard With Customer Satisfaction Clipart PDF
This slide showcases the dashboard for CRM which includes the revenue, marketing expenses, satisfaction rate, conversion funnel, tickets volume by priority, and expected sales this year. Deliver an awe inspiring pitch with this creative designing and deployment crm implementation dashboard with customer satisfaction clipart pdf bundle. Topics like pipeline vs expected sales this year, revenue vs expense by month, customer satisfaction, conversion funnel, tickets volume by priority can be discussed with this completely editable template. It is available for immediate download depending on the needs and requirements of the user.
Designing And Deployment CRM Implementation Dashboard With Sales Pipeline Icons PDF
The following slide showcases the CRM dashboard which includes leads, deals, sales revenue, revenue by products, total leads by source, total leads by status and lead distribution. Deliver and pitch your topic in the best possible manner with this designing and deployment crm implementation dashboard with sales pipeline icons pdf. Use them to share invaluable insights on crm, lead distribution, sales revenue, total leads by source, deals, sales pipeline by stage and impress your audience. This template can be altered and modified as per your expectations. So, grab it now.
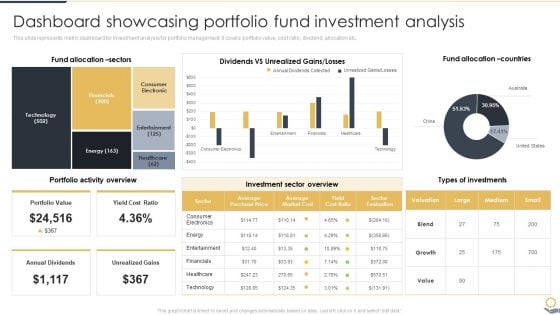
Dashboard Showcasing Portfolio Fund Investment Analysis Portfolio Investment Analysis Designs PDF
This slide represents metric dashboard for investment analysis for portfolio management. It covers portfolio value, cost ratio, dividend, allocation etc.Slidegeeks is one of the best resources for PowerPoint templates. You can download easily and regulate Dashboard Showcasing Portfolio Fund Investment Analysis Portfolio Investment Analysis Designs PDF for your personal presentations from our wonderful collection. A few clicks is all it takes to discover and get the most relevant and appropriate templates. Use our Templates to add a unique zing and appeal to your presentation and meetings. All the slides are easy to edit and you can use them even for advertisement purposes.
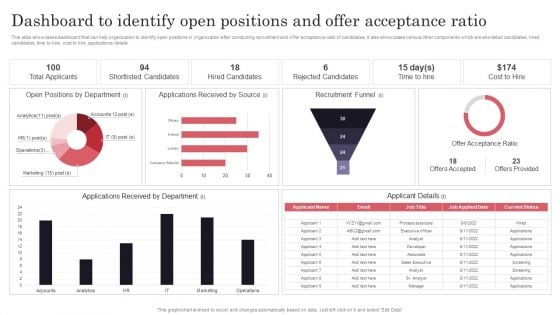
Developing Recruitment Dashboard To Identify Open Positions And Offer Acceptance Ratio Designs PDF
This slide showcases dashboard that can help organization to identify open positions in organization after conducting recruitment and offer acceptance ratio of candidates. It also showcases various other components which are shorlisted candidates, hired candidates, time to hire, cost to hire, applications details. From laying roadmaps to briefing everything in detail, our templates are perfect for you. You can set the stage with your presentation slides. All you have to do is download these easy-to-edit and customizable templates. Developing Recruitment Dashboard To Identify Open Positions And Offer Acceptance Ratio Designs PDF will help you deliver an outstanding performance that everyone would remember and praise you for. Do download this presentation today.
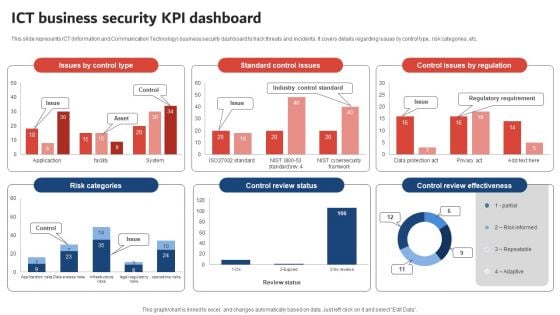
Execution Of ICT Strategic Plan ICT Business Security KPI Dashboard Designs PDF
This slide represents ICT Information and Communication Technology business security dashboard to track threats and incidents. It covers details regarding issues by control type, risk categories, etc. Boost your pitch with our creative Execution Of ICT Strategic Plan ICT Business Security KPI Dashboard Designs PDF. Deliver an awe inspiring pitch that will mesmerize everyone. Using these presentation templates you will surely catch everyones attention. You can browse the ppts collection on our website. We have researchers who are experts at creating the right content for the templates. So you do not have to invest time in any additional work. Just grab the template now and use them.
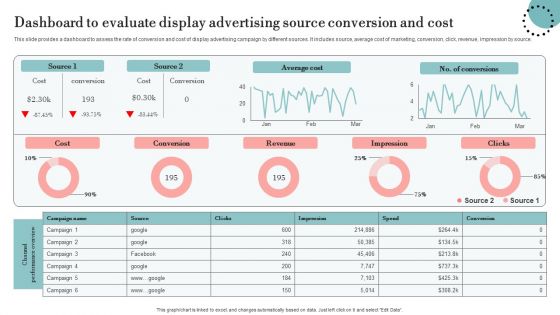
Dashboard To Evaluate Display Advertising Source Conversion And Cost Designs PDF
This slide provides a dashboard to assess the rate of conversion and cost of display advertising campaign by different sources. It includes source, average cost of marketing, conversion, click, revenue, impression by source. Make sure to capture your audiences attention in your business displays with our gratis customizable Dashboard To Evaluate Display Advertising Source Conversion And Cost Designs PDF. These are great for business strategies, office conferences, capital raising or task suggestions. If you desire to acquire more customers for your tech business and ensure they stay satisfied, create your own sales presentation with these plain slides.
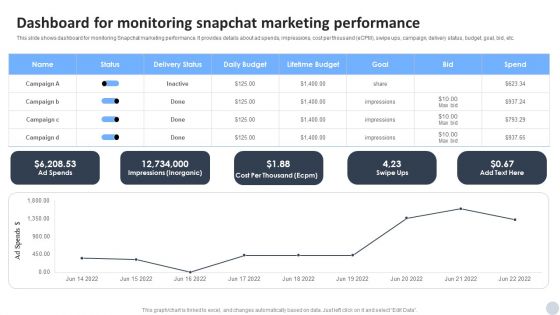
Social Media Marketing Strategies To Generate Lead Dashboard For Monitoring Snapchat Marketing Performance Infographics PDF
This slide shows dashboard for monitoring Snapchat marketing performance. It provides details about ad spends, impressions, cost per thousand eCPM, swipe ups, campaign, delivery status, budget, goal, bid, etc. Create an editable Social Media Marketing Strategies To Generate Lead Dashboard For Monitoring Snapchat Marketing Performance Infographics PDF that communicates your idea and engages your audience. Whether you are presenting a business or an educational presentation, pre designed presentation templates help save time. Social Media Marketing Strategies To Generate Lead Dashboard For Monitoring Snapchat Marketing Performance Infographics PDF is highly customizable and very easy to edit, covering many different styles from creative to business presentations. Slidegeeks has creative team members who have crafted amazing templates. So, go and get them without any delay.
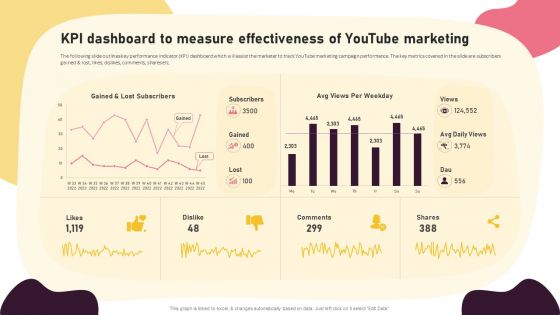
Video Promotion Techniques KPI Dashboard To Measure Effectiveness Of Youtube Pictures PDF
The following slide outlines key performance indicator KPI dashboard which will assist the marketer to track YouTube marketing campaign performance. The key metrics covered in the slide are subscribers gained and lost, likes, dislikes, comments, shares etc. Explore a selection of the finest Video Promotion Techniques KPI Dashboard To Measure Effectiveness Of Youtube Pictures PDF here. With a plethora of professionally designed and pre-made slide templates, you can quickly and easily find the right one for your upcoming presentation. You can use our Video Promotion Techniques KPI Dashboard To Measure Effectiveness Of Youtube Pictures PDF to effectively convey your message to a wider audience. Slidegeeks has done a lot of research before preparing these presentation templates. The content can be personalized and the slides are highly editable. Grab templates today from Slidegeeks.
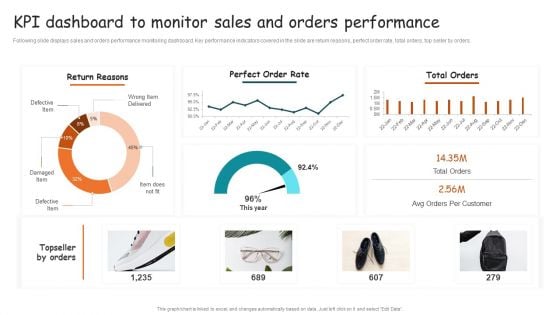
Guide For Brand Kpi Dashboard To Monitor Sales And Orders Performance Brochure PDF
Following slide displays sales and orders performance monitoring dashboard. Key performance indicators covered in the slide are return reasons, perfect order rate, total orders, top seller by orders. Do you have an important presentation coming up Are you looking for something that will make your presentation stand out from the rest Look no further than Guide For Brand Kpi Dashboard To Monitor Sales And Orders Performance Brochure PDF. With our professional designs, you can trust that your presentation will pop and make delivering it a smooth process. And with Slidegeeks, you can trust that your presentation will be unique and memorable. So why wait Grab Guide For Brand Kpi Dashboard To Monitor Sales And Orders Performance Brochure PDF today and make your presentation stand out from the rest.
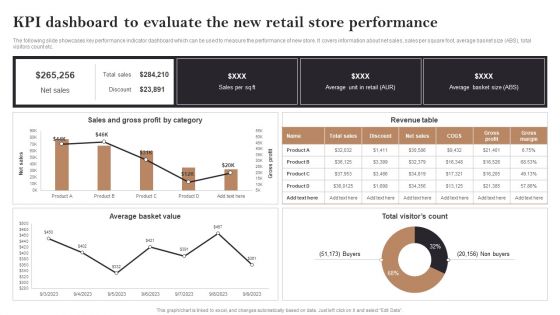
Kpi Dashboard To Evaluate The New Retail Store Performance Opening Retail Store In Untapped Download PDF
The following slide showcases key performance indicator dashboard which can be used to measure the performance of new store. It covers information about net sales, sales per square foot, average basket size ABS, total visitors count etc.Create an editable Kpi Dashboard To Evaluate The New Retail Store Performance Opening Retail Store In Untapped Download PDF that communicates your idea and engages your audience. Whether you are presenting a business or an educational presentation, pre-designed presentation templates help save time. Kpi Dashboard To Evaluate The New Retail Store Performance Opening Retail Store In Untapped Download PDF is highly customizable and very easy to edit, covering many different styles from creative to business presentations. Slidegeeks has creative team members who have crafted amazing templates. So, go and get them without any delay.
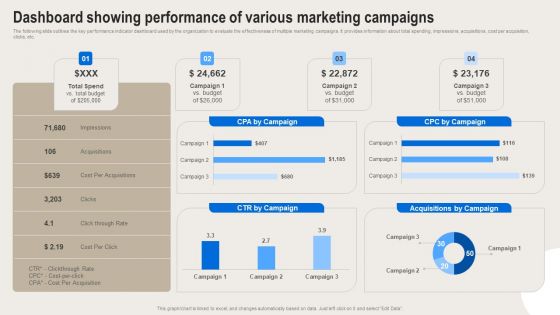
Formulating Branding Strategy To Enhance Revenue And Sales Dashboard Showing Performance Of Various Graphics PDF
The following slide outlines the key performance indicator dashboard used by the organization to evaluate the effectiveness of multiple marketing campaigns. It provides information about total spending, impressions, acquisitions, cost per acquisition, clicks, etc. Create an editable Formulating Branding Strategy To Enhance Revenue And Sales Dashboard Showing Performance Of Various Graphics PDF that communicates your idea and engages your audience. Whether youre presenting a business or an educational presentation, pre designed presentation templates help save time. Formulating Branding Strategy To Enhance Revenue And Sales Dashboard Showing Performance Of Various Graphics PDF is highly customizable and very easy to edit, covering many different styles from creative to business presentations. Slidegeeks has creative team members who have crafted amazing templates. So, go and get them without any delay.


 Continue with Email

 Home
Home


