Dashboards Summary
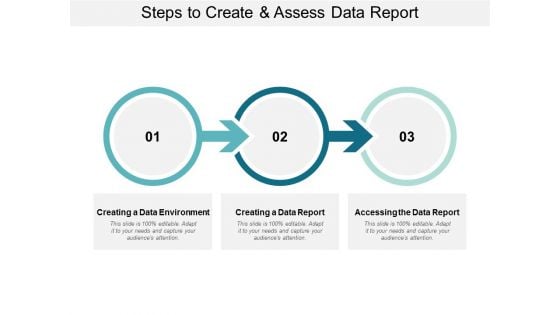
Steps To Create And Assess Data Report Ppt PowerPoint Presentation Portfolio Graphics Design
Presenting this set of slides with name steps to create and assess data report ppt powerpoint presentation portfolio graphics design. This is a three stage process. The stages in this process are data report, infographics brochure, business statement. This is a completely editable PowerPoint presentation and is available for immediate download. Download now and impress your audience.
Business Data Report Vector Icon Ppt PowerPoint Presentation Show Microsoft PDF
Presenting this set of slides with name business data report vector icon ppt powerpoint presentation show microsoft pdf. This is a three stage process. The stages in this process are business data report vector icon. This is a completely editable PowerPoint presentation and is available for immediate download. Download now and impress your audience.

Ultimate Guide To Developing Kpis To Measure Effectiveness Of Content On Auto Dealer Strategy SS V
This slide covers metrics to evaluate effectiveness of content posted on dealers website. The purpose of this template is to provide an overview on top key performance indicators determining success of content such as user behavior, engagement, SEO outcomes, company revenue generation, etc. The Ultimate Guide To Developing Kpis To Measure Effectiveness Of Content On Auto Dealer Strategy SS V is a compilation of the most recent design trends as a series of slides. It is suitable for any subject or industry presentation, containing attractive visuals and photo spots for businesses to clearly express their messages. This template contains a variety of slides for the user to input data, such as structures to contrast two elements, bullet points, and slides for written information. Slidegeeks is prepared to create an impression. This slide covers metrics to evaluate effectiveness of content posted on dealers website. The purpose of this template is to provide an overview on top key performance indicators determining success of content such as user behavior, engagement, SEO outcomes, company revenue generation, etc.
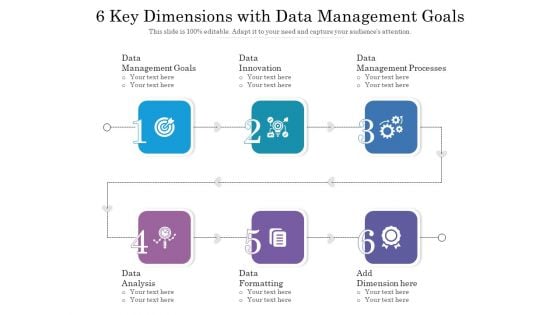
6 Key Dimensions With Data Management Goals Ppt PowerPoint Presentation File Outline PDF
Presenting 6 key dimensions with data management goals ppt powerpoint presentation file outline pdf to dispense important information. This template comprises five stages. It also presents valuable insights into the topics including data innovation, data formatting, data analysis. This is a completely customizable PowerPoint theme that can be put to use immediately. So, download it and address the topic impactfully.
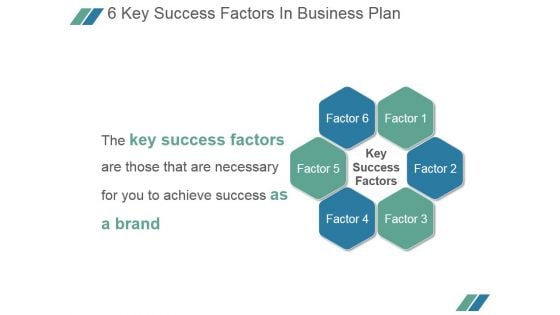
6 Key Success Factors In Business Plan Ppt PowerPoint Presentation Microsoft
This is a 6 key success factors in business plan ppt powerpoint presentation microsoft. This is a six stage process. The stages in this process are key success factors, factor.
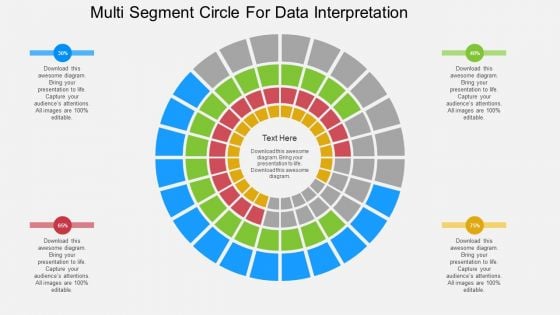
Multi Segment Circle For Data Interpretation Powerpoint Template
This PowerPoint template has been designed with circular web diagram. This diagram is useful to display outline of a business plan. Visual effect helps in maintaining the flow of the discussion and provides more clarity to the subject.
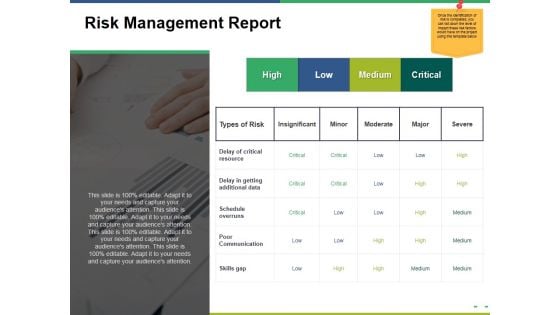
Risk Management Report Ppt PowerPoint Presentation Outline Show
This is a risk management report ppt powerpoint presentation outline show. This is a five stage process. The stages in this process are high, low, medium, critical.
Data Transformation Shift Icon With Wheel Ppt PowerPoint Presentation Outline PDF
Persuade your audience using this Data Transformation Shift Icon With Wheel Ppt PowerPoint Presentation Outline PDF. This PPT design covers three stages, thus making it a great tool to use. It also caters to a variety of topics including Data Transformation, Shift Icon With Wheel. Download this PPT design now to present a convincing pitch that not only emphasizes the topic but also showcases your presentation skills.
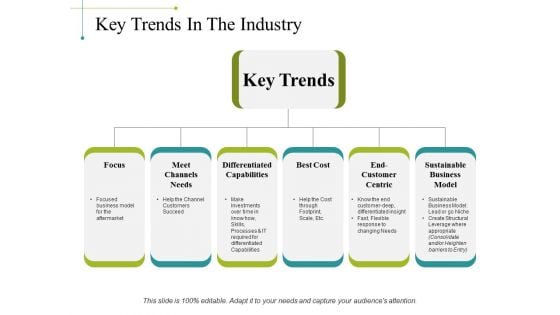
Key Trends In The Industry Ppt PowerPoint Presentation Portfolio Design Inspiration
This is a key trends in the industry ppt powerpoint presentation portfolio design inspiration. This is a six stage process. The stages in this process are focus, meet channels needs, differentiated capabilities, best cost, sustainable business model.
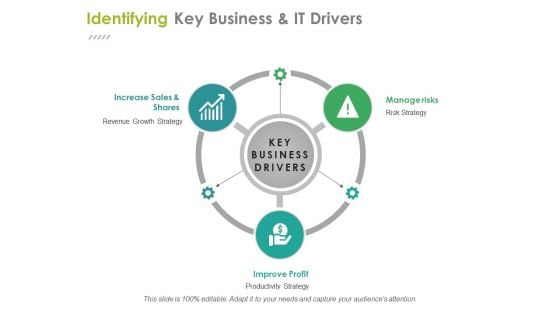
Identifying Key Business And It Drivers Ppt PowerPoint Presentation Ideas Files
This is a identifying key business and it drivers ppt powerpoint presentation ideas files. This is a three stage process. The stages in this process are increase sales and shares, improve profit, manage risks, business, management.
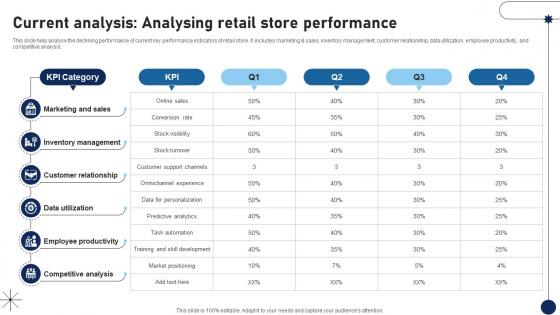
Current Analysis Analysing Retail Store Performance DT SS V
This slide help analyse the declining performance of current key performance indicators of retail store. It includes marketing and sales, inventory management, customer relationship, data utilization, employee productivity, and competitive analysis.Whether you have daily or monthly meetings, a brilliant presentation is necessary. Current Analysis Analysing Retail Store Performance DT SS V can be your best option for delivering a presentation. Represent everything in detail using Current Analysis Analysing Retail Store Performance DT SS V and make yourself stand out in meetings. The template is versatile and follows a structure that will cater to your requirements. All the templates prepared by Slidegeeks are easy to download and edit. Our research experts have taken care of the corporate themes as well. So, give it a try and see the results. This slide help analyse the declining performance of current key performance indicators of retail store. It includes marketing and sales, inventory management, customer relationship, data utilization, employee productivity, and competitive analysis.
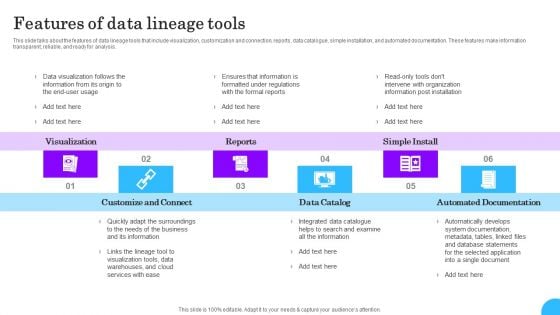
Comprehensive Analysis Of Different Data Lineage Classification Features Of Data Lineage Tools Clipart PDF
This slide talks about the features of data lineage tools that include visualization, customization and connection, reports, data catalogue, simple installation, and automated documentation. These features make information transparent, reliable, and ready for analysis. The best PPT templates are a great way to save time, energy, and resources. Slidegeeks have 100 percent editable powerpoint slides making them incredibly versatile. With these quality presentation templates, you can create a captivating and memorable presentation by combining visually appealing slides and effectively communicating your message. Download Comprehensive Analysis Of Different Data Lineage Classification Features Of Data Lineage Tools Clipart PDF from Slidegeeks and deliver a wonderful presentation.
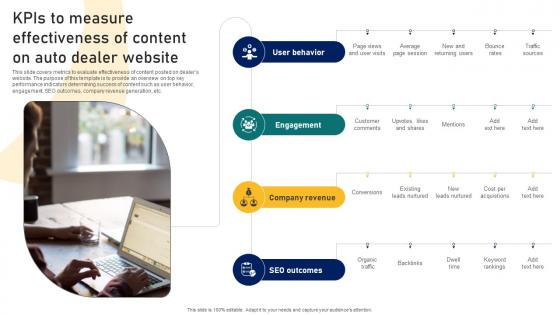
Guide To Building A Successful Kpis To Measure Effectiveness Of Content On Auto Dealer Strategy SS V
This slide covers metrics to evaluate effectiveness of content posted on dealers website. The purpose of this template is to provide an overview on top key performance indicators determining success of content such as user behavior, engagement, SEO outcomes, company revenue generation, etc. The Guide To Building A Successful Kpis To Measure Effectiveness Of Content On Auto Dealer Strategy SS V is a compilation of the most recent design trends as a series of slides. It is suitable for any subject or industry presentation, containing attractive visuals and photo spots for businesses to clearly express their messages. This template contains a variety of slides for the user to input data, such as structures to contrast two elements, bullet points, and slides for written information. Slidegeeks is prepared to create an impression. This slide covers metrics to evaluate effectiveness of content posted on dealers website. The purpose of this template is to provide an overview on top key performance indicators determining success of content such as user behavior, engagement, SEO outcomes, company revenue generation, etc.
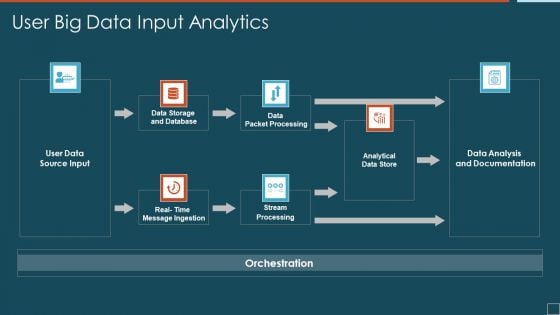
User Big Data Input Analytics Designs PDF
Showcasing this set of slides titled user big data input analytics designs pdf. The topics addressed in these templates are analytical data store, data packet processing, stream processing. All the content presented in this PPT design is completely editable. Download it and make adjustments in color, background, font etc. as per your unique business setting.
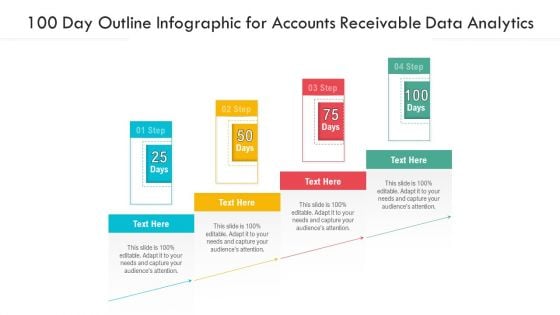
100 Day Outline Infographic For Accounts Receivable Data Analytics Ppt PowerPoint Presentation Gallery Picture PDF
Presenting 100 day outline infographic for accounts receivable data analytics ppt powerpoint presentation gallery picture pdf to dispense important information. This template comprises four stages. It also presents valuable insights into the topics including 100 day outline infographic for accounts receivable data analytics. This is a completely customizable PowerPoint theme that can be put to use immediately. So, download it and address the topic impactfully.
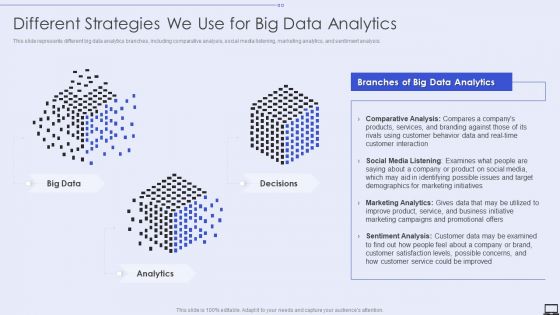
Different Strategies We Use For Big Data Analytics Ppt PowerPoint Presentation File Professional PDF
This slide represents different big data analytics branches, including comparative analysis, social media listening, marketing analytics, and sentiment analysis. Deliver and pitch your topic in the best possible manner with this Different Strategies We Use For Big Data Analytics Ppt PowerPoint Presentation File Professional PDF. Use them to share invaluable insights on Analytics, Big Data, Decisions and impress your audience. This template can be altered and modified as per your expectations. So, grab it now.
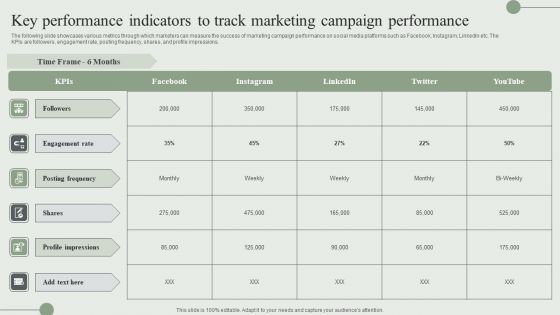
Key Performance Indicators To Track Marketing Campaign Performance Ppt PowerPoint Presentation File Ideas PDF
The following slide showcases various metrics through which marketers can measure the success of marketing campaign performance on social media platforms such as Facebook, Instagram, LinkedIn etc. The KPIs are followers, engagement rate, posting frequency, shares, and profile impressions. There are so many reasons you need a Key Performance Indicators To Track Marketing Campaign Performance Ppt PowerPoint Presentation File Ideas PDF. The first reason is you cannot spend time making everything from scratch, Thus, Slidegeeks has made presentation templates for you too. You can easily download these templates from our website easily.
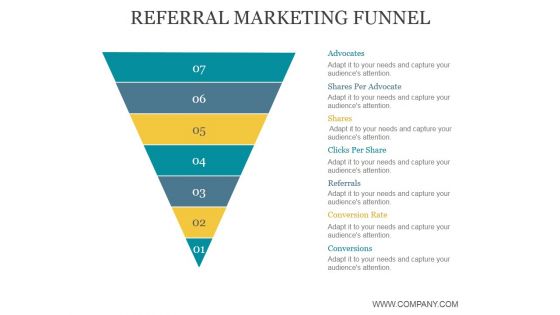
Referral Marketing Funnel Ppt PowerPoint Presentation Templates
This is a referral marketing funnel ppt powerpoint presentation templates. This is a seven stage process. The stages in this process are advocates, shares, clicks per share, conversion rate, conversions.
Big Data Analysis Icon Data Analytic Business Ppt PowerPoint Presentation Complete Deck
Presenting this set of slides with name big data analysis icon data analytic business ppt powerpoint presentation complete deck. The topics discussed in these slides are data analytic, business, growth, gear, magnifying glass. This is a completely editable PowerPoint presentation and is available for immediate download. Download now and impress your audience.
Data Administration Icon Data Collection Business Ppt PowerPoint Presentation Complete Deck
This data administration icon data collection business ppt powerpoint presentation complete deck acts as backup support for your ideas, vision, thoughts, etc. Use it to present a thorough understanding of the topic. This PPT slideshow can be utilized for both in-house and outside presentations depending upon your needs and business demands. Entailing twelve slides with a consistent design and theme, this template will make a solid use case. As it is intuitively designed, it suits every business vertical and industry. All you have to do is make a few tweaks in the content or any other component to design unique presentations. The biggest advantage of this complete deck is that it can be personalized multiple times once downloaded. The color, design, shapes, and other elements are free to modify to add personal touches. You can also insert your logo design in this PPT layout. Therefore a well-thought and crafted presentation can be delivered with ease and precision by downloading this data administration icon data collection business ppt powerpoint presentation complete deck PPT slideshow.
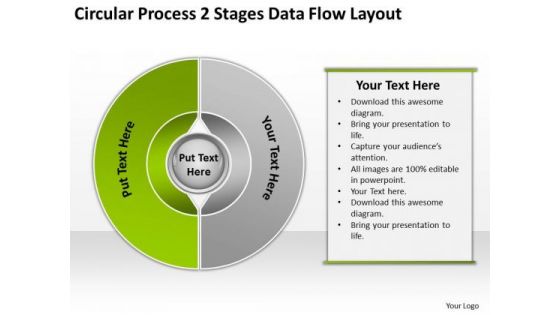
Circular Process 2 Stages Data Flow Layout Market Plan Example PowerPoint Slides
We present our circular process 2 stages data flow layout market plan example PowerPoint Slides.Use our Process and Flows PowerPoint Templates because Our PowerPoint Templates and Slides will let your team Walk through your plans. See their energy levels rise as you show them the way. Download our Circle Charts PowerPoint Templates because Our PowerPoint Templates and Slides will Activate the energies of your audience. Get their creative juices flowing with your words. Download our Business PowerPoint Templates because These PowerPoint Templates and Slides will give the updraft to your ideas. See them soar to great heights with ease. Use our Marketing PowerPoint Templates because You are an avid believer in ethical practices. Highlight the benefits that accrue with our PowerPoint Templates and Slides. Use our Success PowerPoint Templates because Our PowerPoint Templates and Slides will let you meet your Deadlines.Use these PowerPoint slides for presentations relating to Cross, circle,statistics, model, target,two,steps, statement, interface, business, arrow, list, presentation, glossy, internet, diagram, circle,brochure, description, report, marketing, level, abstract, wheel, steps, illustration, pie, chart, sphere, registry, catalog, section, futuristic, colors, web, design,information, space, demonstration, navigation, pattern, webdesign, structure, multiple, button, goals. The prominent colors used in the PowerPoint template are Green lime, White, Gray. Our Circular Process 2 Stages Data Flow Layout Market Plan Example PowerPoint Slides have a everlasting effect. They remain in the memory for ages.
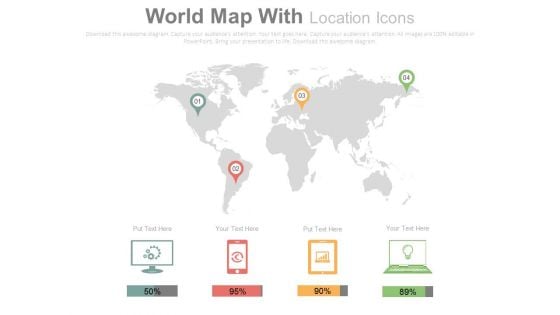
Electronic Devices Global Market Reports PowerPoint Slides
The fight between various gadget manufacturers, internet service providers and operating systems is no longer limited to any specific country. It has gone global and this slide can help present relevant data in a very modern and easy to understand and remember manner. This template has been created by our experienced designers keeping in mind the regular reporting and the data that is to be maintained regarding the number of users and their patterns by various technology companies. The slide has icons of a desktop, a smartphone, a tablet and a laptop accompanied with percentage bars. These can be effectively used to mark the percentage of users on each device, users accessing a website or an app on each device or the sales figures. The location pins can be used to mark the location with maximum number of users or the maximum sales from a location.
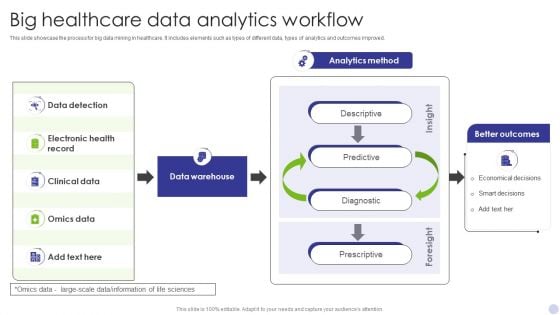
Big Healthcare Data Analytics Workflow Infographics PDF
This slide showcase the process for big data mining in healthcare. It includes elements such as types of different data, types of analytics and outcomes improved. Showcasing this set of slides titled Big Healthcare Data Analytics Workflow Infographics PDF. The topics addressed in these templates are Data Detection, Electronic Health Record, Clinical Data. All the content presented in this PPT design is completely editable. Download it and make adjustments in color, background, font etc. as per your unique business setting.
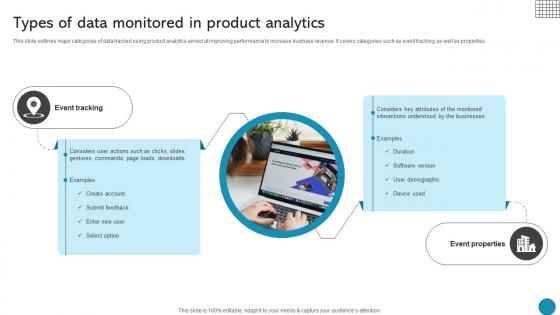
Types Of Data Monitored In Product Analytics Driving Business Success Integrating Product
This slide outlines major categories of data tracked using product analytics aimed at improving performance to increase business revenue. It covers categories such as event tracking as well as properties Slidegeeks has constructed Types Of Data Monitored In Product Analytics Driving Business Success Integrating Product after conducting extensive research and examination. These presentation templates are constantly being generated and modified based on user preferences and critiques from editors. Here, you will find the most attractive templates for a range of purposes while taking into account ratings and remarks from users regarding the content. This is an excellent jumping-off point to explore our content and will give new users an insight into our top-notch PowerPoint Templates. This slide outlines major categories of data tracked using product analytics aimed at improving performance to increase business revenue. It covers categories such as event tracking as well as properties
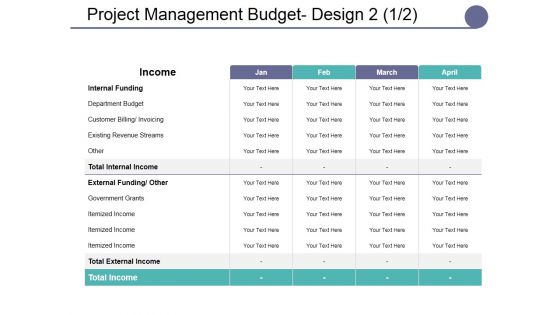
Project Management Budget Design Ppt PowerPoint Presentation Layouts Shapes
This is a project management budget design ppt powerpoint presentation layouts shapes. This is a four stage process. The stages in this process are lists, table, data, management, marketing.

Key Metrics To Consider In Prompt Evaluation Crafting Interactions A Guide AI SS V
This slide showcases key metrics to consider while evaluating prompt engineering, referable by users and multiple businesses harnessing this technology. It provides information about relevance, coherence, accuracy, etc. The Key Metrics To Consider In Prompt Evaluation Crafting Interactions A Guide AI SS V is a compilation of the most recent design trends as a series of slides. It is suitable for any subject or industry presentation, containing attractive visuals and photo spots for businesses to clearly express their messages. This template contains a variety of slides for the user to input data, such as structures to contrast two elements, bullet points, and slides for written information. Slidegeeks is prepared to create an impression. This slide showcases key metrics to consider while evaluating prompt engineering, referable by users and multiple businesses harnessing this technology. It provides information about relevance, coherence, accuracy, etc.
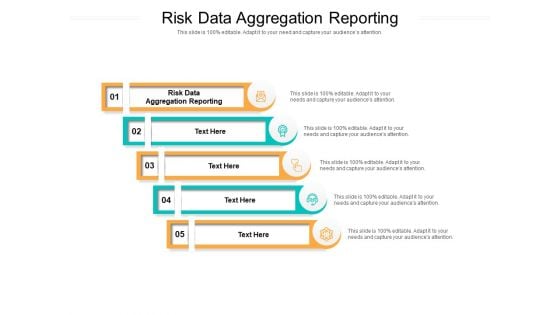
Risk Data Aggregation Reporting Ppt PowerPoint Presentation Gallery Structure Cpb Pdf
Presenting this set of slides with name risk data aggregation reporting ppt powerpoint presentation gallery structure cpb pdf. This is an editable Powerpoint five stages graphic that deals with topics like risk data aggregation reporting to help convey your message better graphically. This product is a premium product available for immediate download and is 100 percent editable in Powerpoint. Download this now and use it in your presentations to impress your audience.
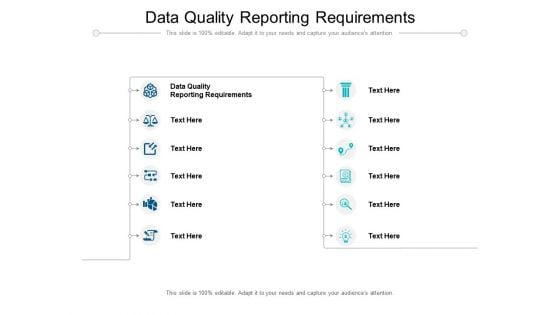
Data Quality Reporting Requirements Ppt PowerPoint Presentation Portfolio Introduction Cpb Pdf
Presenting this set of slides with name data quality reporting requirements ppt powerpoint presentation portfolio introduction cpb pdf. This is an editable Powerpoint twelve stages graphic that deals with topics like data quality reporting requirements to help convey your message better graphically. This product is a premium product available for immediate download and is 100 percent editable in Powerpoint. Download this now and use it in your presentations to impress your audience.
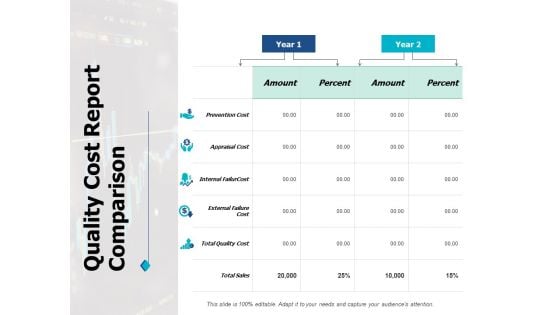
Quality Cost Report Comparison Ppt PowerPoint Presentation Outline Graphics Pictures
This is a quality cost report comparison ppt powerpoint presentation outline graphics pictures. This is a two stage process. The stages in this process are compare, marketing, business, management, planning.
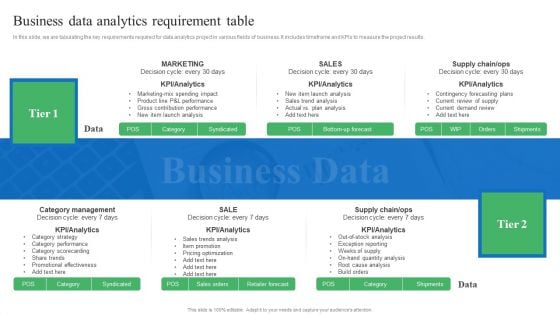
Toolkit For Data Science And Analytics Transition Business Data Analytics Requirement Table Sample PDF
In this slide, we are tabulating the key requirements required for data analytics project in various fields of business. It includes timeframe and KPIs to measure the project results. This Toolkit For Data Science And Analytics Transition Business Data Analytics Requirement Table Sample PDF from Slidegeeks makes it easy to present information on your topic with precision. It provides customization options, so you can make changes to the colors, design, graphics, or any other component to create a unique layout. It is also available for immediate download, so you can begin using it right away. Slidegeeks has done good research to ensure that you have everything you need to make your presentation stand out. Make a name out there for a brilliant performance.

Magnifying Glass Ppt PowerPoint Presentation Styles Layout
This is a magnifying glass ppt powerpoint presentation styles layout. This is a one stage process. The stages in this process are magnifying glass, search, marketing, strategy, business.

Magnifying Glass Ppt PowerPoint Presentation Layouts Gallery
This is a magnifying glass ppt powerpoint presentation layouts gallery. This is a one stage process. The stages in this process are magnifying glass, business, marketing, communication, management.

Magnify Glass Ppt PowerPoint Presentation Layouts Gridlines
This is a magnify glass ppt powerpoint presentation layouts gridlines. This is a one stage process. The stages in this process are magnify glass, business, marketing, strategy, icons.
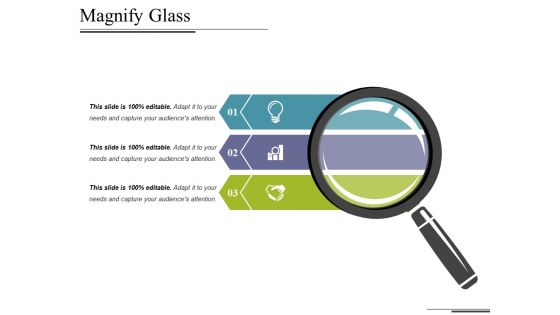
Magnify Glass Ppt PowerPoint Presentation Layouts Inspiration
This is a magnify glass ppt powerpoint presentation layouts inspiration. This is a three stage process. The stages in this process are magnify glass, technology, marketing, business, icons.
Magnifying Glass Ppt PowerPoint Presentation Icon Layouts
This is a magnifying glass ppt powerpoint presentation icon layouts. This is a one stage process. The stages in this process are magnifying glass, marketing, technology, business.
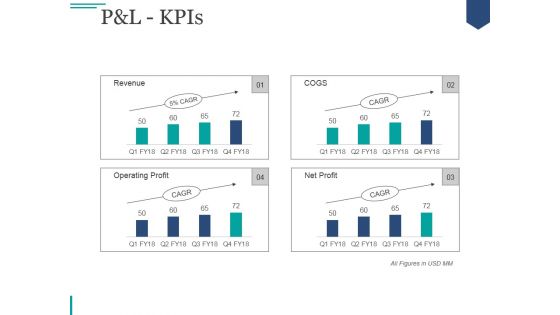
Pandl Kpis Ppt PowerPoint Presentation Deck
This is a pandl kpis ppt powerpoint presentation deck. This is a four stage process. The stages in this process are net sales, other income, total income, expenses, total material consumed.
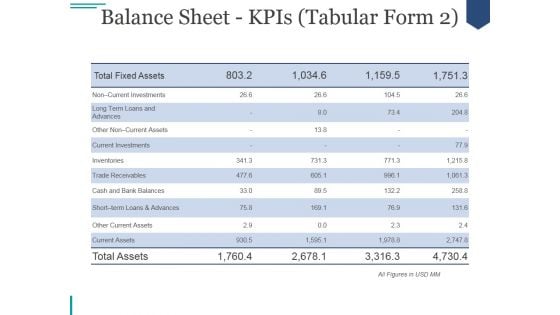
Balance Sheet Kpis Ppt PowerPoint Presentation Graphics
This is a balance sheet kpis ppt powerpoint presentation graphics. This is a five stage process. The stages in this process are long term loans and advances, other non current assets, current investments, inventories, inventories.
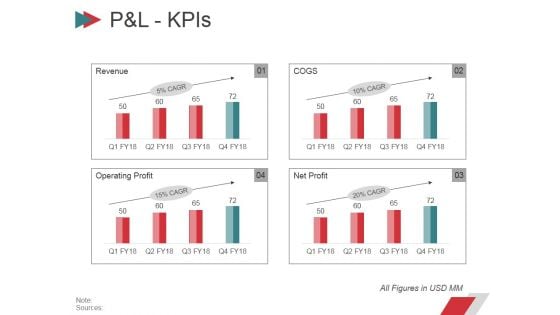
Pandl Kpis Ppt PowerPoint Presentation Gallery Slides
This is a pandl kpis ppt powerpoint presentation gallery slides. This is a four stage process. The stages in this process are net sales, other income, total income, expenses, total material consumed.
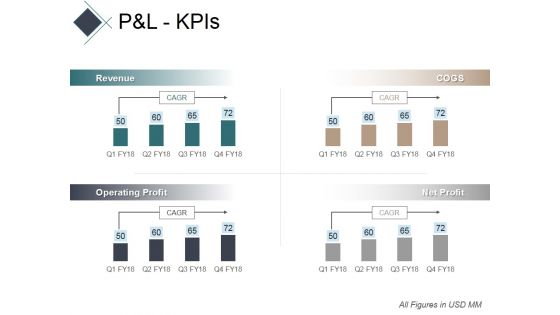
Pandl Kpis Ppt PowerPoint Presentation Professional Show
This is a pandl kpis ppt powerpoint presentation professional show. This is a four stage process. The stages in this process are other income, total income, expenses, total material consumed, employee benefit expense.
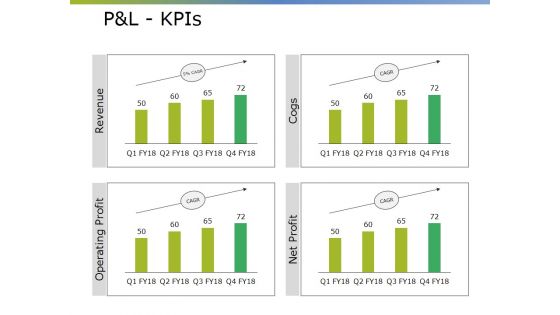
Pandl Kpis Ppt PowerPoint Presentation Gallery Display
This is a pandl kpis ppt powerpoint presentation gallery display. This is a four stage process. The stages in this process are net sales, total income, expenses, ebitda, profit after tax.
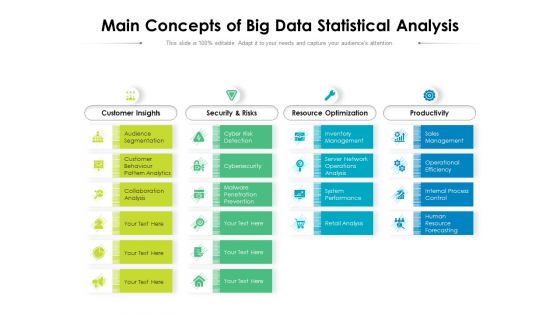
Main Concepts Of Big Data Statistical Analysis Ppt PowerPoint Presentation Pictures Introduction PDF
Presenting this set of slides with name main concepts of big data statistical analysis ppt powerpoint presentation pictures introduction pdf. This is a four stage process. The stages in this process are customer insights, security and risks, resource optimization, productivity. This is a completely editable PowerPoint presentation and is available for immediate download. Download now and impress your audience.
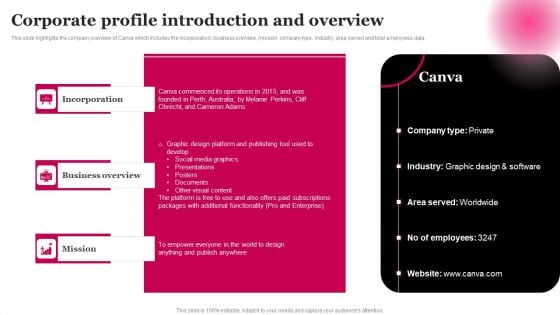
Picture Editing Company Outline Corporate Profile Introduction And Overview Ideas PDF
This slide highlights the company overview of Canva which includes the incorporation, business overview, mission, company type, industry, area served and total employees data. Retrieve professionally designed Picture Editing Company Outline Corporate Profile Introduction And Overview Ideas PDF to effectively convey your message and captivate your listeners. Save time by selecting pre made slideshows that are appropriate for various topics, from business to educational purposes. These themes come in many different styles, from creative to corporate, and all of them are easily adjustable and can be edited quickly. Access them as PowerPoint templates or as Google Slides themes. You do not have to go on a hunt for the perfect presentation because Slidegeeks got you covered from everywhere.
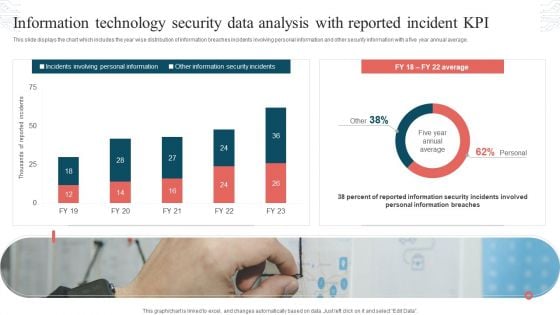
Information Technology Security Data Analysis With Reported Incident KPI Download PDF
This slide displays the chart which includes the year wise distribution of information breaches incidents involving personal information and other security information with a five year annual average. Showcasing this set of slides titled Information Technology Security Data Analysis With Reported Incident KPI Download PDF. The topics addressed in these templates are Incidents Involving, Personal Information, Other Information, Security Incidents. All the content presented in this PPT design is completely editable. Download it and make adjustments in color, background, font etc. as per your unique business setting.

Data Identification Solutions Analysis Market Ppt PowerPoint Presentation Complete Deck
Share a great deal of information on the topic by deploying this data identification solutions analysis market ppt powerpoint presentation complete deck. Support your ideas and thought process with this prefabricated set. It includes a set of twelve slides, all fully modifiable and editable. Each slide can be restructured and induced with the information and content of your choice. You can add or remove large content boxes as well, to make this PPT slideshow more personalized. Its high-quality graphics and visuals help in presenting a well-coordinated pitch. This PPT template is also a resourceful tool to take visual cues from and implement the best ideas to help your business grow and expand. The main attraction of this well-formulated deck is that everything is editable, giving you the freedom to adjust it to your liking and choice. Changes can be made in the background and theme as well to deliver an outstanding pitch. Therefore, click on the download button now to gain full access to this multifunctional set.

Data Analysis Deployment Marketing Ppt PowerPoint Presentation Complete Deck
Share a great deal of information on the topic by deploying this data analysis deployment marketing ppt powerpoint presentation complete deck. Support your ideas and thought process with this prefabricated set. It includes a set of twelve slides, all fully modifiable and editable. Each slide can be restructured and induced with the information and content of your choice. You can add or remove large content boxes as well, to make this PPT slideshow more personalized. Its high-quality graphics and visuals help in presenting a well-coordinated pitch. This PPT template is also a resourceful tool to take visual cues from and implement the best ideas to help your business grow and expand. The main attraction of this well-formulated deck is that everything is editable, giving you the freedom to adjust it to your liking and choice. Changes can be made in the background and theme as well to deliver an outstanding pitch. Therefore, click on the download button now to gain full access to this multifunctional set.
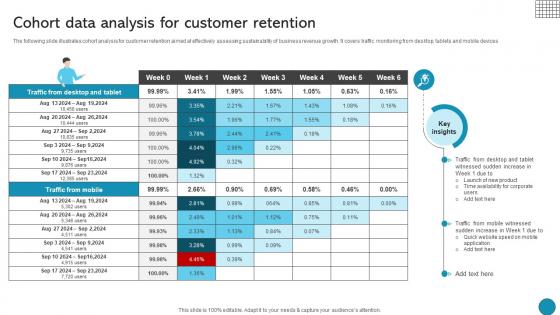
Cohort Data Analysis For Customer Retention Driving Business Success Integrating Product
The following slide illustrates cohort analysis for customer retention aimed at effectively assessing sustainability of business revenue growth. It covers traffic monitoring from desktop, tablets and mobile devicesFind highly impressive Cohort Data Analysis For Customer Retention Driving Business Success Integrating Product on Slidegeeks to deliver a meaningful presentation. You can save an ample amount of time using these presentation templates. No need to worry to prepare everything from scratch because Slidegeeks experts have already done a huge research and work for you. You need to download Cohort Data Analysis For Customer Retention Driving Business Success Integrating Product for your upcoming presentation. All the presentation templates are 100 percent editable and you can change the color and personalize the content accordingly. Download now The following slide illustrates cohort analysis for customer retention aimed at effectively assessing sustainability of business revenue growth. It covers traffic monitoring from desktop, tablets and mobile devices
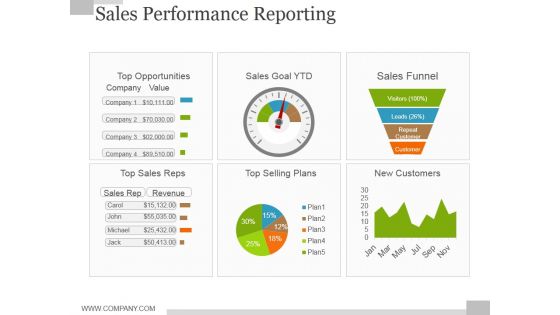
Sales Performance Reporting Ppt PowerPoint Presentation Outline Diagrams
This is a sales performance reporting ppt powerpoint presentation outline diagrams. This is a six stage process. The stages in this process are sales funnel, new customers, top selling plans, top sales reps, top opportunities.
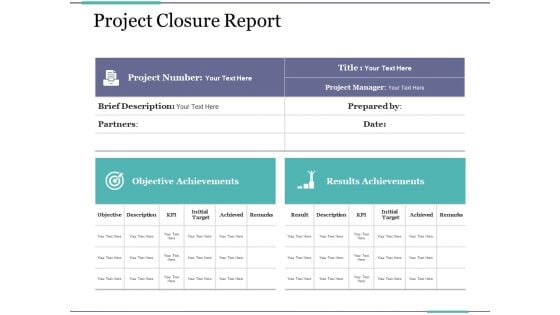
Project Closure Report Ppt PowerPoint Presentation Outline Professional
This is a project closure report ppt powerpoint presentation outline professional. This is a four stage process. The stages in this process are business, brief description, objective achievements, results achievements, project number.
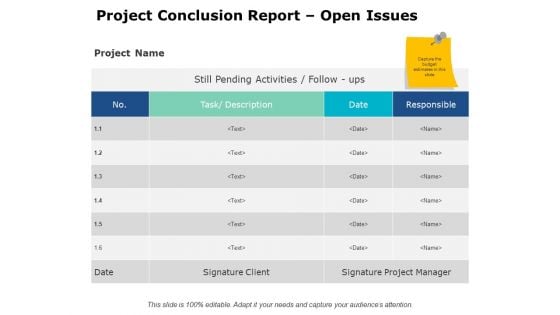
Project Conclusion Report Open Issues Ppt PowerPoint Presentation Outline Background
This is a project conclusion report open issues ppt powerpoint presentation outline background. This is a four stage process. The stages in this process are performance analysis, open issues, deadlines, milestones, planning.
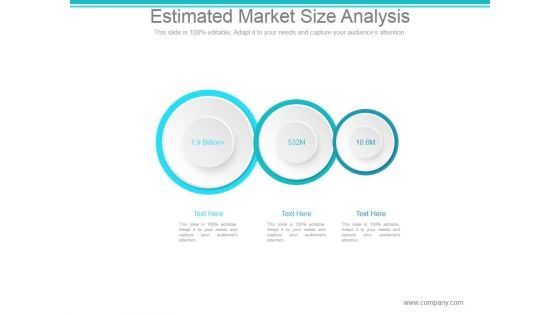
Estimated Market Size Analysis Ppt PowerPoint Presentation Slide Download
This is a estimated market size analysis ppt powerpoint presentation slide download. This is a three stage process. The stages in this process are billion, market, business.
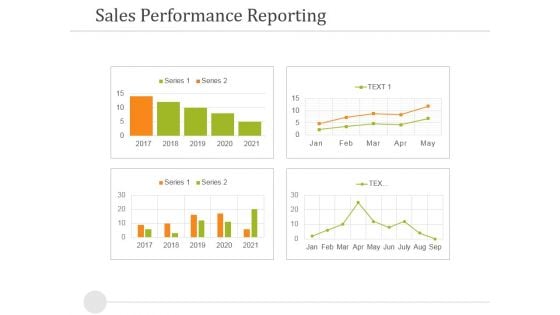
Sales Performance Reporting Ppt PowerPoint Presentation Outline Outfit
This is a sales performance reporting ppt powerpoint presentation outline outfit. This is a four stage process. The stages in this process are sales performance reporting, business, success, strategy, finance.
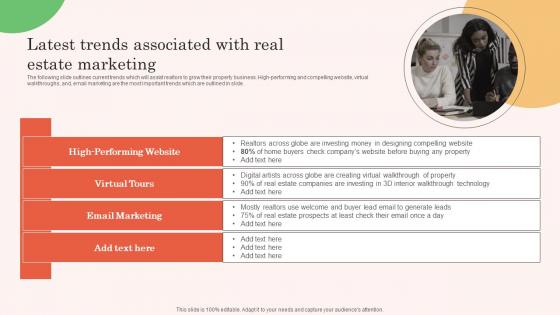
Latest Trends Associated With Real Estate Marketing Real Estate Property Marketing Professional Pdf
The following slide outlines current trends which will assist realtors to grow their property business. High-performing and compelling website, virtual walkthroughs, and, email marketing are the most important trends which are outlined in slide. Do you know about Slidesgeeks Latest Trends Associated With Real Estate Marketing Real Estate Property Marketing Professional Pdf These are perfect for delivering any kind od presentation. Using it, create PowerPoint presentations that communicate your ideas and engage audiences. Save time and effort by using our pre-designed presentation templates that are perfect for a wide range of topic. Our vast selection of designs covers a range of styles, from creative to business, and are all highly customizable and easy to edit. Download as a PowerPoint template or use them as Google Slides themes. The following slide outlines current trends which will assist realtors to grow their property business. High-performing and compelling website, virtual walkthroughs, and, email marketing are the most important trends which are outlined in slide.
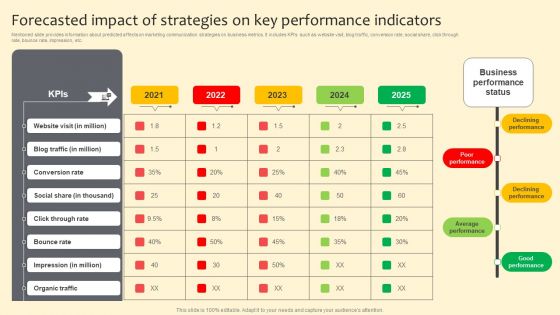
Forecasted Impact Of Strategies On Key Performance Indicators Slides PDF
Mentioned slide provides information about predicted affects on marketing communication strategies on business metrics. It includes KPIs such as website visit, blog traffic, conversion rate, social share, click through rate, bounce rate, impression, etc. Boost your pitch with our creative Forecasted Impact Of Strategies On Key Performance Indicators Slides PDF. Deliver an awe inspiring pitch that will mesmerize everyone. Using these presentation templates you will surely catch everyones attention. You can browse the ppts collection on our website. We have researchers who are experts at creating the right content for the templates. So you do not have to invest time in any additional work. Just grab the template now and use them.
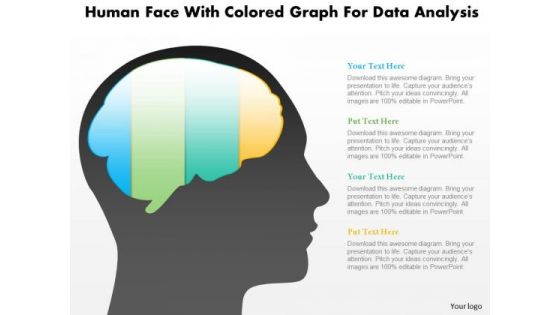
Business Diagram Human Face With Colored Graph For Data Analysis PowerPoint Slide
This diagram displays human face graphic with colored graph. This diagram can be used to represent strategy, planning, thinking of business plan. Display business options in your presentations by using this creative diagram.
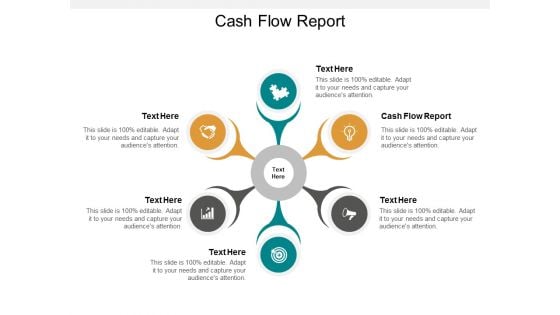
Cash Flow Report Ppt PowerPoint Presentation Outline Example Introduction Cpb
Presenting this set of slides with name cash flow report ppt powerpoint presentation outline example introduction cpb. This is a six stage process. The stages in this process are cash flow report. This is a completely editable PowerPoint presentation and is available for immediate download. Download now and impress your audience.
Magnifying Glass Ppt PowerPoint Presentation Professional Layout
Presenting this set of slides with name magnifying glass ppt powerpoint presentation professional layout. This is a four stage process. The stages in this process are magnifying glass. This is a completely editable PowerPoint presentation and is available for immediate download. Download now and impress your audience.
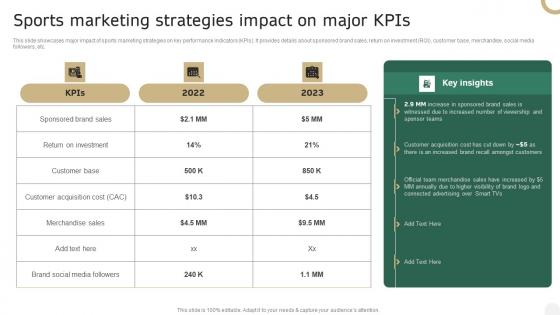
Sports Marketing Strategies Impact On Major Kpis In Depth Campaigning Guide Infographics PDF
This slide showcases major impact of sports marketing strategies on key performance indicators KPIs. It provides details about sponsored brand sales, return on investment ROI, customer base, merchandise, social media followers, etc. Present like a pro with Sports Marketing Strategies Impact On Major Kpis In Depth Campaigning Guide Infographics PDF Create beautiful presentations together with your team, using our easy-to-use presentation slides. Share your ideas in real-time and make changes on the fly by downloading our templates. So whether you are in the office, on the go, or in a remote location, you can stay in sync with your team and present your ideas with confidence. With Slidegeeks presentation got a whole lot easier. Grab these presentations today. This slide showcases major impact of sports marketing strategies on key performance indicators KPIs. It provides details about sponsored brand sales, return on investment ROI, customer base, merchandise, social media followers, etc.
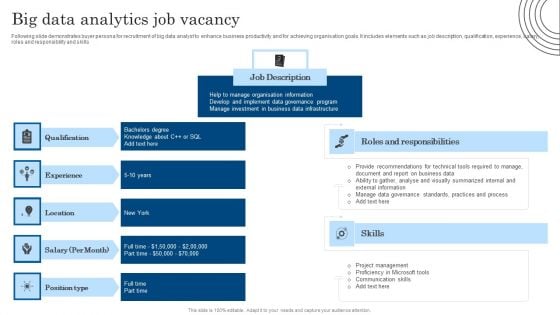
Big Data Analytics Job Vacancy Demonstration PDF
Following slide demonstrates buyer persona for recruitment of big data analyst to enhance business productivity and for achieving organisation goals. It includes elements such as job description, qualification, experience, salary, roles and responsibility and skills. Pitch your topic with ease and precision using this Big Data Analytics Job Vacancy Demonstration PDF. This layout presents information on Location, Information, Internal. It is also available for immediate download and adjustment. So, changes can be made in the color, design, graphics or any other component to create a unique layout.
Data Cloud Computing Migration Framework Icon Template Pdf
Showcasing this set of slides titled Data Cloud Computing Migration Framework Icon Template Pdf The topics addressed in these templates are Data Cloud Computing, Migration Framework Icon All the content presented in this PPT design is completely editable. Download it and make adjustments in color, background, font etc. as per your unique business setting. Our Data Cloud Computing Migration Framework Icon Template Pdf are topically designed to provide an attractive backdrop to any subject. Use them to look like a presentation pro.

Agenda Product Analytics Implementation For Enhanced Business Insights Data Analytics V
Find a pre-designed and impeccable Agenda Product Analytics Implementation For Enhanced Business Insights Data Analytics V. The templates can ace your presentation without additional effort. You can download these easy-to-edit presentation templates to make your presentation stand out from others. So, what are you waiting for Download the template from Slidegeeks today and give a unique touch to your presentation. Our Agenda Product Analytics Implementation For Enhanced Business Insights Data Analytics V are topically designed to provide an attractive backdrop to any subject. Use them to look like a presentation pro.


 Continue with Email

 Home
Home


