Dashboards Summary
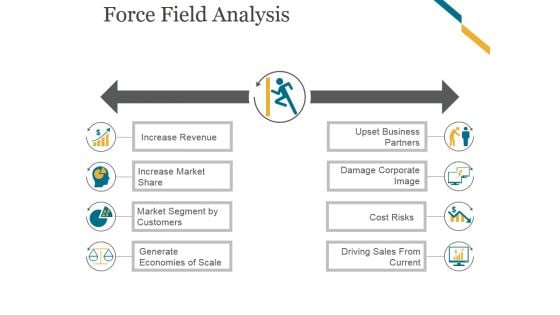
Force Field Analysis Template 1 Ppt PowerPoint Presentation Professional
This is a force field analysis template 1 ppt powerpoint presentation professional. This is a eight stage process. The stages in this process are increase revenue, increase market share, market segment by customers, generate economies of scale, upset business partners, damage corporate image, cost risks, driving sales from current.
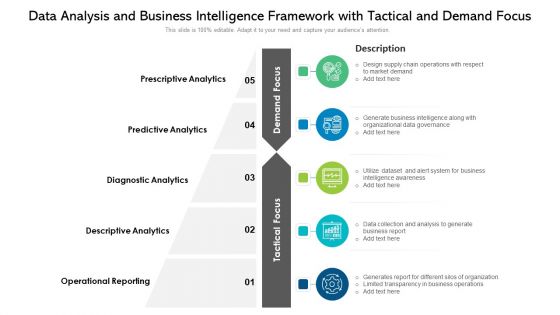
Data Analysis And Business Intelligence Framework With Tactical And Demand Focus Ppt PowerPoint Presentation Model Portfolio PDF
Persuade your audience using this data analysis and business intelligence framework with tactical and demand focus ppt powerpoint presentation model portfolio pdf. This PPT design covers five stages, thus making it a great tool to use. It also caters to a variety of topics including prescriptive analytics, diagnostic analytics, operational reporting. Download this PPT design now to present a convincing pitch that not only emphasizes the topic but also showcases your presentation skills.
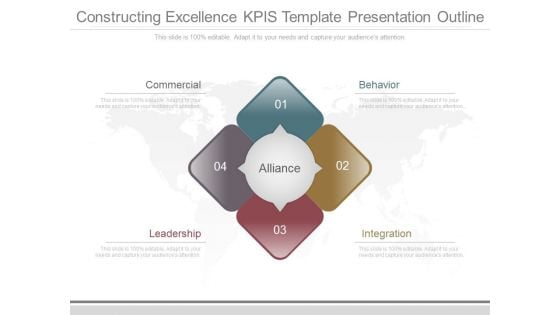
Constructing Excellence Kpis Template Presentation Outline
This is a constructing excellence kpis template presentation outline. This is a four stage process. The stages in this process are commercial, behavior, leadership, integration, alliance.
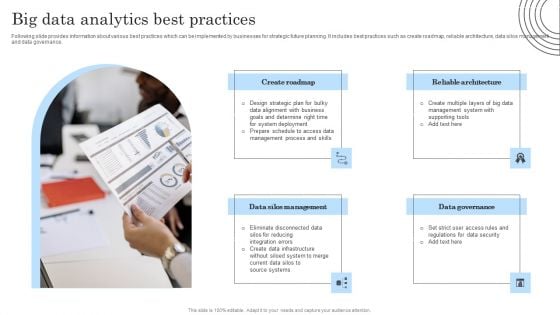
Big Data Analytics Best Practices Mockup PDF
Following slide provides information about various best practices which can be implemented by businesses for strategic future planning. It includes best practices such as create roadmap, reliable architecture, data silos management and data governance. Persuade your audience using this Big Data Analytics Best Practices Mockup PDF. This PPT design covers four stages, thus making it a great tool to use. It also caters to a variety of topics including Data Governance, Reliable Architecture, Data Silos Management. Download this PPT design now to present a convincing pitch that not only emphasizes the topic but also showcases your presentation skills.
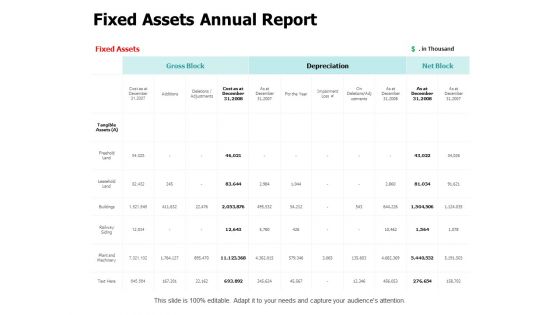
Fixed Assets Annual Report Ppt PowerPoint Presentation Outline Information
Presenting this set of slides with name fixed assets annual report ppt powerpoint presentation outline information. The topics discussed in these slides are business, management, planning, strategy, marketing. This is a completely editable PowerPoint presentation and is available for immediate download. Download now and impress your audience.
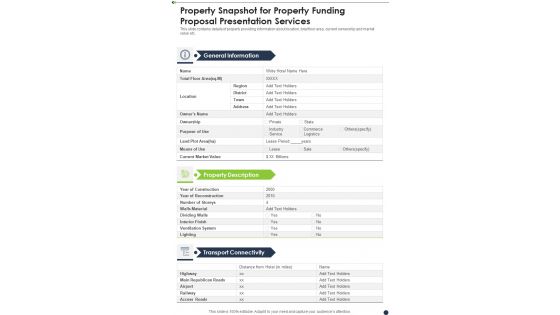
Property Snapshot For Property Funding Proposal Presentation Services One Pager Sample Example Document
This slide contains details of property providing information about location, total floor area, current ownership and market value etc. Presenting you an exemplary Property Snapshot For Property Funding Proposal Presentation Services One Pager Sample Example Document. Our one-pager comprises all the must-have essentials of an inclusive document. You can edit it with ease, as its layout is completely editable. With such freedom, you can tweak its design and other elements to your requirements. Download this Property Snapshot For Property Funding Proposal Presentation Services One Pager Sample Example Document brilliant piece now.
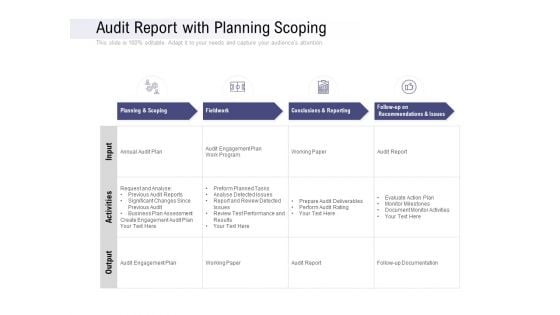
Audit Report With Planning Scoping Ppt PowerPoint Presentation Layouts Slideshow
Presenting this set of slides with name audit report with planning scoping ppt powerpoint presentation layouts slideshow. The topics discussed in these slides are planning and scoping, fieldwork, conclusions and reporting, recommendations and issues. This is a completely editable PowerPoint presentation and is available for immediate download. Download now and impress your audience.
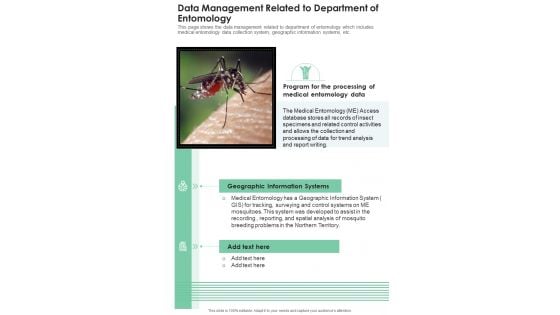
Data Management Related To Department Of Entomology One Pager Documents
This page shows the data management related to department of entomology which includes medical entomology data collection system, geographic information systems, etc. Presenting you an exemplary Data Management Related To Department Of Entomology One Pager Documents. Our one-pager comprises all the must-have essentials of an inclusive document. You can edit it with ease, as its layout is completely editable. With such freedom, you can tweak its design and other elements to your requirements. Download this Data Management Related To Department Of Entomology One Pager Documents brilliant piece now.
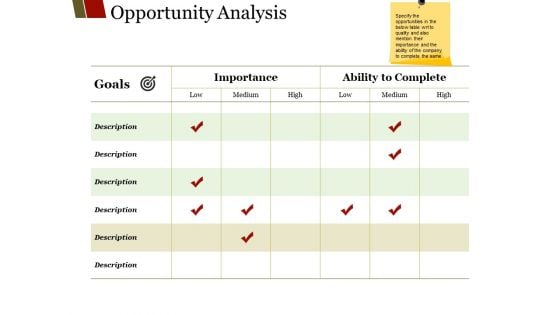
Opportunity Analysis Ppt PowerPoint Presentation Infographic Template Master Slide
This is a opportunity analysis ppt powerpoint presentation infographic template master slide. This is a six stage process. The stages in this process are description, importance, ability to complete, low, medium.
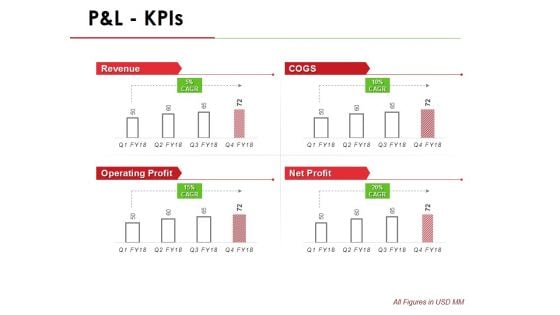
P And L Kpis Template 1 Ppt PowerPoint Presentation Infographic Template Outline
This is a p and l kpis template 1 ppt powerpoint presentation infographic template outline. This is a four stage process. The stages in this process are revenue, operating profit, cogs, net profit.
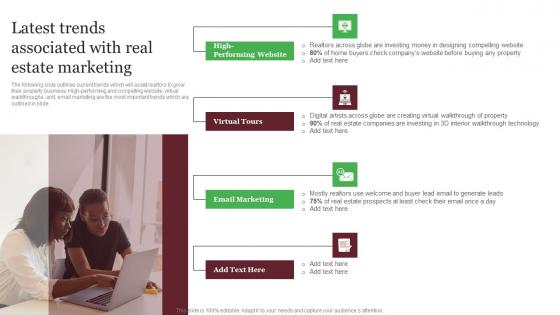
Latest Trends Associated With Real Estate Marketing Out Of The Box Real Information Pdf
The following slide outlines current trends which will assist realtors to grow their property business. High-performing and compelling website, virtual walkthroughs, and, email marketing are the most important trends which are outlined in slide. Do you know about Slidesgeeks Latest Trends Associated With Real Estate Marketing Out Of The Box Real Information Pdf These are perfect for delivering any kind od presentation. Using it, create PowerPoint presentations that communicate your ideas and engage audiences. Save time and effort by using our pre-designed presentation templates that are perfect for a wide range of topic. Our vast selection of designs covers a range of styles, from creative to business, and are all highly customizable and easy to edit. Download as a PowerPoint template or use them as Google Slides themes. The following slide outlines current trends which will assist realtors to grow their property business. High-performing and compelling website, virtual walkthroughs, and, email marketing are the most important trends which are outlined in slide.
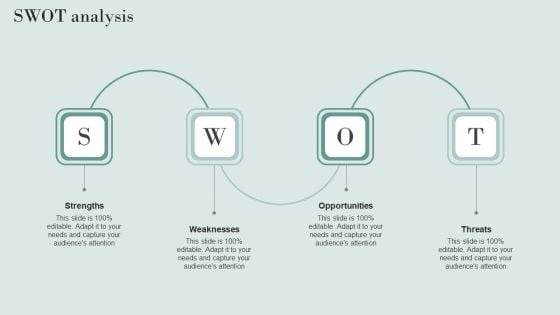
Data Structure IT Swot Analysis Diagrams PDF
Presenting this PowerPoint presentation, titled Data Structure IT Swot Analysis Diagrams PDF, with topics curated by our researchers after extensive research. This editable presentation is available for immediate download and provides attractive features when used. Download now and captivate your audience. Presenting this Data Structure IT Swot Analysis Diagrams PDF. Our researchers have carefully researched and created these slides with all aspects taken into consideration. This is a completely customizable Data Structure IT Swot Analysis Diagrams PDF that is available for immediate downloading. Download now and make an impact on your audience. Highlight the attractive features available with our PPTs.
Leader Analyzing Performance Kpis Vector Icon Ppt PowerPoint Presentation Infographic Template Slideshow PDF
Presenting leader analyzing performance KPIs vector icon ppt powerpoint presentation infographic template slideshow pdf to dispense important information. This template comprises three stages. It also presents valuable insights into the topics including leader analyzing performance kpis vector icon. This is a completely customizable PowerPoint theme that can be put to use immediately. So, download it and address the topic impactfully.
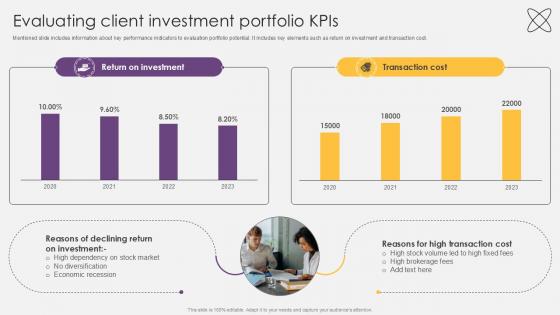
Evaluating Client Investment Portfolio KPIs Investment Fund PPT Presentation
Mentioned slide includes information about key performance indicators to evaluation portfolio potential.It includes key elements such as return on investment and transaction cost. Find highly impressive Evaluating Client Investment Portfolio KPIs Investment Fund PPT Presentation on Slidegeeks to deliver a meaningful presentation. You can save an ample amount of time using these presentation templates. No need to worry to prepare everything from scratch because Slidegeeks experts have already done a huge research and work for you. You need to download Evaluating Client Investment Portfolio KPIs Investment Fund PPT Presentation for your upcoming presentation. All the presentation templates are 100 percent editable and you can change the color and personalize the content accordingly. Download now Mentioned slide includes information about key performance indicators to evaluation portfolio potential.It includes key elements such as return on investment and transaction cost.

Magnifying Glass Technology Marketing Ppt Powerpoint Presentation Layouts Demonstration
This is a magnifying glass technology marketing ppt powerpoint presentation layouts demonstration. This is a three stage process. The stages in this process are magnifying glass, research, marketing, strategy, business.
Magnifying Glass Marketing Ppt Powerpoint Presentation Layouts Deck
This is a magnifying glass marketing ppt powerpoint presentation layouts deck. This is a two stage process. The stages in this process are magnifying glass, research, marketing, strategy, business.
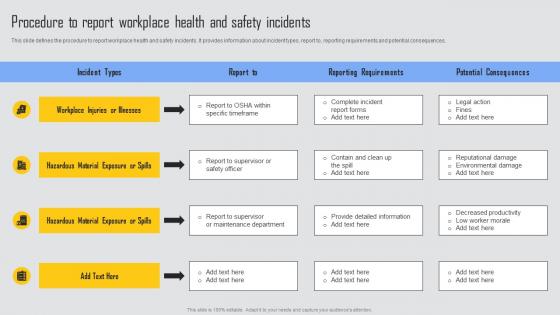
Procedure To Report Workplace Managing Risks And Establishing Trust Through Efficient Structure Pdf
This slide defines the procedure to report workplace health and safety incidents. It provides information about incident types, report to, reporting requirements and potential consequences. The Procedure To Report Workplace Managing Risks And Establishing Trust Through Efficient Structure Pdf is a compilation of the most recent design trends as a series of slides. It is suitable for any subject or industry presentation, containing attractive visuals and photo spots for businesses to clearly express their messages. This template contains a variety of slides for the user to input data, such as structures to contrast two elements, bullet points, and slides for written information. Slidegeeks is prepared to create an impression. This slide defines the procedure to report workplace health and safety incidents. It provides information about incident types, report to, reporting requirements and potential consequences.

Challenges And Solutions Associated With Text Analytics PPT Template SS
This slide outlines the challenges and solutions associated with text analytics, such as noisy, incomplete, inconsistent, complex data, data integration, etc. Are you in need of a template that can accommodate all of your creative concepts This one is crafted professionally and can be altered to fit any style. Use it with Google Slides or PowerPoint. Include striking photographs, symbols, depictions, and other visuals. Fill, move around, or remove text boxes as desired. Test out color palettes and font mixtures. Edit and save your work, or work with colleagues. Download Challenges And Solutions Associated With Text Analytics PPT Template SS and observe how to make your presentation outstanding. Give an impeccable presentation to your group and make your presentation unforgettable. This slide outlines the challenges and solutions associated with text analytics, such as noisy, incomplete, inconsistent, complex data, data integration, etc.
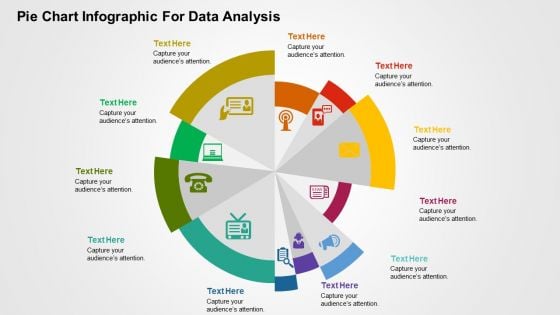
Pie Chart Infographic For Data Analysis PowerPoint Templates
This is one of the most downloaded PowerPoint template. This slide can be used for various purposes and to explain a number of processes. This can be included in your presentation to explain each step of a process and even include its relevance and importance in a single diagram. Using the uneven circular structure of the pie chart, the presenter can also explain random steps or highlight particular steps of process or parts of an organization or business that need special attention of any kind to the audience. Additionally, you can use this slide to show a transformation process or highlight key features of a product.
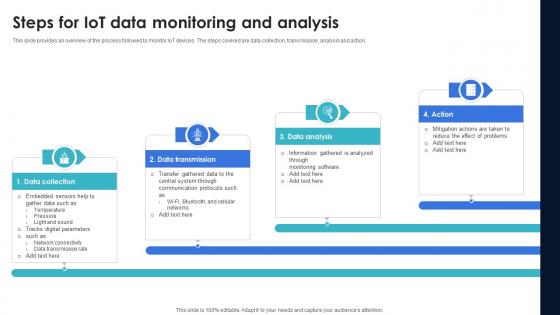
Optimization Of IoT Remote Monitoring Steps For IoT Data Monitoring And Analysis IoT SS V
This slide provides an overview of the process followed to monitor IoT devices. The steps covered are data collection, transmission, analysis and action. Want to ace your presentation in front of a live audience Our Optimization Of IoT Remote Monitoring Steps For IoT Data Monitoring And Analysis IoT SS V can help you do that by engaging all the users towards you. Slidegeeks experts have put their efforts and expertise into creating these impeccable powerpoint presentations so that you can communicate your ideas clearly. Moreover, all the templates are customizable, and easy-to-edit and downloadable. Use these for both personal and commercial use. This slide provides an overview of the process followed to monitor IoT devices. The steps covered are data collection, transmission, analysis and action.
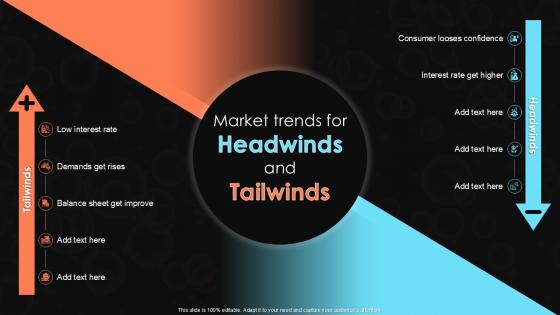
Market Trends For Headwinds And Tailwinds
Presenting this PowerPoint presentation, titled Market Trends For Headwinds And Tailwinds, with topics curated by our researchers after extensive research. This editable presentation is available for immediate download and provides attractive features when used. Download now and captivate your audience. Presenting this Market Trends For Headwinds And Tailwinds. Our researchers have carefully researched and created these slides with all aspects taken into consideration. This is a completely customizable Market Trends For Headwinds And Tailwinds that is available for immediate downloading. Download now and make an impact on your audience. Highlight the attractive features available with our PPTs. Our Headwinds and Tailwinds Market Trends for PowerPoint templates offer you an opportunity to explain and discuss the headwinds as regulatory challenges or market downturns, which create a kind of resistance in a firms efforts, while tailwinds can be related to economic growth or new technologies emerging, all presented through visual, effective, and short content. These slides are perfect for stakeholders, investors, or strategic discussions and bring clarity with efficiency to enhance your presentations while ensuring that your insights stand out.
Website Performance Report Icon With Data Download PDF
Persuade your audience using this Website Performance Report Icon With Data Download PDF. This PPT design covers four stages, thus making it a great tool to use. It also caters to a variety of topics including Website Performance Report Icon With Data. Download this PPT design now to present a convincing pitch that not only emphasizes the topic but also showcases your presentation skills.
Transformation Toolkit Competitive Intelligence Information Analysis Vendor Data Profile For Data Analytics Software Icons PDF
This slide represents the list of vendors along with accompanying information including the key features, pros and cons of each vendor software. Slidegeeks is here to make your presentations a breeze with Transformation Toolkit Competitive Intelligence Information Analysis Vendor Data Profile For Data Analytics Software Icons PDF With our easy to use and customizable templates, you can focus on delivering your ideas rather than worrying about formatting. With a variety of designs to choose from, you are sure to find one that suits your needs. And with animations and unique photos, illustrations, and fonts, you can make your presentation pop. So whether you are giving a sales pitch or presenting to the board, make sure to check out Slidegeeks first.
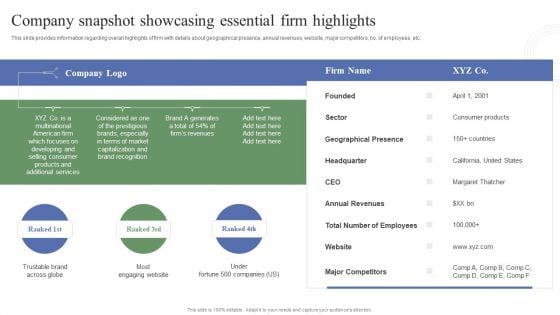
Toolkit To Administer Tactical Company Snapshot Showcasing Essential Firm Highlights Template PDF
This slide provides information regarding overall highlights of firm with details about geographical presence, annual revenues, website, major competitors, no. of employees, etc. Do you have to make sure that everyone on your team knows about any specific topic I yes, then you should give Toolkit To Administer Tactical Company Snapshot Showcasing Essential Firm Highlights Template PDF a try. Our experts have put a lot of knowledge and effort into creating this impeccable Toolkit To Administer Tactical Company Snapshot Showcasing Essential Firm Highlights Template PDF. You can use this template for your upcoming presentations, as the slides are perfect to represent even the tiniest detail. You can download these templates from the Slidegeeks website and these are easy to edit. So grab these today.
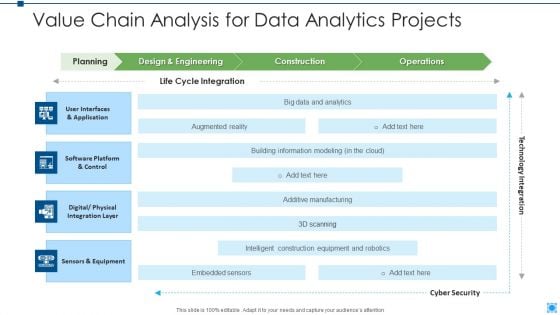
Value Chain Analysis For Data Analytics Projects Rules PDF
Pitch your topic with ease and precision using this value chain analysis for data analytics projects rules pdf. This layout presents information on planning, design and engineering, construction, operations. It is also available for immediate download and adjustment. So, changes can be made in the color, design, graphics or any other component to create a unique layout.
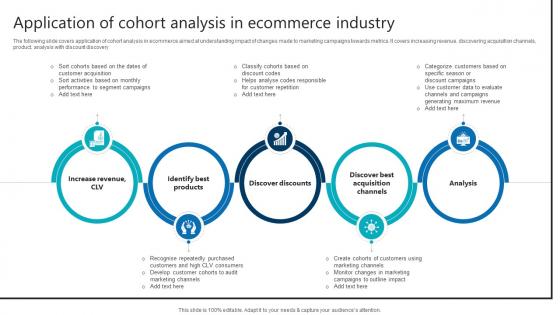
Application Of Cohort Analysis In Ecommerce Industry Product Analytics Implementation Data Analytics V
The following slide covers application of cohort analysis in ecommerce aimed at understanding impact of changes made to marketing campaigns towards metrics. It covers increasing revenue, discovering acquisition channels, product, analysis with discount discovery Boost your pitch with our creative Application Of Cohort Analysis In Ecommerce Industry Product Analytics Implementation Data Analytics V. Deliver an awe-inspiring pitch that will mesmerize everyone. Using these presentation templates you will surely catch everyones attention. You can browse the ppts collection on our website. We have researchers who are experts at creating the right content for the templates. So you do not have to invest time in any additional work. Just grab the template now and use them. The following slide covers application of cohort analysis in ecommerce aimed at understanding impact of changes made to marketing campaigns towards metrics. It covers increasing revenue, discovering acquisition channels, product, analysis with discount discovery

How To Create Cost Effective Kpis To Measure Effectiveness Of Facebook Strategy SS V
The following slide outlines key performance indicators KPI through which marketers can analyze impact of Facebook ads. The key metrics mentioned in slide are likes, shares, comments, click-through rate CTR, cost per conversion CPV, conversion rate, new followers, reach, and brand impressions. Find a pre-designed and impeccable How To Create Cost Effective Kpis To Measure Effectiveness Of Facebook Strategy SS V. The templates can ace your presentation without additional effort. You can download these easy-to-edit presentation templates to make your presentation stand out from others. So, what are you waiting for Download the template from Slidegeeks today and give a unique touch to your presentation. The following slide outlines key performance indicators KPI through which marketers can analyze impact of Facebook ads. The key metrics mentioned in slide are likes, shares, comments, click-through rate CTR, cost per conversion CPV, conversion rate, new followers, reach, and brand impressions.

Facebook Marketing Techniques Kpis To Measure Effectiveness Of Facebook Ad Strategy SS V
The following slide outlines key performance indicators KPI through which marketers can analyze impact of Facebook ads. The key metrics mentioned in slide are likes, shares, comments, click-through rate CTR , cost per conversion CPV , conversion rate, new followers, reach, and brand impressions. Find a pre-designed and impeccable Facebook Marketing Techniques Kpis To Measure Effectiveness Of Facebook Ad Strategy SS V. The templates can ace your presentation without additional effort. You can download these easy-to-edit presentation templates to make your presentation stand out from others. So, what are you waiting for Download the template from Slidegeeks today and give a unique touch to your presentation. The following slide outlines key performance indicators KPI through which marketers can analyze impact of Facebook ads. The key metrics mentioned in slide are likes, shares, comments, click-through rate CTR , cost per conversion CPV , conversion rate, new followers, reach, and brand impressions.
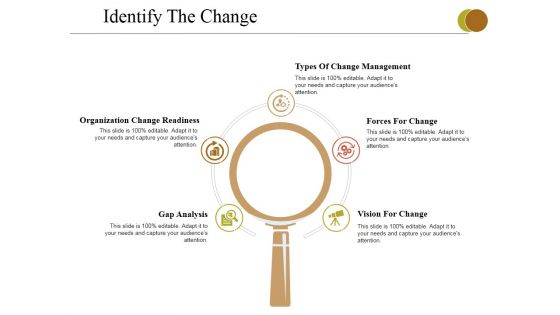
Identify The Change Ppt PowerPoint Presentation Slides Graphics Pictures
This is a identify the change ppt powerpoint presentation slides graphics pictures. This is a five stage process. The stages in this process are organization change readiness, gap analysis, types of change management, forces for change, vision for change.
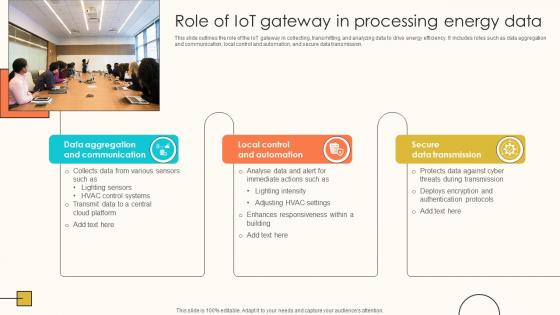
Role Of IoT Gateway In Processing Energy Data Internet Of Things Solutions To Enhance Energy IoT SS V
This slide outlines the role of the IoT gateway in collecting, transmitting, and analyzing data to drive energy efficiency. It includes roles such as data aggregation and communication, local control and automation, and secure data transmission. Do you know about Slidesgeeks Role Of IoT Gateway In Processing Energy Data Internet Of Things Solutions To Enhance Energy IoT SS V These are perfect for delivering any kind od presentation. Using it, create PowerPoint presentations that communicate your ideas and engage audiences. Save time and effort by using our pre-designed presentation templates that are perfect for a wide range of topic. Our vast selection of designs covers a range of styles, from creative to business, and are all highly customizable and easy to edit. Download as a PowerPoint template or use them as Google Slides themes. This slide outlines the role of the IoT gateway in collecting, transmitting, and analyzing data to drive energy efficiency. It includes roles such as data aggregation and communication, local control and automation, and secure data transmission.
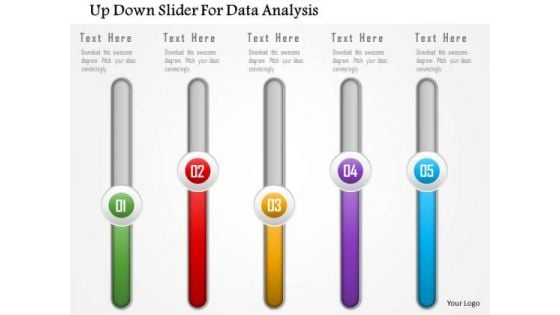
Business Diagram Up Down Slider For Data Analysis Presentation Template
This business diagram has been designed with graphics of slider. You may download this professional slide to display data trends. Transmit your thoughts via this slide.
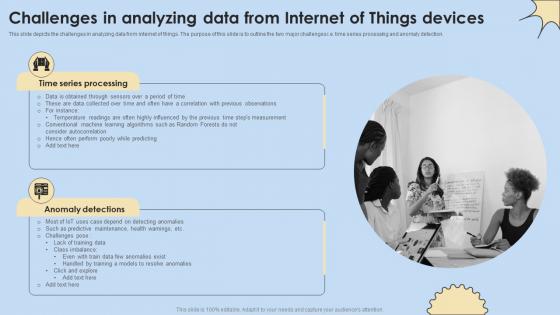
Challenges In Analyzing Data From Internet Of Things Internet Of Things Analysis Elements Pdf
This slide depicts the challenges in analyzing data from internet of things. The purpose of this slide is to outline the two major challenges i.e. time series processing and anomaly detection. Find highly impressive Challenges In Analyzing Data From Internet Of Things Internet Of Things Analysis Elements Pdf on Slidegeeks to deliver a meaningful presentation. You can save an ample amount of time using these presentation templates. No need to worry to prepare everything from scratch because Slidegeeks experts have already done a huge research and work for you. You need to download Challenges In Analyzing Data From Internet Of Things Internet Of Things Analysis Elements Pdf for your upcoming presentation. All the presentation templates are 100 percent editable and you can change the color and personalize the content accordingly. Download now. This slide depicts the challenges in analyzing data from internet of things. The purpose of this slide is to outline the two major challenges i.e. time series processing and anomaly detection.

Data Analytics Management Why Big Data Management Is Important Elements PDF
This slide depicts the importance of big data and how collected data will help organizations in cost-saving, time savings, new product launching, and decision making.Presenting Data Analytics Management Why Big Data Management Is Important Elements PDF to provide visual cues and insights. Share and navigate important information on four stages that need your due attention. This template can be used to pitch topics like Analysis Collected, Business Models, Allowing Discover. In addtion, this PPT design contains high resolution images, graphics, etc, that are easily editable and available for immediate download.
Magnifying Glass Ppt PowerPoint Presentation Infographic Template Clipart
This is a magnifying glass ppt powerpoint presentation infographic template clipart. This is a one stage process. The stages in this process are magnifier glass, research, business, marketing, focus.
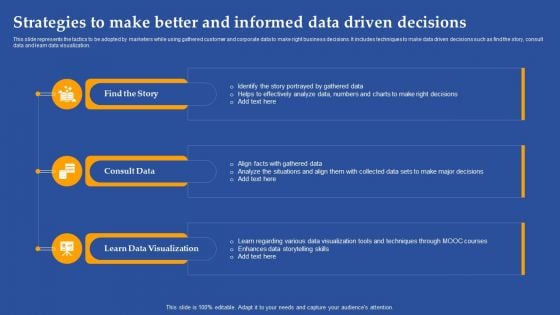
Strategies To Make Better And Informed Data Driven Decisions Ppt Outline Examples PDF
This slide represents the tactics to be adopted by marketers while using gathered customer and corporate data to make right business decisions. It includes techniques to make data driven decisions such as find the story, consult data and learn data visualization. Presenting this PowerPoint presentation, titled Strategies To Make Better And Informed Data Driven Decisions Ppt Outline Examples PDF, with topics curated by our researchers after extensive research. This editable presentation is available for immediate download and provides attractive features when used. Download now and captivate your audience. Presenting this Strategies To Make Better And Informed Data Driven Decisions Ppt Outline Examples PDF. Our researchers have carefully researched and created these slides with all aspects taken into consideration. This is a completely customizable Strategies To Make Better And Informed Data Driven Decisions Ppt Outline Examples PDF that is available for immediate downloading. Download now and make an impact on your audience. Highlight the attractive features available with our PPTs.
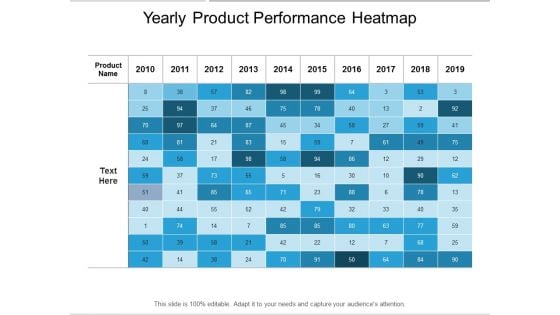
Yearly Product Performance Heatmap Ppt PowerPoint Presentation Outline Shapes
Presenting this set of slides with name yearly product performance heatmap ppt powerpoint presentation outline shapes. The topics discussed in these slides are heat map, data analytics, business quarterly. This is a completely editable PowerPoint presentation and is available for immediate download. Download now and impress your audience.

Impact Of Efficient Survey Analysis On Better Decision Making Inspiration PDF
Persuade your audience using this Impact Of Efficient Survey Analysis On Better Decision Making Inspiration PDF. This PPT design covers three stages, thus making it a great tool to use. It also caters to a variety of topics including Impact Of Efficient, Survey Analysis. Download this PPT design now to present a convincing pitch that not only emphasizes the topic but also showcases your presentation skills.
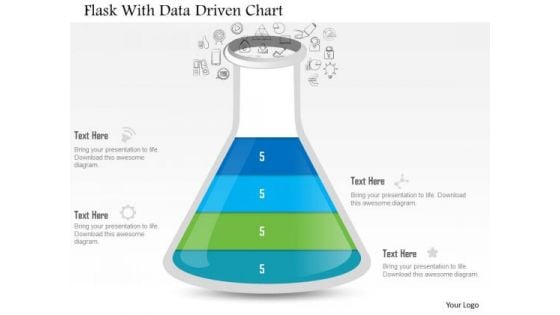
Business Diagram Flask With Data Driven Chart PowerPoint Slide
This data driven diagram has been designed with flask graphics. Download this diagram to give your presentations more effective look. It helps in clearly conveying your message to clients and audience.
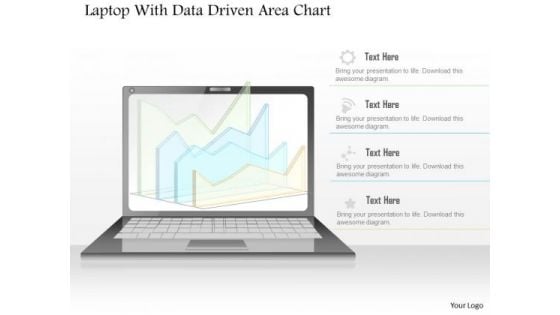
Business Diagram Laptop With Data Driven Area Chart PowerPoint Slide
This diagram has been designed with laptop and data driven area chart. Download this diagram to give your presentations more effective look. It helps in clearly conveying your message to clients and audience.
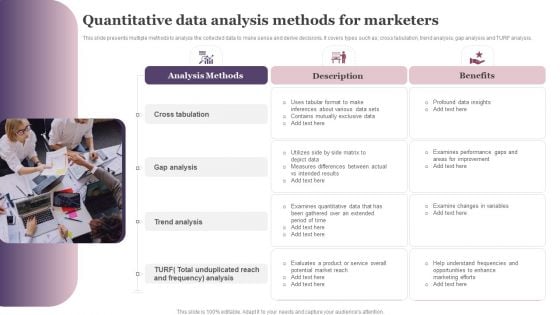
Quantitative Data Analysis Methods For Marketers Ppt Pictures Aids PDF
This slide presents multiple methods to analyze the collected data to make sense and derive decisions. It covers types such as, cross tabulation, trend analysis, gap analysis and TURF analysis. Presenting Quantitative Data Analysis Methods For Marketers Ppt Pictures Aids PDF to dispense important information. This template comprises three stages. It also presents valuable insights into the topics including Cross Tabulation, Gap Analysis, Trend Analysis. This is a completely customizable PowerPoint theme that can be put to use immediately. So, download it and address the topic impactfully.

Strategic Market Insight Implementation Guide Overview Of Sentiment Analysis Method For Data Evaluation Slides PDF
The following slide provides on overview of text and sentiment analysis as a method of data assessment in market intelligence. It also highlights various types such as standard sentiment analysis, fine grained sentiment analysis, emotion detection, aspect based sentiment analysis and intent detection. Find a pre designed and impeccable Strategic Market Insight Implementation Guide Overview Of Sentiment Analysis Method For Data Evaluation Slides PDF. The templates can ace your presentation without additional effort. You can download these easy to edit presentation templates to make your presentation stand out from others. So, what are you waiting for Download the template from Slidegeeks today and give a unique touch to your presentation.
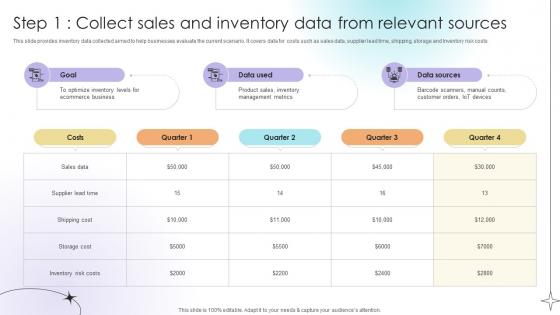
Step 1 Collect Sales And Inventory Data From Relevant Sources Data Analytics SS V
This slide provides inventory data collected aimed to help businesses evaluate the current scenario. It covers data for costs such as sales data, supplier lead time, shipping, storage and Inventory risk costs.Are you in need of a template that can accommodate all of your creative concepts This one is crafted professionally and can be altered to fit any style. Use it with Google Slides or PowerPoint. Include striking photographs, symbols, depictions, and other visuals. Fill, move around, or remove text boxes as desired. Test out color palettes and font mixtures. Edit and save your work, or work with colleagues. Download Step 1 Collect Sales And Inventory Data From Relevant Sources Data Analytics SS V and observe how to make your presentation outstanding. Give an impeccable presentation to your group and make your presentation unforgettable. This slide provides inventory data collected aimed to help businesses evaluate the current scenario. It covers data for costs such as sales data, supplier lead time, shipping, storage and Inventory risk costs.
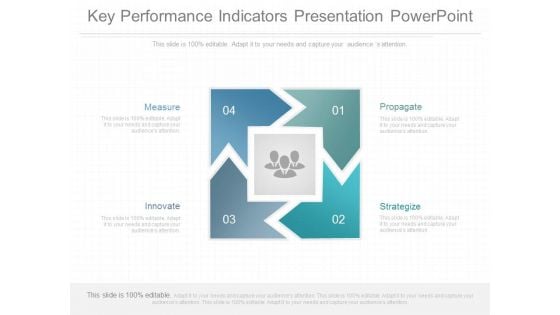
Key Performance Indicators Presentation Powerpoint
This is a key performance indicators presentation powerpoint. This is a four stage process. The stages in this process are measure, innovate, propagate, strategize.
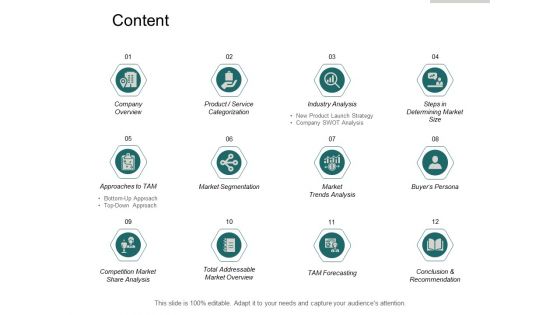
Content Big Data Ppt PowerPoint Presentation Outline Graphics Download
Presenting this set of slides with name content big data ppt powerpoint presentation outline graphics download. The topics discussed in these slides are marketing, business, management, planning, strategye. This is a completely editable PowerPoint presentation and is available for immediate download. Download now and impress your audience.
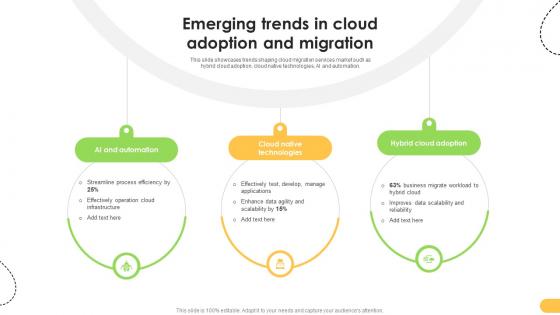
Emerging Trends In Cloud Adoption And Migration Data Migration From On Premises
This slide showcases trends shaping cloud migration services market such as hybrid cloud adoption, cloud native technologies, AI and automation. Crafting an eye-catching presentation has never been more straightforward. Let your presentation shine with this tasteful yet straightforward Emerging Trends In Cloud Adoption And Migration Data Migration From On Premises template. It offers a minimalistic and classy look that is great for making a statement. The colors have been employed intelligently to add a bit of playfulness while still remaining professional. Construct the ideal Emerging Trends In Cloud Adoption And Migration Data Migration From On Premises that effortlessly grabs the attention of your audience Begin now and be certain to wow your customers This slide showcases trends shaping cloud migration services market such as hybrid cloud adoption, cloud native technologies, AI and automation.
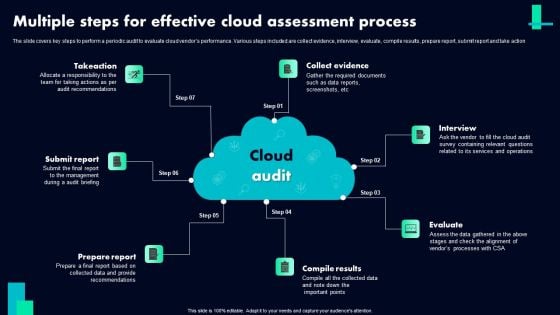
Multiple Steps For Effective Cloud Assessment Process Ppt Model Graphic Tips PDF
The slide covers key steps to perform a periodic audit to evaluate cloud vendors performance. Various steps included are collect evidence, interview, evaluate, compile results, prepare report, submit report and take action. Persuade your audience using this Multiple Steps For Effective Cloud Assessment Process Ppt Model Graphic Tips PDF. This PPT design covers seven stages, thus making it a great tool to use. It also caters to a variety of topics including Takeaction, Collect Evidence, Interview, Evaluate, Compile Results. Download this PPT design now to present a convincing pitch that not only emphasizes the topic but also showcases your presentation skills.
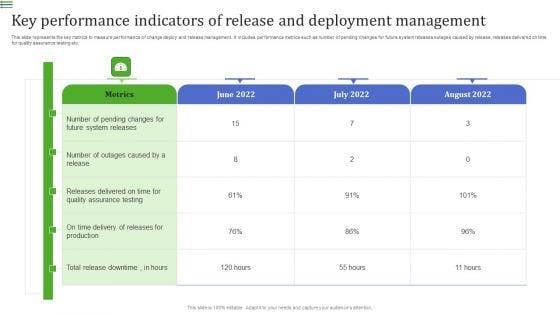
Key Performance Indicators Of Release And Deployment Management Demonstration PDF
This slide represents the key metrics to measure performance of change deploy and release management. It includes performance metrics such as number of pending changes for future system releases outages caused by release, releases delivered on time for quality assurance testing etc.Pitch your topic with ease and precision using this Key Performance Indicators Of Release And Deployment Management Demonstration PDF. This layout presents information on System Releases, Assurance Testing, Outages Caused. It is also available for immediate download and adjustment. So, changes can be made in the color, design, graphics or any other component to create a unique layout.

Determinants Of Product Quality Ppt PowerPoint Presentation Infographic Template Files
This is a determinants of product quality ppt powerpoint presentation infographic template files. This is a seven stage process. The stages in this process are performance, reliability, durability, evaluation, safety.
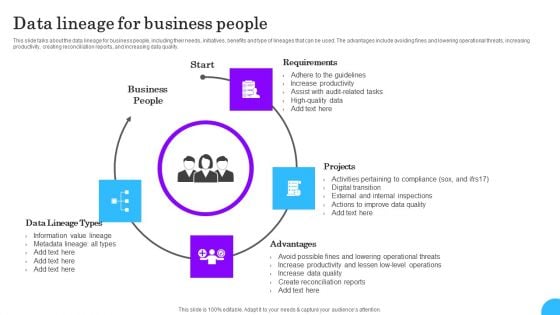
Comprehensive Analysis Of Different Data Lineage Classification Data Lineage For Business People Introduction PDF
This slide talks about the data lineage for business people, including their needs, initiatives, benefits and type of lineages that can be used. The advantages include avoiding fines and lowering operational threats, increasing productivity, creating reconciliation reports, and increasing data quality. If you are looking for a format to display your unique thoughts, then the professionally designed Comprehensive Analysis Of Different Data Lineage Classification Data Lineage For Business People Introduction PDF is the one for you. You can use it as a Google Slides template or a PowerPoint template. Incorporate impressive visuals, symbols, images, and other charts. Modify or reorganize the text boxes as you desire. Experiment with shade schemes and font pairings. Alter, share or cooperate with other people on your work. Download Comprehensive Analysis Of Different Data Lineage Classification Data Lineage For Business People Introduction PDF and find out how to give a successful presentation. Present a perfect display to your team and make your presentation unforgettable.
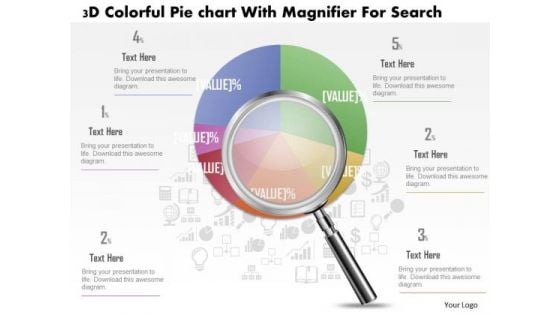
Business Diagram 3d Colorful Pie Graph With Magnifier Data Search PowerPoint Slide
This business slide displays 3d colorful pie graph with magnifier. This diagram is a data visualization tool that gives you a simple way to present statistical information. This slide helps your audience examine and interpret the data you present.

Business Diagram Data Driven Pie Chart Inside The Magnifier PowerPoint Slide
This business slide displays 3d colorful pie graph with magnifier. This diagram is a data visualization tool that gives you a simple way to present statistical information. This slide helps your audience examine and interpret the data you present.
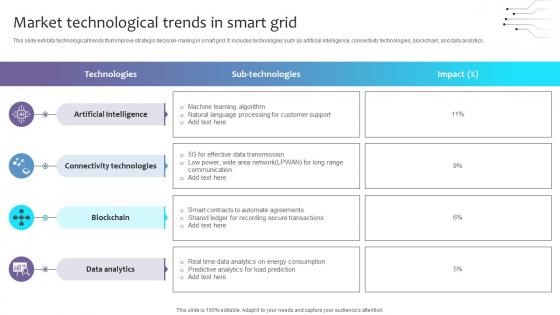
Empowering The Future Market Technological Trends In Smart Grid IoT SS V
This slide exhibits technological trends that improve strategic decision-making in smart grid. It includes technologies such as artificial intelligence, connectivity technologies, blockchain, and data analytics. Whether you have daily or monthly meetings, a brilliant presentation is necessary. Empowering The Future Market Technological Trends In Smart Grid IoT SS V can be your best option for delivering a presentation. Represent everything in detail using Empowering The Future Market Technological Trends In Smart Grid IoT SS V and make yourself stand out in meetings. The template is versatile and follows a structure that will cater to your requirements. All the templates prepared by Slidegeeks are easy to download and edit. Our research experts have taken care of the corporate themes as well. So, give it a try and see the results. This slide exhibits technological trends that improve strategic decision-making in smart grid. It includes technologies such as artificial intelligence, connectivity technologies, blockchain, and data analytics.

ROI Calculation Ppt PowerPoint Presentation Complete Deck With Slides
This is a roi calculation ppt powerpoint presentation complete deck with slides. This is a one stage process. The stages in this process are business, planning, strategy, marketing, management.
Website Data Report Icon With Monthly Traffic Performance Brochure PDF
Persuade your audience using this Website Data Report Icon With Monthly Traffic Performance Brochure PDF. This PPT design covers four stages, thus making it a great tool to use. It also caters to a variety of topics including Website Data Report Icon With Monthly Traffic Performance. Download this PPT design now to present a convincing pitch that not only emphasizes the topic but also showcases your presentation skills.
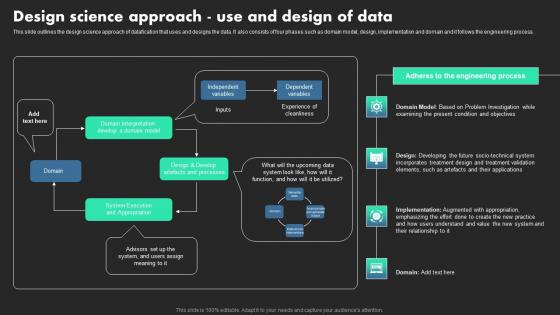
Design Science Approach Use And Design Of Data Ethical Dimensions Of Datafication Brochure Pdf
This slide outlines the design science approach of datafication that uses and designs the data. It also consists of four phases such as domain model, design, implementation and domain and it follows the engineering process. Coming up with a presentation necessitates that the majority of the effort goes into the content and the message you intend to convey. The visuals of a PowerPoint presentation can only be effective if it supplements and supports the story that is being told. Keeping this in mind our experts created Design Science Approach Use And Design Of Data Ethical Dimensions Of Datafication Brochure Pdf to reduce the time that goes into designing the presentation. This way, you can concentrate on the message while our designers take care of providing you with the right template for the situation. This slide outlines the design science approach of datafication that uses and designs the data. It also consists of four phases such as domain model, design, implementation and domain and it follows the engineering process.
CSR Report On Employees Statistics During Pandemic Icons PDF
This slide illustrates data related to CSR human resources of a corporation. It includes global employees, dough-nut chart of North American employees, global employees by age etc. Showcasing this set of slides titled CSR Report On Employees Statistics During Pandemic Icons PDF. The topics addressed in these templates are Global Employees, Supporting Workforce Transformation, Employees Statistics During Pandemic. All the content presented in this PPT design is completely editable. Download it and make adjustments in color, background, font etc. as per your unique business setting.
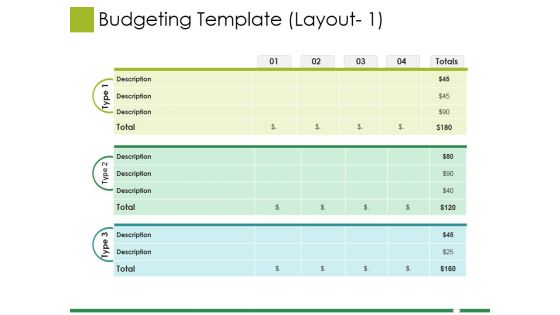
Budgeting Template Ppt PowerPoint Presentation Show Template
This is a budgeting template ppt powerpoint presentation show template. This is a three stage process. The stages in this process are business, marketing, finance, planning, tables.
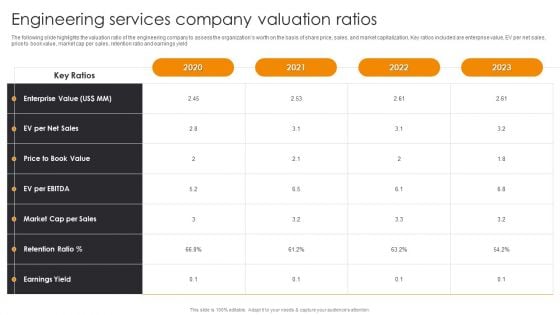
Engineering Services Company Valuation Ratios Engineering Company Financial Analysis Report Brochure PDF
The following slide highlights the valuation ratio of the engineering company to assess the organizations worth on the basis of share price, sales, and market capitalization, Key ratios included are enterprise value, EV per net sales, price to book value, market cap per sales, retention ratio and earnings yield. The Engineering Services Company Valuation Ratios Engineering Company Financial Analysis Report Brochure PDF is a compilation of the most recent design trends as a series of slides. It is suitable for any subject or industry presentation, containing attractive visuals and photo spots for businesses to clearly express their messages. This template contains a variety of slides for the user to input data, such as structures to contrast two elements, bullet points, and slides for written information. Slidegeeks is prepared to create an impression.
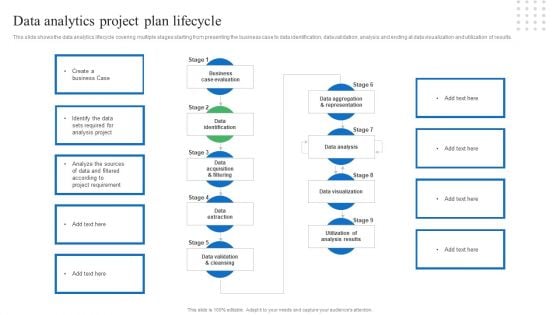
Toolkit For Data Science And Analytics Transition Data Analytics Project Plan Lifecycle Introduction PDF
The slide outline the key steps for data analytics methodology. It initiates with defining business objectives to data understanding, modelling and ends at data visualization and presentation. From laying roadmaps to briefing everything in detail, our templates are perfect for you. You can set the stage with your presentation slides. All you have to do is download these easy to edit and customizable templates. Toolkit For Data Science And Analytics Transition Data Analytics Project Plan Lifecycle Introduction PDF will help you deliver an outstanding performance that everyone would remember and praise you for. Do download this presentation today.

Market Competitiveness Template 1 Ppt PowerPoint Presentation Slides Template
This is a market competitiveness template 1 ppt powerpoint presentation slides template. This is a three stage process. The stages in this process are financial position, advertising, market share, brand image, customer loyalty.


 Continue with Email

 Home
Home


