Dashboards Summary
Functional Data Analysis To Predict Stock Market Trends Ppt PowerPoint Presentation Pictures Graphic Tips
Presenting this set of slides with name functional data analysis to predict stock market trends ppt powerpoint presentation pictures graphic tips. This is a one stage process. The stages in this process are functional data analysis to predict stock market trends. This is a completely editable PowerPoint presentation and is available for immediate download. Download now and impress your audience.
Data Analytics Ppt PowerPoint Presentation Icon Master Slide
This is a data analytics ppt powerpoint presentation icon master slide. This is a five stage process. The stages in this process are bar graph, growth, success, business, marketing.
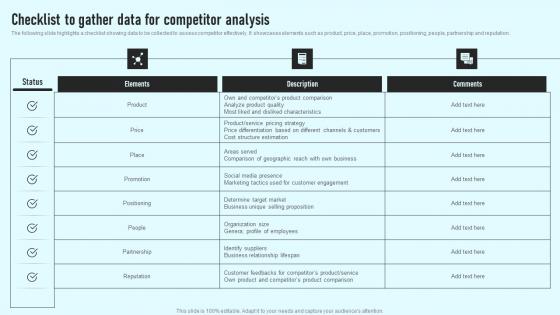
Checklist To Gather Data For Competitor Analysis Comprehensive Guide Designs Pdf
The following slide highlights a checklist showing data to be collected to assess competitor effectively. It showcases elements such as product, price, place, promotion, positioning, people, partnership and reputation. Present like a pro with Checklist To Gather Data For Competitor Analysis Comprehensive Guide Designs Pdf Create beautiful presentations together with your team, using our easy-to-use presentation slides. Share your ideas in real-time and make changes on the fly by downloading our templates. So whether you are in the office, on the go, or in a remote location, you can stay in sync with your team and present your ideas with confidence. With Slidegeeks presentation got a whole lot easier. Grab these presentations today. The following slide highlights a checklist showing data to be collected to assess competitor effectively. It showcases elements such as product, price, place, promotion, positioning, people, partnership and reputation.
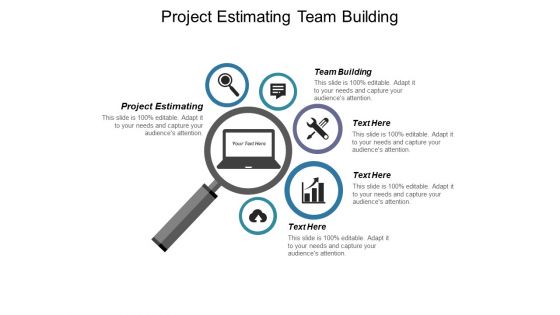
Project Estimating Team Building Ppt PowerPoint Presentation File Design Ideas
This is a project estimating team building ppt powerpoint presentation file design ideas. This is a five stage process. The stages in this process are project, estimating, team, building.
Icons Slide For Data Analytics For Informed Decision Making Ppt PowerPoint
Introducing our well designed Icons Slide For Data Analytics For Informed Decision Making Ppt PowerPoint set of slides. The slide displays editable icons to enhance your visual presentation. The icons can be edited easily. So customize according to your business to achieve a creative edge. Download and share it with your audience. Our Icons Slide For Data Analytics For Informed Decision Making Ppt PowerPoint are topically designed to provide an attractive backdrop to any subject. Use them to look like a presentation pro.
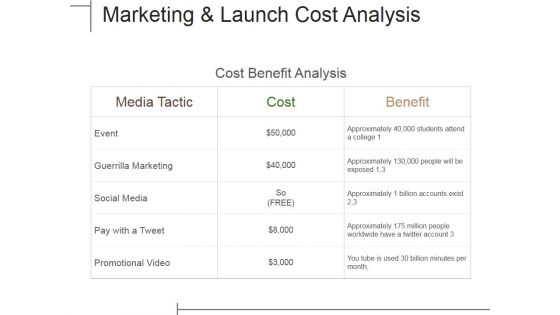
Marketing And Launch Cost Analysis Ppt PowerPoint Presentation Portfolio Good
This is a marketing and launch cost analysis ppt powerpoint presentation portfolio good. This is a three stage process. The stages in this process are media tactic, cost, benefit, event, guerrilla marketing.

Marketing And Launch Cost Analysis Ppt PowerPoint Presentation Gallery Slides
This is a marketing and launch cost analysis ppt powerpoint presentation gallery slides. This is a six stage process. The stages in this process are media tactic, event, guerrilla marketing, social media, pay with a tweet.
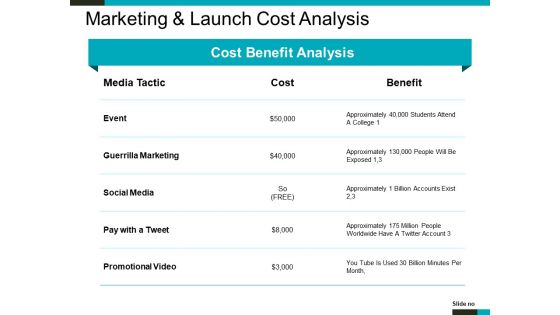
Marketing And Launch Cost Analysis Ppt PowerPoint Presentation Portfolio Structure
This is a marketing and launch cost analysis ppt powerpoint presentation portfolio structure. This is a three stage process. The stages in this process are event, guerrilla marketing, social media, pay with a tweet, promotional video.
Marketing Data Source Icons Slide Ppt PowerPoint Presentation Outline Clipart
Presenting this set of slides with name marketing data source icons slide ppt powerpoint presentation outline clipart. The topics discussed in these slides are marketing, business, management, planning, strategy. This is a completely editable PowerPoint presentation and is available for immediate download. Download now and impress your audience.
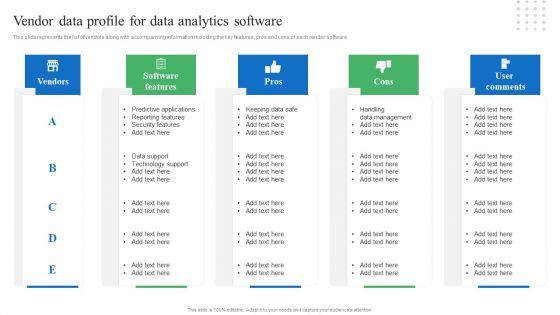
Toolkit For Data Science And Analytics Transition Vendor Data Profile For Data Analytics Software Infographics PDF
This slide represents the list of vendors along with accompanying information including the key features, pros and cons of each vendor software. If your project calls for a presentation, then Slidegeeks is your go to partner because we have professionally designed, easy to edit templates that are perfect for any presentation. After downloading, you can easily edit Toolkit For Data Science And Analytics Transition Vendor Data Profile For Data Analytics Software Infographics PDF and make the changes accordingly. You can rearrange slides or fill them with different images. Check out all the handy templates.
Data Analytics For Informed Decision Making Ppt Sample
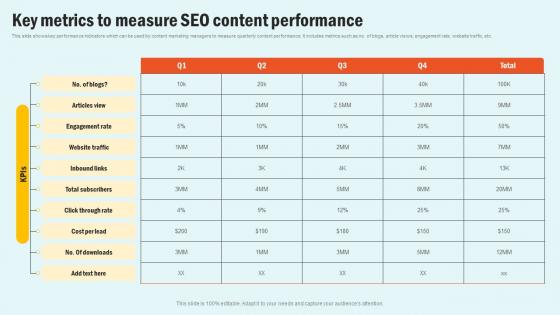
Key Metrics To Measure SEO Enhancing Website Performance With Search Engine Content Background Pdf
This slide shows key performance indicators which can be used by content marketing managers to measure quarterly content performance. It includes metrics such as no. of blogs, article views, engagement rate, website traffic, etc. Formulating a presentation can take up a lot of effort and time, so the content and message should always be the primary focus. The visuals of the PowerPoint can enhance the presenters message, so our Key Metrics To Measure SEO Enhancing Website Performance With Search Engine Content Background Pdf was created to help save time. Instead of worrying about the design, the presenter can concentrate on the message while our designers work on creating the ideal templates for whatever situation is needed. Slidegeeks has experts for everything from amazing designs to valuable content, we have put everything into Key Metrics To Measure SEO Enhancing Website Performance With Search Engine Content Background Pdf This slide shows key performance indicators which can be used by content marketing managers to measure quarterly content performance. It includes metrics such as no. of blogs, article views, engagement rate, website traffic, etc.
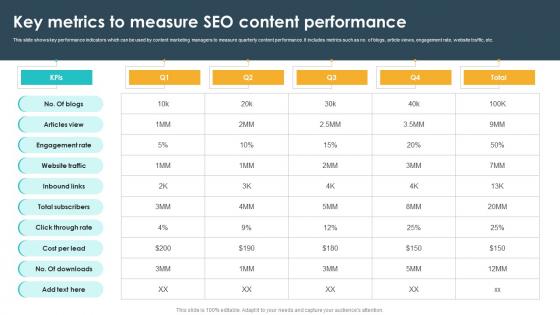
Key Metrics To Measure Seo Content Performance Seo Content Plan To Drive Strategy SS V
This slide shows key performance indicators which can be used by content marketing managers to measure quarterly content performance. It includes metrics such as no. of blogs, article views, engagement rate, website traffic, etc. Formulating a presentation can take up a lot of effort and time, so the content and message should always be the primary focus. The visuals of the PowerPoint can enhance the presenters message, so our Key Metrics To Measure Seo Content Performance Seo Content Plan To Drive Strategy SS V was created to help save time. Instead of worrying about the design, the presenter can concentrate on the message while our designers work on creating the ideal templates for whatever situation is needed. Slidegeeks has experts for everything from amazing designs to valuable content, we have put everything into Key Metrics To Measure Seo Content Performance Seo Content Plan To Drive Strategy SS V This slide shows key performance indicators which can be used by content marketing managers to measure quarterly content performance. It includes metrics such as no. of blogs, article views, engagement rate, website traffic, etc.

Sales Strategy Template 1 Ppt PowerPoint Presentation Inspiration
This is a sales strategy template 1 ppt powerpoint presentation inspiration. This is a one stage process. The stages in this process are sale strategy, marketing, magnifier, business.
Data Science And Management With Business Reporting Ppt PowerPoint Presentation Icon Styles PDF
Presenting this set of slides with name data science and management with business reporting ppt powerpoint presentation icon styles pdf. This is a nine stage process. The stages in this process are business, management, structuring. This is a completely editable PowerPoint presentation and is available for immediate download. Download now and impress your audience.
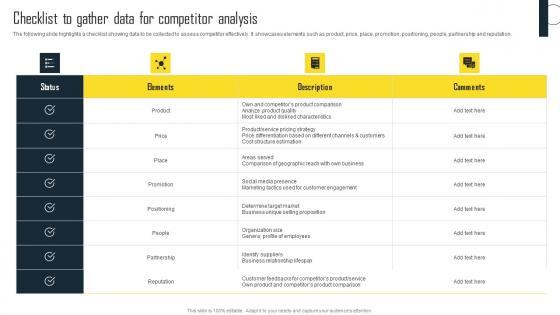
Checklist To Gather Data For Competitor Analysis Efficient Plan For Conducting Competitor Inspiration Pdf
The following slide highlights a checklist showing data to be collected to assess competitor effectively. It showcases elements such as product, price, place, promotion, positioning, people, partnership and reputation. From laying roadmaps to briefing everything in detail, our templates are perfect for you. You can set the stage with your presentation slides. All you have to do is download these easy-to-edit and customizable templates. Checklist To Gather Data For Competitor Analysis Efficient Plan For Conducting Competitor Inspiration Pdf will help you deliver an outstanding performance that everyone would remember and praise you for. Do download this presentation today. The following slide highlights a checklist showing data to be collected to assess competitor effectively. It showcases elements such as product, price, place, promotion, positioning, people, partnership and reputation.
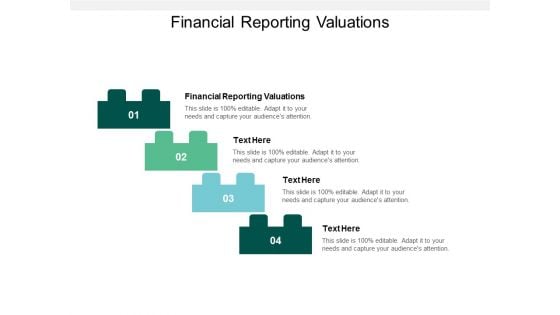
Financial Reporting Valuations Ppt PowerPoint Presentation Outline Themes Cpb
Presenting this set of slides with name financial reporting valuations ppt powerpoint presentation outline themes cpb. This is an editable Powerpoint four stages graphic that deals with topics like financial reporting valuations to help convey your message better graphically. This product is a premium product available for immediate download and is 100 percent editable in Powerpoint. Download this now and use it in your presentations to impress your audience.
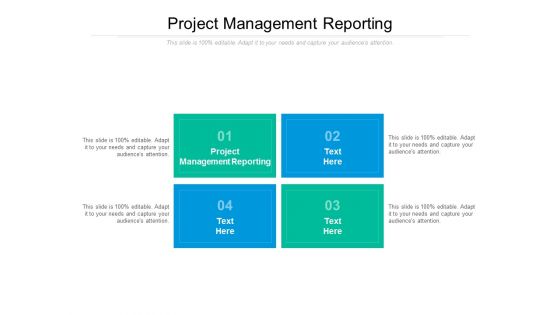
Project Management Reporting Ppt PowerPoint Presentation Outline Microsoft Cpb
Presenting this set of slides with name project management reporting ppt powerpoint presentation outline microsoft cpb. This is an editable Powerpoint four stages graphic that deals with topics like project management reporting to help convey your message better graphically. This product is a premium product available for immediate download and is 100 percent editable in Powerpoint. Download this now and use it in your presentations to impress your audience.
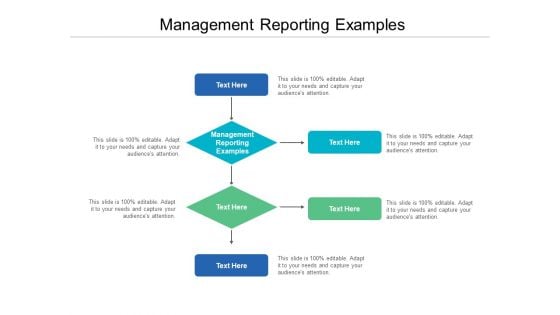
Management Reporting Examples Ppt PowerPoint Presentation Outline Example Cpb
Presenting this set of slides with name management reporting examples ppt powerpoint presentation outline example cpb. This is an editable Powerpoint one stages graphic that deals with topics like management reporting examples to help convey your message better graphically. This product is a premium product available for immediate download and is 100 percent editable in Powerpoint. Download this now and use it in your presentations to impress your audience.
Magnifying Glass Ppt PowerPoint Presentation Layouts
This is a magnifying glass ppt powerpoint presentation layouts. This is a one stage process. The stages in this process are magnifying glass, business, management, marketing, strategy.
Magnifying Glass Ppt PowerPoint Presentation Inspiration Layouts
This is a magnifying glass ppt powerpoint presentation inspiration layouts. This is a four stage process. The stages in this process are gears, technology, business, marketing, strategy.
Magnifying Glass Ppt PowerPoint Presentation Inspiration Design Templates
This is a magnifying glass ppt powerpoint presentation inspiration design templates. This is a four stage process. The stages in this process are magnifier glass, research, business, marketing, focus.
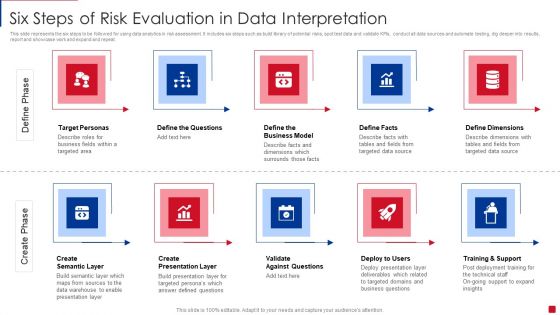
Six Steps Of Risk Evaluation In Data Interpretation Introduction PDF
This slide represents the six steps to be followed for using data analytics in risk assessment. It includes six steps such as build library of potential risks, spot test data and validate KPIs, conduct all data sources and automate testing, dig deeper into results, report and showcase work and expand and repeat. Persuade your audience using this Six Steps Of Risk Evaluation In Data Interpretation Introduction PDF. This PPT design covers six stages, thus making it a great tool to use. It also caters to a variety of topics including Expand And Repeat, Report Showcase Work, Potential Risks. Download this PPT design now to present a convincing pitch that not only emphasizes the topic but also showcases your presentation skills.
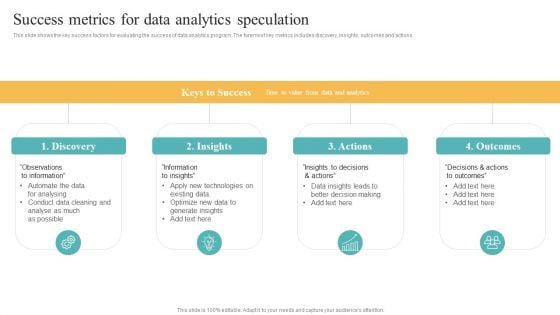
Transformation Toolkit Competitive Intelligence Information Analysis Success Metrics For Data Analytics Speculation Diagrams PDF
This slide shows the key success factors for evaluating the success of data analytics program. The foremost key metrics includes discovery, insights, outcomes and actions. Do you have to make sure that everyone on your team knows about any specific topic I yes, then you should give Transformation Toolkit Competitive Intelligence Information Analysis Success Metrics For Data Analytics Speculation Diagrams PDF a try. Our experts have put a lot of knowledge and effort into creating this impeccable Transformation Toolkit Competitive Intelligence Information Analysis Success Metrics For Data Analytics Speculation Diagrams PDF. You can use this template for your upcoming presentations, as the slides are perfect to represent even the tiniest detail. You can download these templates from the Slidegeeks website and these are easy to edit. So grab these today.
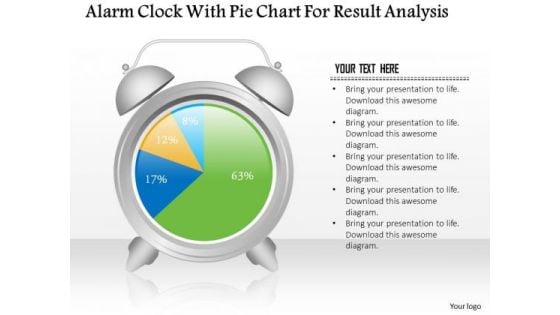
Business Diagram Alarm Clock With Pie Chart For Result Analysis PowerPoint Slide
This business slide displays alarm clock with pie chart. This diagram is a data visualization tool that gives you a simple way to present statistical information. This slide helps your audience examine and interpret the data you present.

5 R2R Key Performance Indicators Ppt PowerPoint Presentation Model Topics PDF
Following slide outlines critical R2R KPIs. Time to close, number of entry corrections, voice of transactions per FTE, growth of CA and process costs are some of the KPIs, which will assist accounts department to measure its overall performance.Showcasing this set of slides titled 5 R2R Key Performance Indicators Ppt PowerPoint Presentation Model Topics PDF. The topics addressed in these templates are Volume Transactions, Process Cost, Entry Corrections. All the content presented in this PPT design is completely editable. Download it and make adjustments in color, background, font etc. as per your unique business setting.
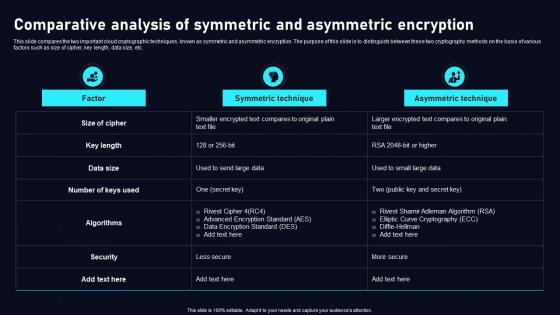
Comparative Analysis Of Symmetric Cloud Data Security Using Cryptography Clipart Pdf
This slide compares the two important cloud cryptographic techniques, known as symmetric and asymmetric encryption. The purpose of this slide is to distinguish between these two cryptography methods on the basis of various factors such as size of cipher, key length, data size, etc. Explore a selection of the finest Comparative Analysis Of Symmetric Cloud Data Security Using Cryptography Clipart Pdf here. With a plethora of professionally designed and pre made slide templates, you can quickly and easily find the right one for your upcoming presentation. You can use our Comparative Analysis Of Symmetric Cloud Data Security Using Cryptography Clipart Pdf to effectively convey your message to a wider audience. Slidegeeks has done a lot of research before preparing these presentation templates. The content can be personalized and the slides are highly editable. Grab templates today from Slidegeeks. This slide compares the two important cloud cryptographic techniques, known as symmetric and asymmetric encryption. The purpose of this slide is to distinguish between these two cryptography methods on the basis of various factors such as size of cipher, key length, data size, etc.
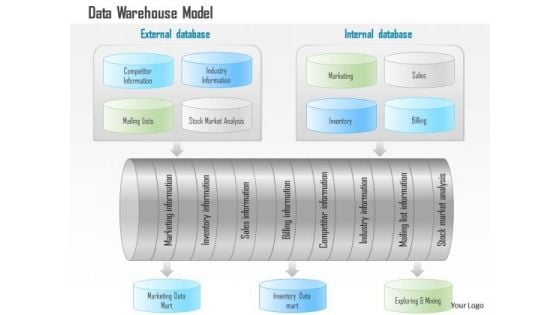
Business Diagram Data Warehouse Model With Analytics And Business Intelligence Ppt Slide
This technology diagram has been designed with graphic of data warehouse model. This model depicts concept of business intelligence and analysis. Download this editable slide build an exclusive presentation.
Research Plan With Trends Chart Vector Icon Ppt PowerPoint Presentation Icon Elements PDF
Presenting research plan with trends chart vector icon ppt powerpoint presentation icon elements pdf to dispense important information. This template comprises three stages. It also presents valuable insights into the topics including research plan with trends chart vector icon. This is a completely customizable PowerPoint theme that can be put to use immediately. So, download it and address the topic impactfully.

Principles Of Behavioral Analysis Biomedical Data Science And Health Informatics Mockup Pdf
This slide depicts the principles of behavioral analysis using digital biomarkers. It also includes the components, such as a microphone, camera, activity, location, light sensor, call and text logs, browser history, screen events, and human computer interactions. There are so many reasons you need a Principles Of Behavioral Analysis Biomedical Data Science And Health Informatics Mockup Pdf. The first reason is you can not spend time making everything from scratch, Thus, Slidegeeks has made presentation templates for you too. You can easily download these templates from our website easily. This slide depicts the principles of behavioral analysis using digital biomarkers. It also includes the components, such as a microphone, camera, activity, location, light sensor, call and text logs, browser history, screen events, and human computer interactions.
Big Data Sources For Healthcare Data Analytics Icons PDF
This slide showcases the information for health care analysis. It includes sources such as research studies, EHC, search engine data, smart devices, patient portals, government agencies and public records. Presenting Big Data Sources For Healthcare Data Analytics Icons PDF to dispense important information. This template comprises Six stages. It also presents valuable insights into the topics including Generic Databases, Electronic Health Records, Government Agencies. This is a completely customizable PowerPoint theme that can be put to use immediately. So, download it and address the topic impactfully.
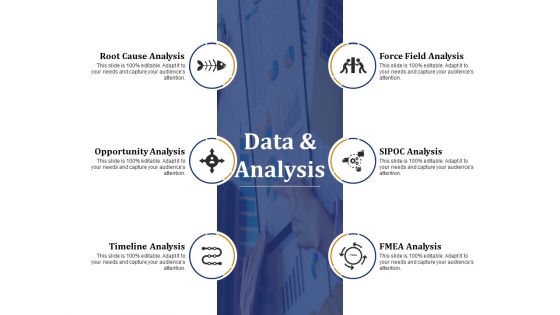
Data And Analysis Ppt PowerPoint Presentation Portfolio Layouts
This is a data and analysis ppt powerpoint presentation portfolio layouts. This is a six stage process. The stages in this process are root cause analysis, opportunity analysis, timeline analysis, force field analysis, fmea analysis.

Key Trends Of Global Cosmetic Industry Successful Launch Ppt Template
The following slide outlines various trends in global beauty and cosmetic industry that are leading to market growth and expansion. It showcases elements such as male grooming, awareness and hormones, beauty subscription services and diversity. Retrieve professionally designed Key Trends Of Global Cosmetic Industry Successful Launch Ppt Template to effectively convey your message and captivate your listeners. Save time by selecting pre-made slideshows that are appropriate for various topics, from business to educational purposes. These themes come in many different styles, from creative to corporate, and all of them are easily adjustable and can be edited quickly. Access them as PowerPoint templates or as Google Slides themes. You do not have to go on a hunt for the perfect presentation because Slidegeeks got you covered from everywhere. The following slide outlines various trends in global beauty and cosmetic industry that are leading to market growth and expansion. It showcases elements such as male grooming, awareness and hormones, beauty subscription services and diversity.
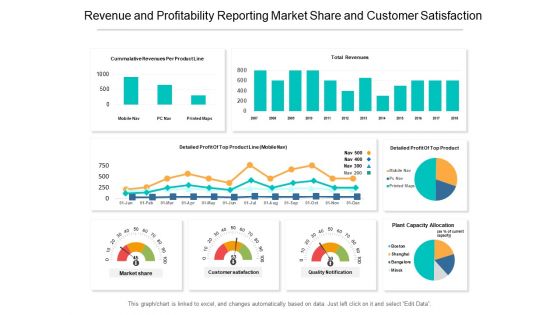
Revenue And Profitability Reporting Market Share And Customer Satisfaction Ppt PowerPoint Presentation Styles Format Ideas
This is a revenue and profitability reporting market share and customer satisfaction ppt powerpoint presentation styles format ideas. This is a four stage process. The stages in this process are business analytics, ba, organizations data.
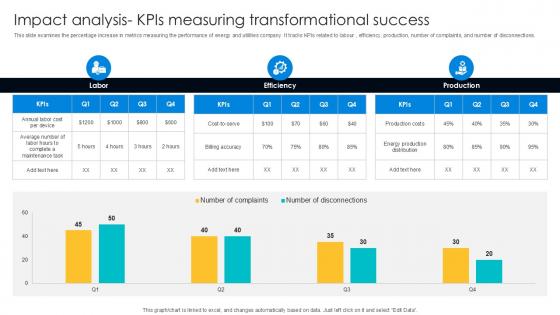
Impact Analysis KPIs Measuring Digital Transformation Journey PPT Presentation DT SS V
This slide examines the percentage increase in metrics measuring the performance of energy and utilities company. It tracks KPIs related to labour , efficiency, production, number of complaints, and number of disconnections. The Impact Analysis KPIs Measuring Digital Transformation Journey PPT Presentation DT SS V is a compilation of the most recent design trends as a series of slides. It is suitable for any subject or industry presentation, containing attractive visuals and photo spots for businesses to clearly express their messages. This template contains a variety of slides for the user to input data, such as structures to contrast two elements, bullet points, and slides for written information. Slidegeeks is prepared to create an impression. This slide examines the percentage increase in metrics measuring the performance of energy and utilities company. It tracks KPIs related to labour , efficiency, production, number of complaints, and number of disconnections.

Project Progress Gannt Chart Report Ppt PowerPoint Presentation Outline Images
This is a project progress gannt chart report ppt powerpoint presentation outline images. This is a eight stage process. The stages in this process are activity tracker, business, marketing.
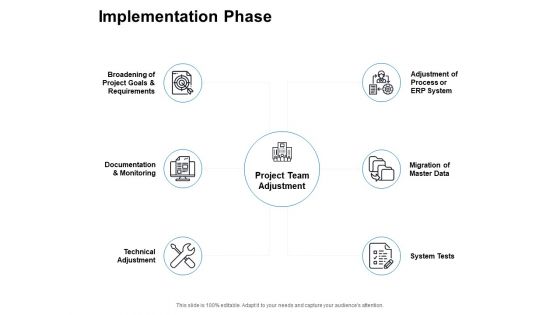
Implementation Phase Ppt PowerPoint Presentation Outline Deck
Presenting this set of slides with name implementation phase ppt powerpoint presentation outline deck. This is a six stage process. The stages in this process are broadening project goals and requirements, documentation and monitoring, technical adjustment, system tests, migration master data, adjustment process, erp system. This is a completely editable PowerPoint presentation and is available for immediate download. Download now and impress your audience.
4 Steps Agenda To Achieve Company Goals Ppt PowerPoint Presentation Inspiration
This is a 4 steps agenda to achieve company goals ppt powerpoint presentation inspiration. This is a four stage process. The stages in this process are business, agenda, strategy, analysis, success.

Workstream Updates Powerpoint Ppt Template Bundles
This Project Status, Deliverables, Status Report, Update Timeline, Members Workstream-slide Workstream Updates Powerpoint Ppt Template Bundles is your content ready tool to impress the stakeholders with your business planning and its manner of execution. Showcase your ideas and how you plan to make them real in detail with this PPT Template Bundle. The slides have the conceptual bandwidth to present the crucial aspects of your plan, such as funding, marketing, resource allocation, timeline, roadmap, and more. When you present your plans with this PPT Layout, the stakeholders are sure to come on board because you will be able to present a succinct, thought-out, winning project. Download this Complete Deck now to take control into your hands. The 100 percent customizable offer is just too good to be resisted. Our Workstream Updates PowerPoint PPT Template Bundle is designed to provide a visually engaging backdrop for any topic. Use these templates to present with confidence and professionalism.
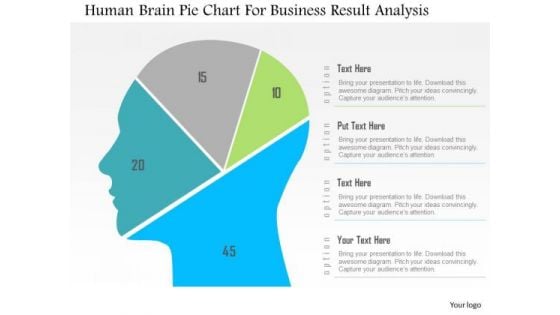
Business Diagram Human Brain Pie Chart For Business Result Analysis PowerPoint Slide
This diagram displays human face graphic divided into sections. This section can be used for data display. Use this diagram to build professional presentations for your viewers.
Icon Of Macroeconomic Analysis Illustrating Risk Reduction In Economy Formats PDF
Presenting Icon Of Macroeconomic Analysis Illustrating Risk Reduction In Economy Formats PDF to dispense important information. This template comprises one stages. It also presents valuable insights into the topics including Icon Of Macroeconomic Analysis Illustrating Risk Reduction In Economy. This is a completely customizable PowerPoint theme that can be put to use immediately. So, download it and address the topic impactfully.
Business Tactical And Strategic Analysis For Profitability Growth Icon Pictures PDF
Presenting Business Tactical And Strategic Analysis For Profitability Growth Icon Pictures PDF to dispense important information. This template comprises three stages. It also presents valuable insights into the topics including Business Tactical, Analysis, Profitability Growth, Icon. This is a completely customizable PowerPoint theme that can be put to use immediately. So, download it and address the topic impactfully.
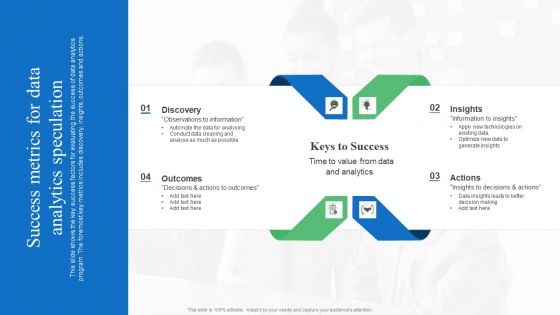
Toolkit For Data Science And Analytics Transition Success Metrics For Data Analytics Speculation Template PDF
Crafting an eye catching presentation has never been more straightforward. Let your presentation shine with this tasteful yet straightforward Toolkit For Data Science And Analytics Transition Success Metrics For Data Analytics Speculation Template PDF template. It offers a minimalistic and classy look that is great for making a statement. The colors have been employed intelligently to add a bit of playfulness while still remaining professional. Construct the ideal Toolkit For Data Science And Analytics Transition Success Metrics For Data Analytics Speculation Template PDF that effortlessly grabs the attention of your audience Begin now and be certain to wow your customers.
Social Platforms Data Analysis Marketing Statistical Data Icon Ideas PDF
Presenting Social Platforms Data Analysis Marketing Statistical Data Icon Ideas PDF to dispense important information. This template comprises three stages. It also presents valuable insights into the topics including Social Platforms Data Analysis, Marketing Statistical Data Icon. This is a completely customizable PowerPoint theme that can be put to use immediately. So, download it and address the topic impactfully.
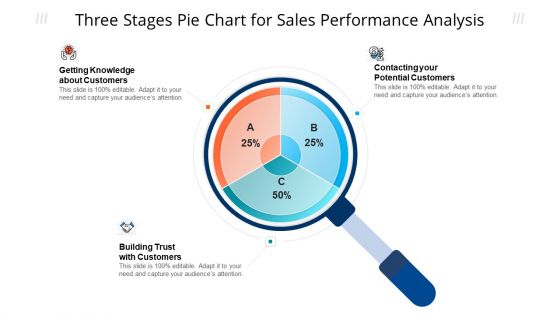
Three Stages Pie Chart For Sales Performance Analysis Ppt Model Tips PDF
Persuade your audience using this three stages pie chart for sales performance analysis ppt model tips pdf. This PPT design covers three stages, thus making it a great tool to use. It also caters to a variety of topics including potential customers, knowledge about customers, sales performance analysis. Download this PPT design now to present a convincing pitch that not only emphasizes the topic but also showcases your presentation skills.
Icon Of BI System To Enhance Processes For Statistical Analysis Ppt Ideas Elements PDF
Persuade your audience using this Icon Of BI System To Enhance Processes For Statistical Analysis Ppt Ideas Elements PDF. This PPT design covers four stages, thus making it a great tool to use. It also caters to a variety of topics including Icon, BI System, Enhance Processes, Statistical Analysis. Download this PPT design now to present a convincing pitch that not only emphasizes the topic but also showcases your presentation skills.
Website Analysis Icon For SEO Performance Improvement Ppt Gallery Professional PDF
Persuade your audience using this Website Analysis Icon For SEO Performance Improvement Ppt Gallery Professional PDF. This PPT design covers four stages, thus making it a great tool to use. It also caters to a variety of topics including Website Analysis, Icon, SEO Performance Improvement. Download this PPT design now to present a convincing pitch that not only emphasizes the topic but also showcases your presentation skills.
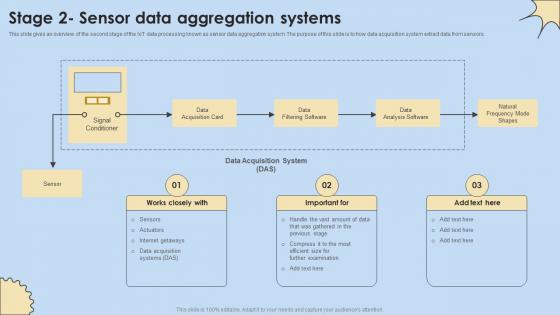
Stage 2 Sensor Data Aggregation Systems Internet Of Things Analysis Introduction Pdf
This slide gives an overview of the second stage of the IoT data processing known as sensor data aggregation system. The purpose of this slide is to how data acquisition system extract data from sensors. Do you know about Slidesgeeks Stage 2 Sensor Data Aggregation Systems Internet Of Things Analysis Introduction Pdf These are perfect for delivering any kind od presentation. Using it, create PowerPoint presentations that communicate your ideas and engage audiences. Save time and effort by using our pre-designed presentation templates that are perfect for a wide range of topic. Our vast selection of designs covers a range of styles, from creative to business, and are all highly customizable and easy to edit. Download as a PowerPoint template or use them as Google Slides themes. This slide gives an overview of the second stage of the IoT data processing known as sensor data aggregation system. The purpose of this slide is to how data acquisition system extract data from sensors.

Quotes Ppt PowerPoint Presentation Template
This is a quotes ppt powerpoint presentation template. This is a one stage process. The stages in this process are business, management, marketing, success, strategy.
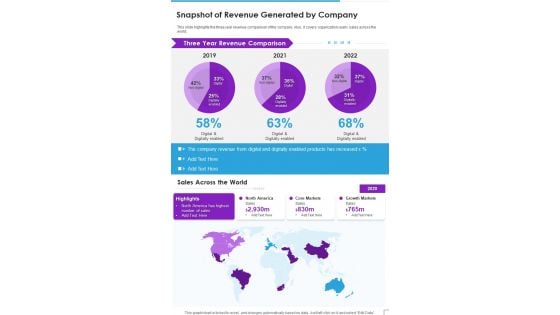
Snapshot Of Revenue Generated By Company Template 348 One Pager Documents
This slide highlights the three year revenue comparison of the company. Also, it covers organization yearly sales across the world. Presenting you a fantastic Snapshot Of Revenue Generated By Company Template 348 One Pager Documents. This piece is crafted on hours of research and professional design efforts to ensure you have the best resource. It is completely editable and its design allow you to rehash its elements to suit your needs. Get this Snapshot Of Revenue Generated By Company Template 348 One Pager Documents A4 One-pager now.
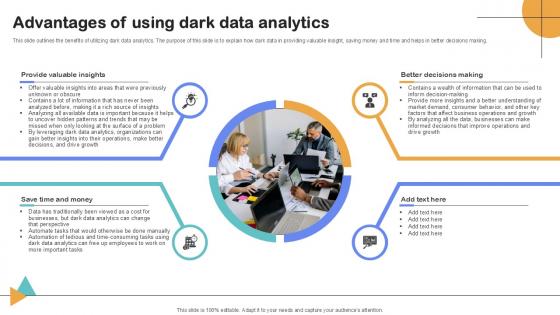
Advantages Of Using Dark Data Analytics Importance Of Unstructured Data Ppt Slide
This slide outlines the benefits of utilizing dark data analytics. The purpose of this slide is to explain how dark data in providing valuable insight, saving money and time and helps in better decisions making.Create an editable Advantages Of Using Dark Data Analytics Importance Of Unstructured Data Ppt Slide that communicates your idea and engages your audience. Whether you are presenting a business or an educational presentation, pre-designed presentation templates help save time. Advantages Of Using Dark Data Analytics Importance Of Unstructured Data Ppt Slide is highly customizable and very easy to edit, covering many different styles from creative to business presentations. Slidegeeks has creative team members who have crafted amazing templates. So, go and get them without any delay. This slide outlines the benefits of utilizing dark data analytics. The purpose of this slide is to explain how dark data in providing valuable insight, saving money and time and helps in better decisions making.
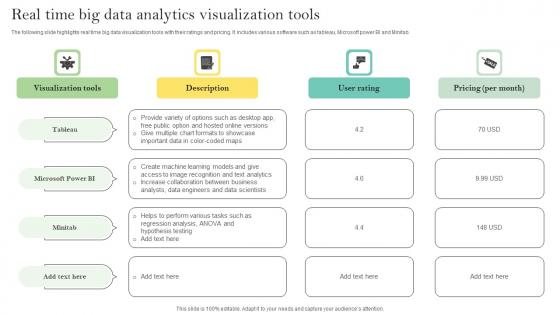
Real Time Big Data Analytics Visualization Tools Ppt Portfolio Example Pdf
The following slide highlights real time big data visualization tools with their ratings and pricing. It includes various software such as tableau, Microsoft power BI and Minitab. Pitch your topic with ease and precision using this Real Time Big Data Analytics Visualization Tools Ppt Portfolio Example Pdf. This layout presents information on Visualization Tools, User Rating, Pricing Per Month. It is also available for immediate download and adjustment. So, changes can be made in the color, design, graphics or any other component to create a unique layout. The following slide highlights real time big data visualization tools with their ratings and pricing. It includes various software such as tableau, Microsoft power BI and Minitab.
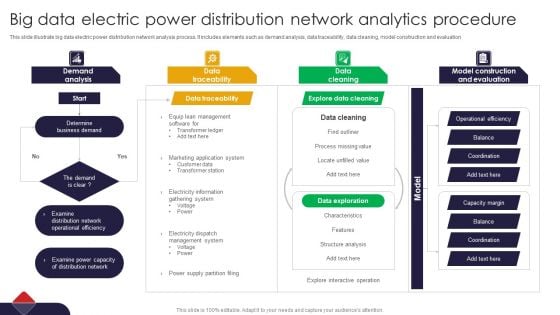
Big Data Electric Power Distribution Network Analytics Procedure Slides PDF
This slide illustrate big data electric power distribution network analysis process. It includes elements such as demand analysis, data traceability, data cleaning, model construction and evaluation Persuade your audience using this Big Data Electric Power Distribution Network Analytics Procedure Slides PDF. This PPT design covers three stages, thus making it a great tool to use. It also caters to a variety of topics including Demand Analysis, Data Traceability, Data Cleaning. Download this PPT design now to present a convincing pitch that not only emphasizes the topic but also showcases your presentation skills.
Big Data Analytics Framework Ppt PowerPoint Presentation Complete Deck With Slides
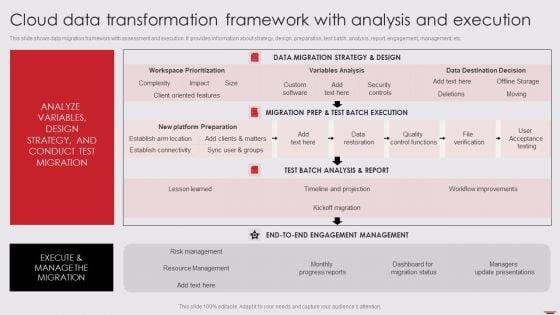
Cloud Data Transformation Framework With Analysis And Execution Diagrams PDF
This slide shows data migration framework with assessment and execution. It provides information about strategy, design, preparation, test batch, analysis, report, engagement, management, etc. Pitch your topic with ease and precision using this Cloud Data Transformation Framework With Analysis And Execution Diagrams PDF. This layout presents information on Data Migration Strategy, Migration Prep Test, Test Batch Analysis. It is also available for immediate download and adjustment. So, changes can be made in the color, design, graphics or any other component to create a unique layout.
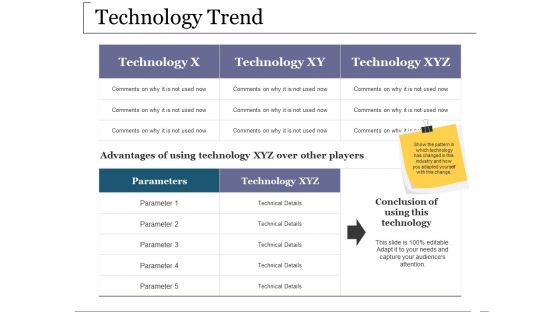
Technology Trend Ppt PowerPoint Presentation Styles Slideshow
This is a technology trend ppt powerpoint presentation styles slideshow. This is a three stage process. The stages in this process are business, marketing, technology x, parameters, technology xyz, technology.
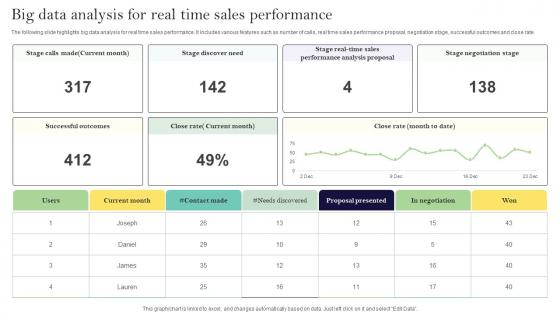
Big Data Analysis For Real Time Sales Performance Ppt Show Format Ideas Pdf
The following slide highlights big data analysis for real time sales performance. It includes various features such as number of calls, real time sales performance proposal, negotiation stage, successful outcomes and close rate. Showcasing this set of slides titled Big Data Analysis For Real Time Sales Performance Ppt Show Format Ideas Pdf. The topics addressed in these templates are Negotiation Stage, Successful Outcomes, Close Rate. All the content presented in this PPT design is completely editable. Download it and make adjustments in color, background, font etc. as per your unique business setting. The following slide highlights big data analysis for real time sales performance. It includes various features such as number of calls, real time sales performance proposal, negotiation stage, successful outcomes and close rate.
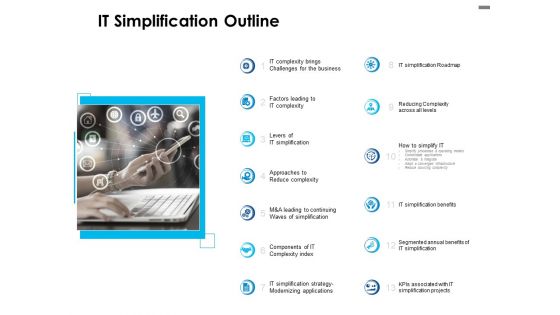
IT Simplification Outline Ppt PowerPoint Presentation Infographic Template Templates
Presenting this set of slides with name it simplification outline ppt powerpoint presentation infographic template templates. This is a thirteen stage process. The stages in this process are kpis associated it simplification projects, approaches reduce complexity, factors leading it complexity. This is a completely editable PowerPoint presentation and is available for immediate download. Download now and impress your audience.
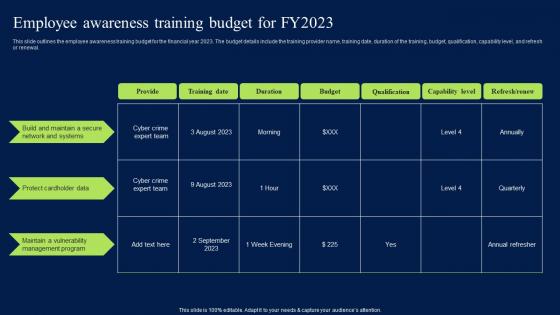
Employee Awareness Training Budget For FY2023 Infographics PDF
This slide outlines the employee awareness training budget for the financial year 2023. The budget details include the training provider name, training date, duration of the training, budget, qualification, capability level, and refresh or renewal. This Employee Awareness Training Budget For FY2023 Infographics PDF from Slidegeeks makes it easy to present information on your topic with precision. It provides customization options, so you can make changes to the colors, design, graphics, or any other component to create a unique layout. It is also available for immediate download, so you can begin using it right away. Slidegeeks has done good research to ensure that you have everything you need to make your presentation stand out. Make a name out there for a brilliant performance. This slide outlines the employee awareness training budget for the financial year 2023. The budget details include the training provider name, training date, duration of the training, budget, qualification, capability level, and refresh or renewal.
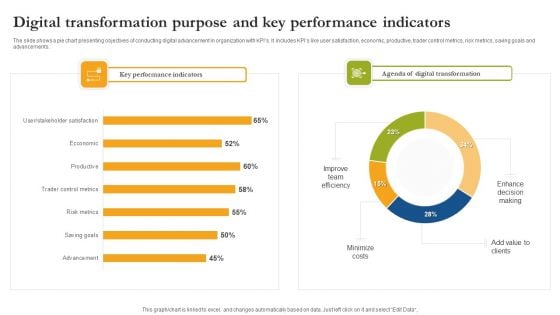
Digital Transformation Purpose And Key Performance Indicators Formats PDF
The slide shows a pie chart presenting objectives of conducting digital advancement in organization with KPIs. It includes KPIs like user satisfaction, economic, productive, trader control metrics, risk metrics, saving goals and advancements. Pitch your topic with ease and precision using this Digital Transformation Purpose And Key Performance Indicators Formats PDF. This layout presents information on Key Performance Indicators, Digital Transformation, Minimize Costs. It is also available for immediate download and adjustment. So, changes can be made in the color, design, graphics or any other component to create a unique layout.


 Continue with Email

 Home
Home


