Dashboards
Icon Of Alarm Clock Vector Illustration Ppt PowerPoint Presentation Ideas Clipart PDF
Presenting this set of slides with name icon of alarm clock vector illustration ppt powerpoint presentation ideas clipart pdf. This is a three stage process. The stages in this process are icon of alarm clock vector illustration. This is a completely editable PowerPoint presentation and is available for immediate download. Download now and impress your audience.
Icon Of Clock With Circular Arrow Vector Illustration Ppt PowerPoint Presentation Model Background Image PDF
Presenting this set of slides with name icon of clock with circular arrow vector illustration ppt powerpoint presentation model background image pdf. This is a three stage process. The stages in this process are icon of clock with circular arrow vector illustration. This is a completely editable PowerPoint presentation and is available for immediate download. Download now and impress your audience.
Icon Of Clock With Cross Symbol Vector Illustration Ppt PowerPoint Presentation Inspiration Slides PDF
Presenting this set of slides with name icon of clock with cross symbol vector illustration ppt powerpoint presentation inspiration slides pdf. This is a one stage process. The stage in this process is icon of clock with cross symbol vector illustration. This is a completely editable PowerPoint presentation and is available for immediate download. Download now and impress your audience.
Stop Watch In Human Hand Vector Icon Ppt PowerPoint Presentation Infographics Pictures PDF
Presenting this set of slides with name stop watch in human hand vector icon ppt powerpoint presentation infographics pictures pdf. This is a three stage process. The stages in this process are stop watch in human hand vector icon. This is a completely editable PowerPoint presentation and is available for immediate download. Download now and impress your audience.
Time Management Vector Icon Ppt PowerPoint Presentation Inspiration Introduction PDF
Presenting this set of slides with name time management vector icon ppt powerpoint presentation inspiration introduction pdf. This is a three stage process. The stages in this process are time management vector icon. This is a completely editable PowerPoint presentation and is available for immediate download. Download now and impress your audience.
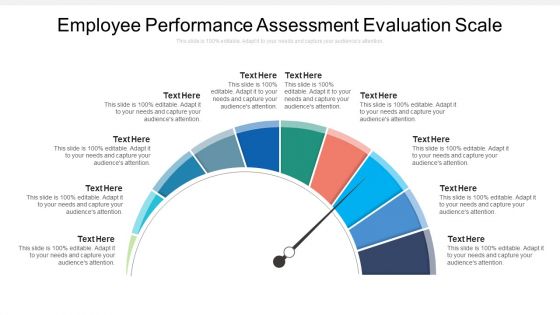
Employee Performance Assessment Evaluation Scale Ppt PowerPoint Presentation Gallery Deck PDF
Persuade your audience using this employee performance assessment evaluation scale ppt powerpoint presentation gallery deck pdf. This PPT design covers eight stages, thus making it a great tool to use. It also caters to a variety of topics including employee performance assessment evaluation scale. Download this PPT design now to present a convincing pitch that not only emphasizes the topic but also showcases your presentation skills.
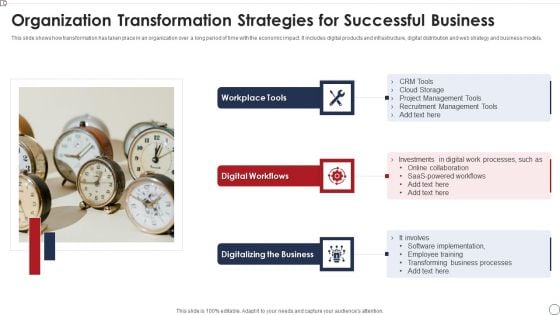
Organization Transformation Strategies For Successful Business Elements PDF
This slide shows how transformation has taken place in an organization over a long period of time with the economic impact. It includes digital products and infrastructure, digital distribution and web strategy and business models. Presenting Organization Transformation Strategies For Successful Business Elements PDF to dispense important information. This template comprises three stages. It also presents valuable insights into the topics including Workplace Tools, Digital Workflows, Digitalizing The Business. This is a completely customizable PowerPoint theme that can be put to use immediately. So, download it and address the topic impactfully.
Sales Diagram Dashbaord Design To Communicate Effectively Marketing Diagram
Get Out Of The Dock With Our Sales Diagram Dashboard Design To Communicate Effectively Marketing Diagram Powerpoint Templates. Your Mind Will Be Set Free.
Strategy Diagram Dashbaord Design To Communicate Effectively Strategic Management
Document Your Views On Our Strategy Diagram Dashboard Design To Communicate Effectively Strategic Management Powerpoint Templates. They Will Create A Strong Impression.
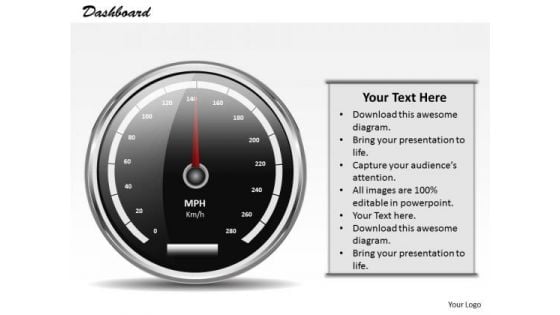
Business Diagram Dashbaord Design To Communicate Effectively Marketing Diagram
Analyze Ailments On Our Business Diagram Dashboard Design To Communicate Effectively Marketing Diagram Powerpoint Templates. Bring Out The Thinking Doctor In You. Dock Your Thoughts With Our Business Diagram Dashboard Design To Communicate Effectively Marketing Diagram Powerpoint Templates. They Will Launch Them Into Orbit.
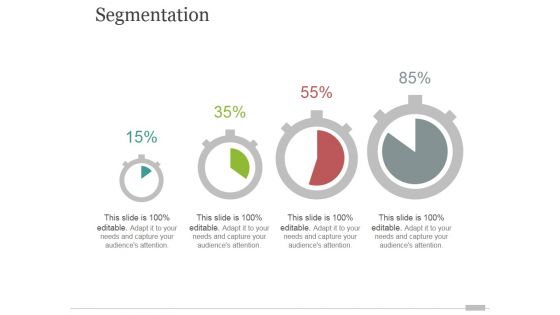
Segmentation Ppt PowerPoint Presentation Slides
This is a segmentation ppt powerpoint presentation slides. This is a four stage process. The stages in this process are business, marketing, strategy, success, process.
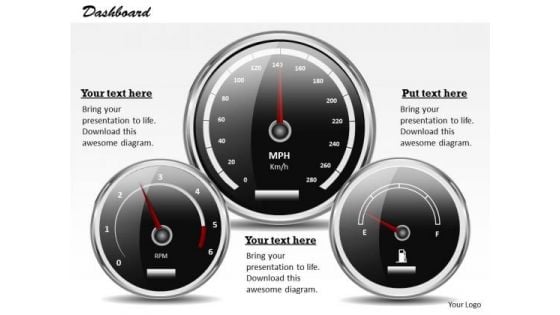
Strategic Management Dashbaord Design To Communicate Effectively Strategy Diagram
Get Out Of The Dock With Our Strategic Management Dashbaord Design To Communicate Effectively Powerpoint Templates. Your Mind Will Be Set Free.
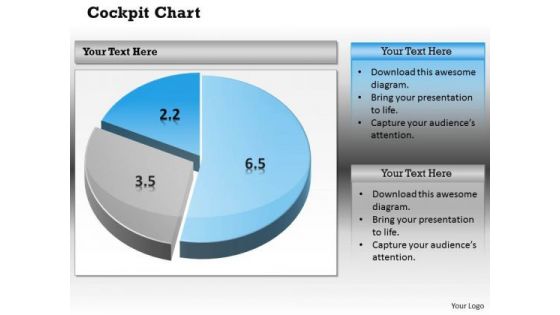
Business Cycle Diagram Pie Chart Dashborad Design Marketing Diagram
Document Your Views On Our Business Cycle Diagram Pie Chart Dashborad Design Marketing Diagram Powerpoint Templates. They Will Create A Strong Impression.
Strategy Diagram Design Of Red Large Building Business Diagram
Open Up Doors That Lead To Success. Our Strategy Diagram Design Of Red Large Building Business Diagram Powerpoint Templates Provide The Handles.
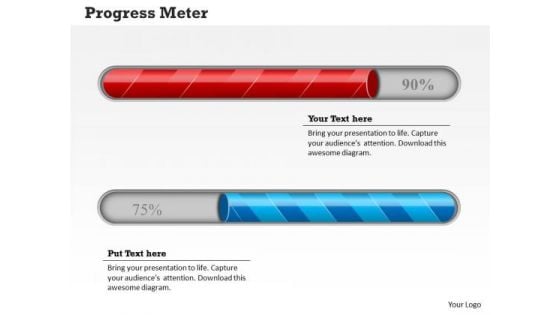
Strategy Diagram Meter Design For Business Progress Sales Diagram
Our Strategy Diagram Meter Design For Business Progress Sales Diagram Powerpoint Templates Abhor Doodling. They Never Let The Interest Flag.
Pie Chart With Icons For Business Analysis Powerpoint Slides
This dashboard template contains graphics of pie chart with icons. This dashboard PowerPoint template helps to display business analysis in a visual manner. Download this template to make impressive presentations.
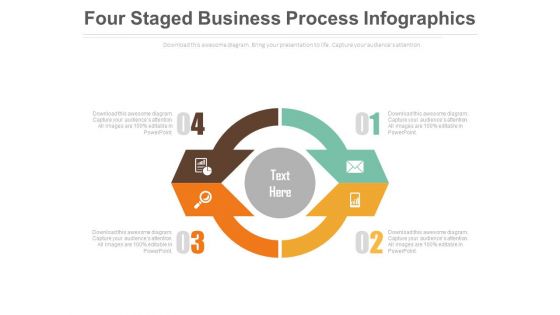
Four Steps Circular Infographic Powerpoint Slides
This innovative, stunningly beautiful dashboard has been designed for data visualization. It contains circular infographic design. This PowerPoint template helps to display your information in a useful, simple and orderly way.
Stopwatch For Speed Calculation Powerpoint Slides
This innovative, stunningly beautiful dashboard has been designed for speed calculation. It contains graphics of stopwatch. This PowerPoint template helps to display your information in a useful, simple and orderly way.
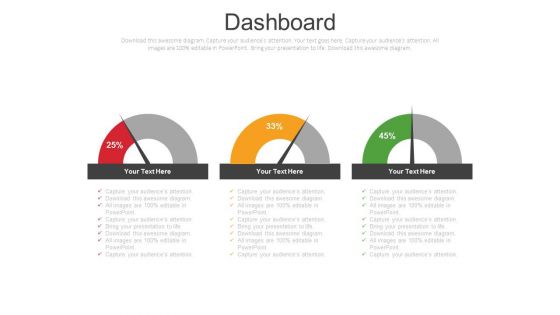
Parameters Of Growth And Development Powerpoint Slides
Dashboard design has been displayed in this business slide. This business diagram helps to exhibit parameters of growth and development. Download this PowerPoint template to build an exclusive presentation.
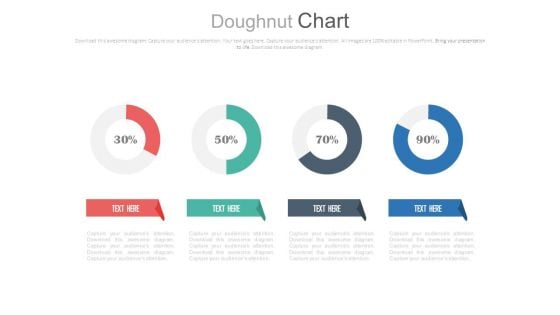
Four Circle Chart With Percentage Ratios Powerpoint Slides
This PowerPoint template has been designed with graphics of four circles and percentage ratios. You may use this dashboard slide design for topics like profit growth and financial planning. This PPT slide is powerful tool to describe your ideas.
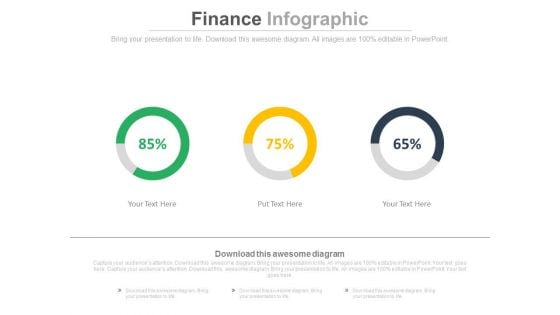
Linear Circles Percentage Analysis Charts Powerpoint Slides
This PowerPoint template has been designed with graphics of three circles and percentage ratios. You may use this dashboard slide design for topics like profit growth and financial planning. This PPT slide is powerful tool to describe your ideas.

Operational Performance Management Powerpoint Layout
This is a operational performance management powerpoint layout. This is a one stage process. The stages in this process are dashboard, measure, business.
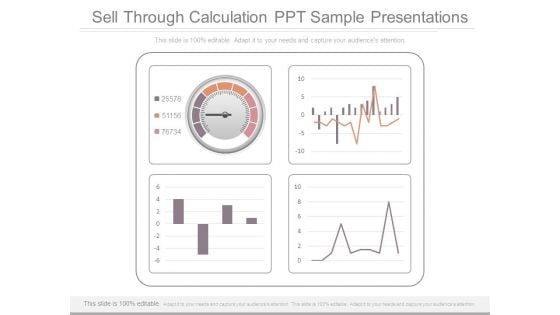
Sell Through Calculation Ppt Sample Presentations
This is a sell through calculation ppt sample presentations. This is a four stage process. The stages in this process are dashboard, business, graph.
Balanced Scorecard Leading And Lagging Indicators Powerpoint Slide
This is a balanced scorecard leading and lagging indicators powerpoint slide. This is a four stage process. The stages in this process are dashboard, business, marketing, technology, meter.
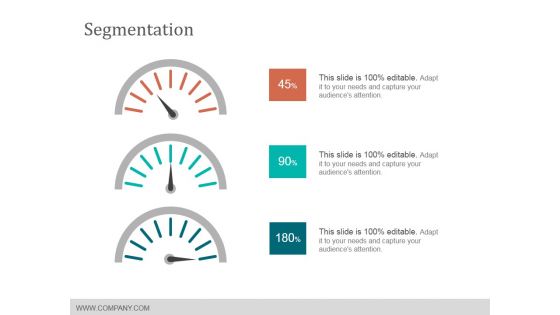
Segmentation Ppt PowerPoint Presentation Pictures Templates
This is a segmentation ppt powerpoint presentation pictures templates. This is a three stage process. The stages in this process are dashboard, business, measurement, finance.
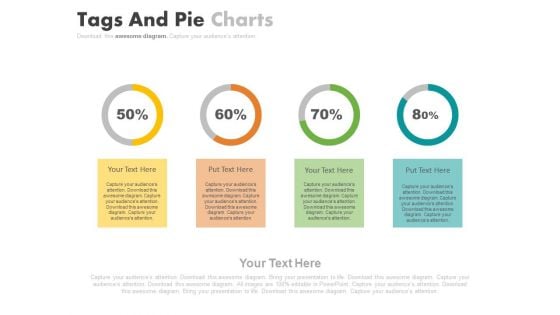
Four Steps For Financial Data Analysis Powerpoint Slides
This PowerPoint contains four circles with percentage values. Download this diagram slide to display financial data analysis. This template is editable, You can edit text, color, shade and style of this diagram as per you need.

Key Performance Indicators For Area Of Focus Powerpoint Slide Backgrounds
This is a key performance indicators for area of focus powerpoint slide backgrounds. This is a four stage process. The stages in this process are area of focus, metrics, targets, objectives, focus, measures, invites, vision and strategy.
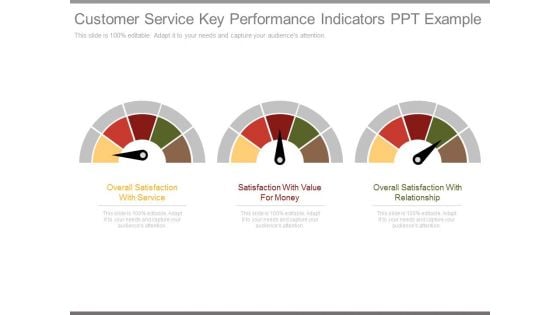
Customer Service Key Performance Indicators Ppt Example
This is a customer service key performance indicators ppt example. This is a three stage process. The stages in this process are overall satisfaction with service, satisfaction with value for money, overall satisfaction with relationship.
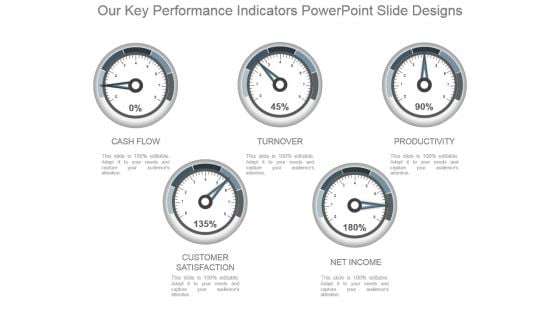
Our Key Performance Indicators Powerpoint Slide Designs
This is a our key performance indicators powerpoint slide designs. This is a five stage process. The stages in this process are cash flow, turnover, productivity, customer satisfaction, net income.
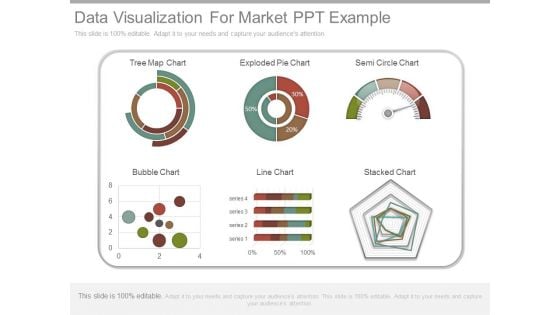
Data Visualization For Market Ppt Example
This is a data visualization for market ppt example. This is a six stage process. The stages in this process are tree map chart, exploded pie chart, semi circle chart, bubble chart, line chart, stacked chart, series.
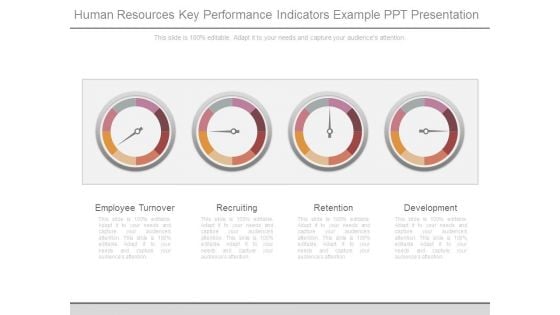
Human Resources Key Performance Indicators Example Ppt Presentation
This is a human resources key performance indicators example ppt presentation. This is a four stage process. The stages in this process are employee turnover, recruiting, retention, development.
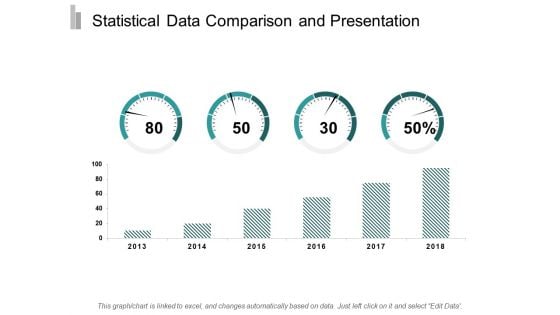
Statistical Data Comparison And Presentation Ppt Powerpoint Presentation Gallery Backgrounds
This is a statistical data comparison and presentation ppt powerpoint presentation gallery backgrounds. This is a two stage process. The stages in this process are data presentation, content presentation, information presentation.
Market Trends Chart With Icons Powerpoint Slides
This PowerPoint template has been designed with business info graphic chart. You may use this business slide design to display market trends. This PPT slide is powerful tool to describe your ideas.
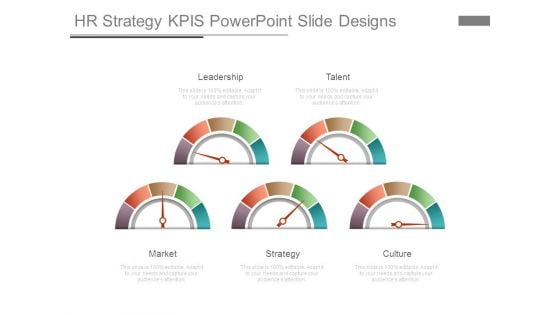
Hr Strategy Kpis Powerpoint Slide Designs
This is a hr strategy kpis powerpoint slide designs. This is a five stage process. The stages in this process are leadership, talent, market, strategy, culture.
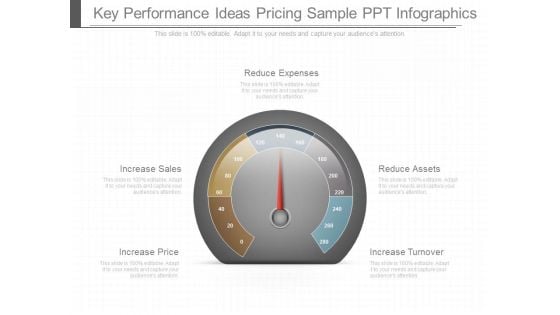
Key Performance Ideas Pricing Sample Ppt Infographics
This is a key performance ideas pricing sample ppt infographics. This is a five stage process. The stages in this process are increase price, increase sales, reduce expenses, reduce assets, increase turnover.
Four Circles With Social Communication Icons Powerpoint Slides
Concept of social communication can be well explained with this power point template. This PPT slide contains the four circles with communication icons. Use this diagram slide to make impressive presentations.
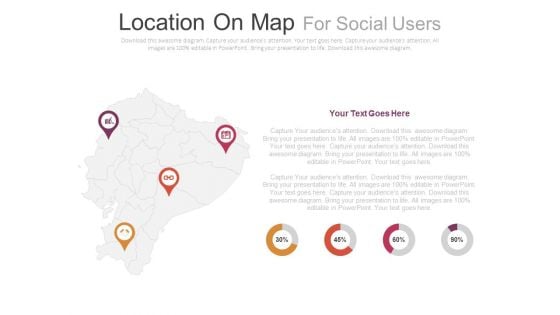
Four Locations On Map With Percentage Analysis Powerpoint Slides
This PowerPoint slide contains diagram of map with location pointers and icons. This professional slide helps to exhibit demographics of social media users. Use this PowerPoint template to make impressive presentations.
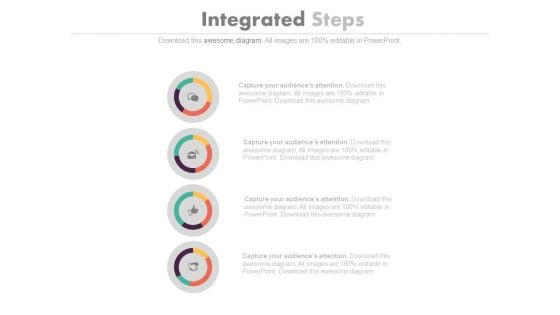
Four Steps For Business Plans Outline Powerpoint Slides
Visually support your presentation with our above template containing four circles with icons. This diagram slide helps to display business plan outline. Etch your views in the brains of your audience with this diagram slide.
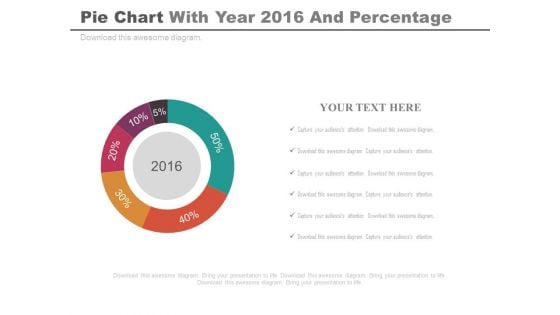
Pie Chart For Projected Profit Of 2016 Powerpoint Slides
Our above PPT slide displays graphics of Pie chart. This PowerPoint template may be used to display projected profit report of 2016. Download this template to leave permanent impression on your audience.
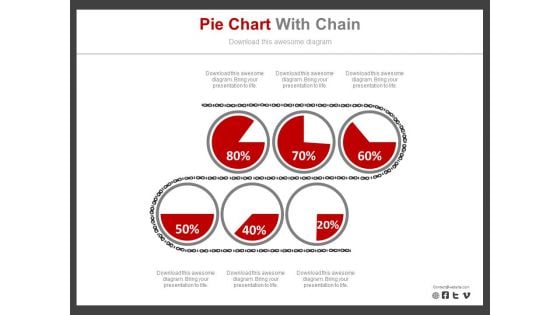
Six Pie Charts For Revenue Analysis Report Powerpoint Slides
Six pie charts have been displayed in this business slide. This business diagram helps to exhibit revenue analysis report. Download this PowerPoint template to build an exclusive presentation.
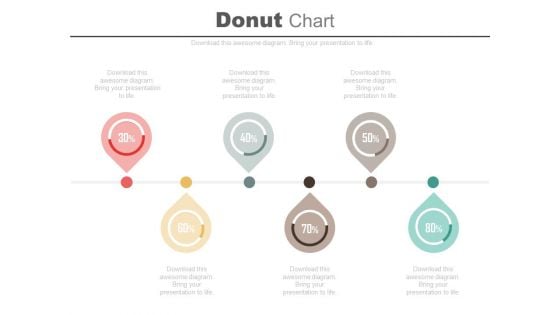
Six Pointers Percentage Timeline Diagram Powerpoint Slides
Profitability indicator ratios have been displayed this business slide. This PowerPoint template contains linear pointers timeline diagram. Use this professional diagram slide to build an exclusive presentation.
World Map With Location Pointers And Icons Powerpoint Slides
Develop competitive advantage with our above template which contains world map with location pointers. This diagram provides an effective way of displaying geographical information. You can edit text, color, shade and style as per you need.
Circle Diagram With Team Icon Powerpoint Slides
This PowerPoint template has been designed with circle diagram and team icons. You may download this PPT slide to display team planning and strategy. This PowerPoint template helps to display your information in a useful, simple and orderly way.
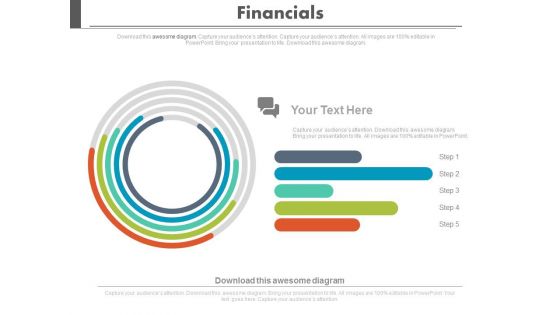
Financial Growth Analysis Circular Chart Powerpoint Slides
Visually support your presentation with our above template containing graphics of circular chart. This diagram slide helps to display financial growth analysis. Etch your views in the brains of your audience with this diagram slide.
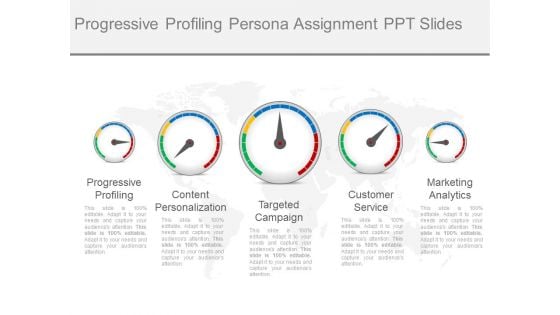
Progressive Profiling Persona Assignment Ppt Slides
This is a progressive profiling persona assignment ppt slides. This is a five stage process. The stages in this process are progressive profiling, content personalization, targeted campaign, customer service, marketing analytics.

Consensus Recommendations General Practitioners Ppt Slide
This is a consensus recommendations general practitioners ppt slide. This is a six stage process. The stages in this process are consensus recommendations, health care professionals, health agencies, professional societies, social media.
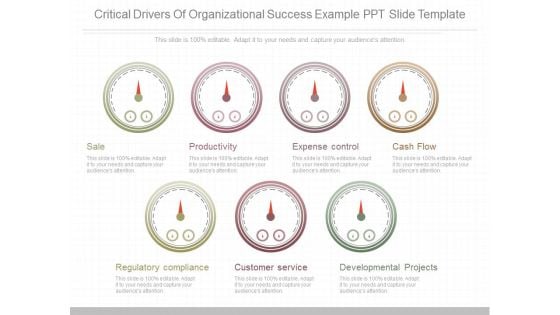
Critical Drivers Of Organizational Success Example Ppt Slide Template
This is a critical drivers of organizational success example ppt slide template. This is a seven stage process. The stages in this process are sale, productivity, expense control, cash flow, regulatory compliance, customer service, developmental projects.
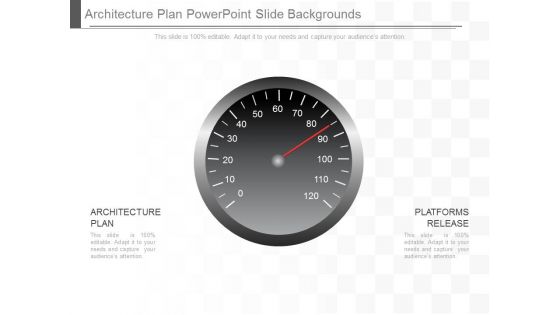
Architecture Plan Powerpoint Slide Backgrounds
This is a architecture plan powerpoint slide backgrounds. This is a two stage process. The stages in this process are architecture plan, platforms release.
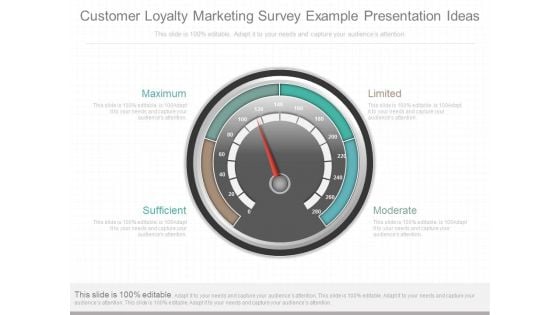
Customer Loyalty Marketing Survey Example Presentation Ideas
This is a customer loyalty marketing survey example presentation ideas. This is a four stage process. The stages in this process are sufficient, maximum, moderate, limited.
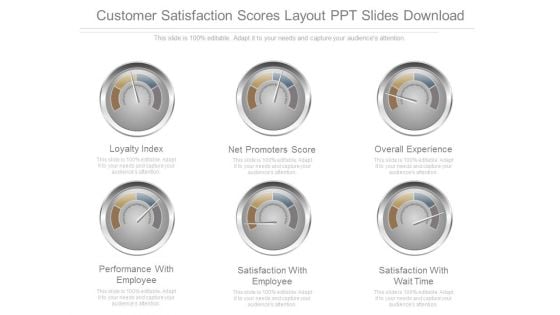
Customer Satisfaction Scores Layout Ppt Slides Download
This is a customer satisfaction scores layout ppt slides download. This is a six stage process. The stages in this process are loyalty index, net promoters score, overall experience, performance with employee, satisfaction with employee, satisfaction with wait time.
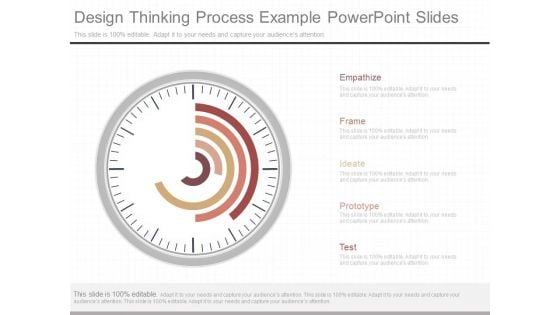
Design Thinking Process Example Powerpoint Slides
This is a design thinking process example powerpoint slides. This is a five stage process. The stages in this process are empathize, frame, ideate, prototype, test.
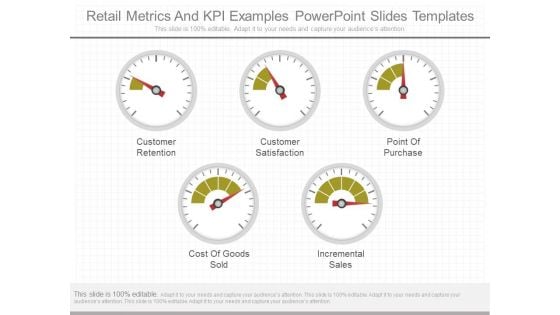
Retail Metrics And Kpi Examples Powerpoint Slides Templates
This is a retail metrics and kpi examples powerpoint slides templates. This is a five stage process. The stages in this process are customer retention, customer satisfaction, point of purchase, cost of goods sold, incremental sales.
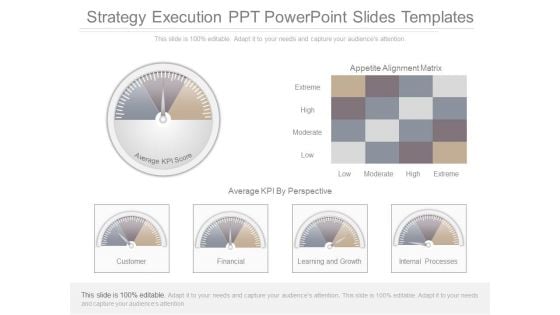
Strategy Execution Ppt Powerpoint Slides Templates
This is a strategy execution ppt powerpoint slides templates. This is a six stage process. The stages in this process are appetite alignment matrix, extreme, high, moderate, low, average kpi by prospective, customer, financial, learning and growth, internal processes, average kpi score.

Incremental Sales Kpi Measures Presentation Backgrounds
This is a incremental sales kpi measures presentation backgrounds. This is a four stage process. The stages in this process are marketing, promotion, sales revenue, social channels.
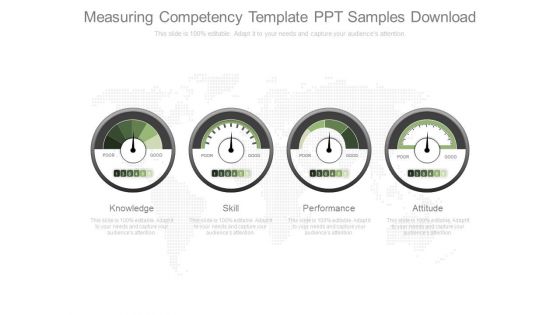
Measuring Competency Template Ppt Samples Download
This is a measuring competency template ppt samples download. This is a four stage process. The stages in this process are knowledge, skill, performance, attitude.
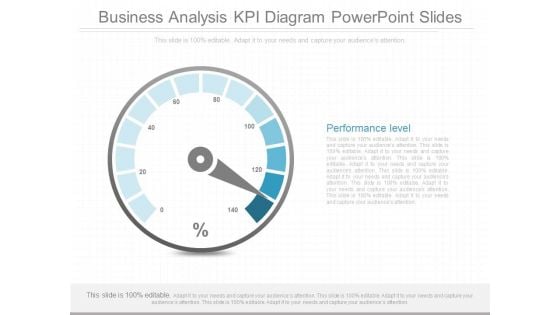
Business Analysis Kpi Diagram Powerpoint Slides
This is a business analysis kpi diagram powerpoint slides. This is a one stage process. The stages in this process are performance level.
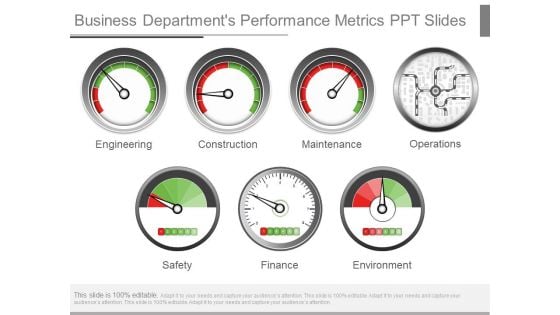
Business Departments Performance Metrics Ppt Slides
This is a business departments performance metrics ppt slides. This is a seven stage process. The stages in this process are engineering, construction, maintenance, operations, safety, finance, environment.
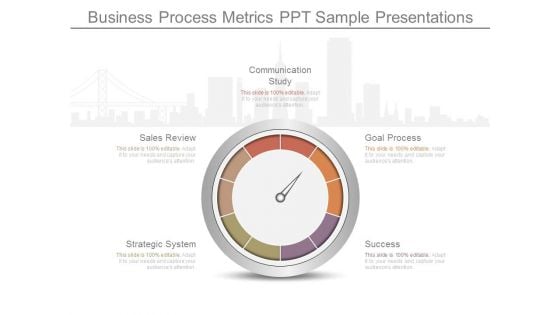
Business Process Metrics Ppt Sample Presentations
This is a business process metrics ppt sample presentations. This is a five stage process. The stages in this process are communication study, goal process, success, strategic system, sales review.
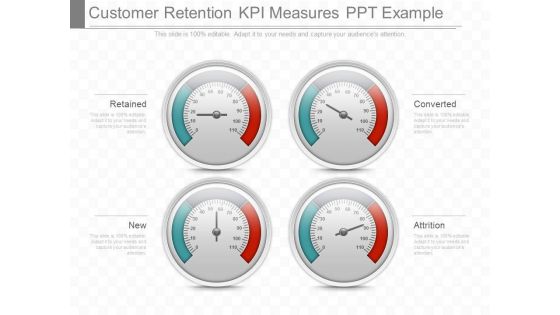
Customer Retention Kpi Measures Ppt Example
This is a customer retention kpi measures ppt example. This is a four stage process. The stages in this process are retained, new, converted, attrition.
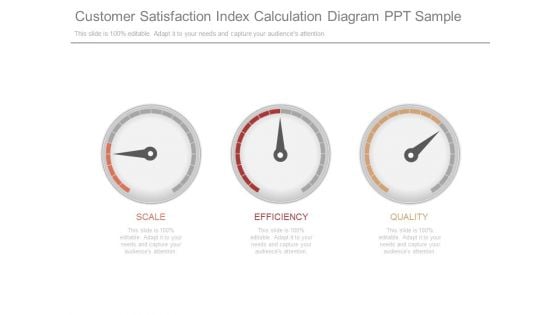
Customer Satisfaction Index Calculation Diagram Ppt Sample
This is a customer satisfaction index calculation diagram ppt sample. This is a three stage process. The stages in this process are scale, efficiency, quality.


 Continue with Email

 Home
Home


