Dashboards
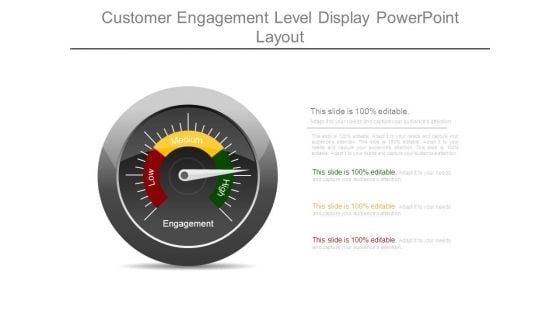
Customer Engagement Level Display Powerpoint Layout
This is a customer engagement level display powerpoint layout. This is a one stage process. The stages in this process are low, medium, high, engagement.
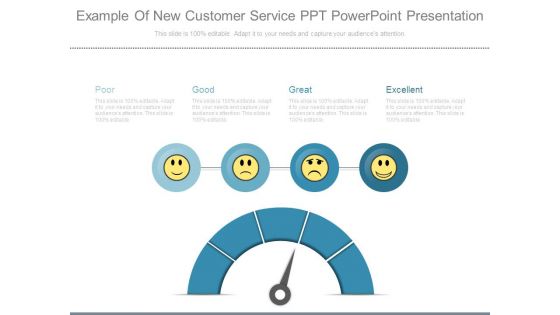
Example Of New Customer Service Ppt Powerpoint Presentation
This is a example of new customer service ppt powerpoint presentation. This is a five stage process. The stages in this process are poor, good, great, excellent.
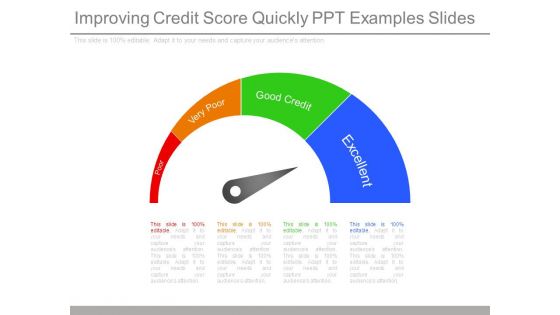
Improving Credit Score Quickly Ppt Examples Slides
This is a improving credit score quickly ppt examples slides. This is a four stage process. The stages in this process are poor, very poor, good credit, excellent.
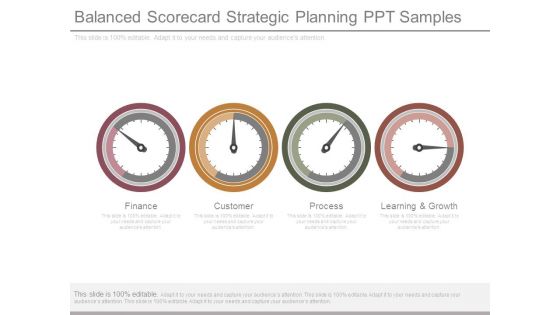
Balanced Scorecard Strategic Planning Ppt Samples
This is a balanced scorecard strategic planning ppt samples. This is a four stage process. The stages in this process are finance, customer, process, learning and growth.
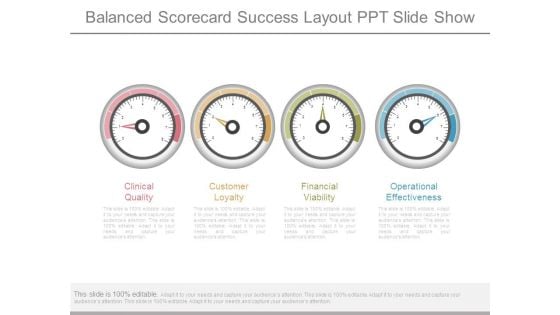
Balanced Scorecard Success Layout Ppt Slide Show
This is a balanced scorecard success layout ppt slide show. This is a four stage process. The stages in this process are clinical quality, customer loyalty, financial viability, operational effectiveness.
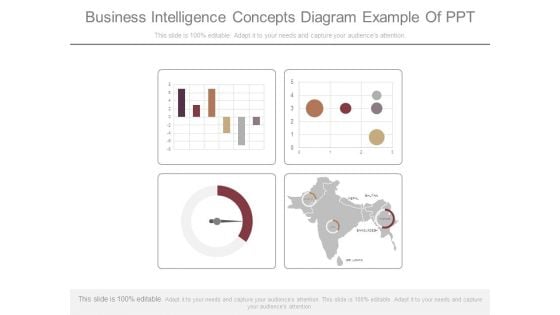
Business Intelligence Concepts Diagram Example Of Ppt
This is a business intelligence concepts diagram example of ppt. This is a four stage process. The stages in this process are location, measuring, business, strategy, management.
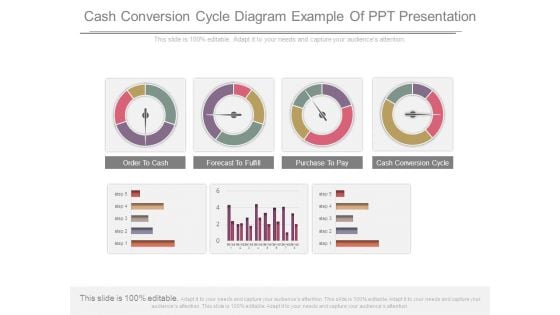
Cash Conversion Cycle Diagram Example Of Ppt Presentation
This is a cash conversion cycle diagram example of ppt presentation. This is a four stage process. The stages in this process are order to cash, forecast to fulfill, purchase to pay, cash conversion cycle.
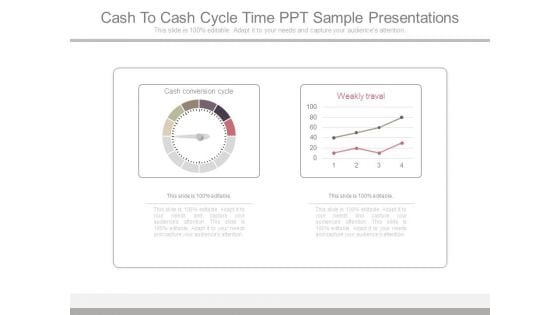
Cash To Cash Cycle Time Ppt Sample Presentations
This is a cash to cash cycle time ppt sample presentations. This is a two stage process. The stages in this process are cash conversion cycle, weakly traval.
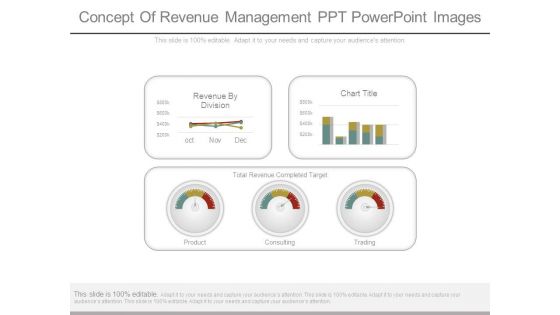
Concept Of Revenue Management Ppt Powerpoint Images
This is a concept of revenue management ppt powerpoint images. This is a five stage process. The stages in this process are revenue by division, chart title, total revenue completed target, product, consulting, trading.
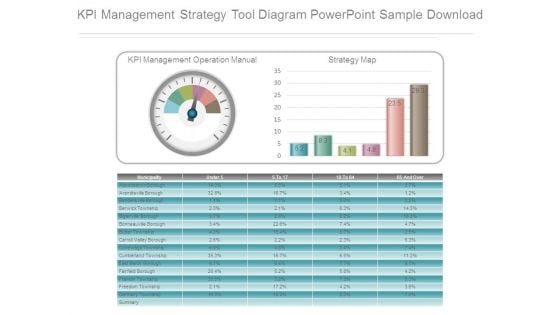
Kpi Management Strategy Tool Diagram Powerpoint Sample Download
This is a kpi management strategy tool diagram powerpoint sample download. This is a one stage process. The stages in this process are kpi management operation manual, strategy map.
Kpi Tracking Software Services Ppt Powerpoint Graphics
This is a kpi tracking software services ppt powerpoint graphics. This is a three stage process. The stages in this process are operations, revenue, manufacturing.
Entrepreneurship And Innovation Management Ppt Icon
This is a entrepreneurship and innovation management ppt icon. This is a four stage process. The stages in this process are vision, mission, strategy, action plan.

Product Quality Check Meter Presentation Layouts
This is a product quality check meter presentation layouts. This is a five stage process. The stages in this process are bad, poor, average, good, excellent.
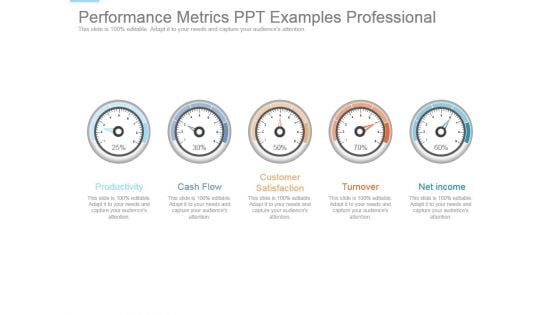
Performance Metrics Ppt Examples Professional
This is a performance metrics ppt examples professional. This is a five stage process. The stages in this process are productivity, cash flow, customer satisfaction, turnover, net income.
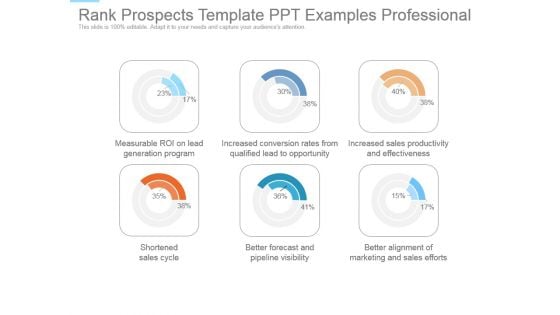
Rank Prospects Template Ppt Examples Professional
This is a rank prospects template ppt examples professional. This is a six stage process. The stages in this process are measurable roi on lead generation program, increased conversion rates from qualified lead to opportunity, increased sales productivity and effectiveness, shortened sales cycle, better forecast and pipeline visibility, better alignment of marketing and sales efforts.
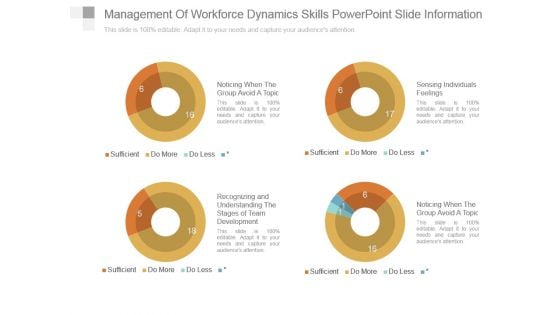
Management Of Workforce Dynamics Skills Powerpoint Slide Information
This is a management of workforce dynamics skills powerpoint slide information. This is a four stage process. The stages in this process are noticing when the group avoid a topic, recognizing and understanding the, stages of team development, sensing individuals feelings, noticing when the group avoid a topic.
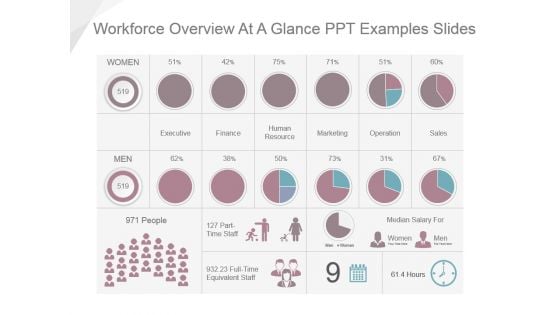
Workforce Overview At A Glance Ppt Examples Slides
This is a workforce overview at a glance ppt examples slides. This is a seven stage process. The stages in this process are executive, finance, human resource, marketing, operation, sales, median salary for.
Accelerator Meter Speed Icon Ppt Powerpoint Presentation Professional Good
This is a accelerator meter speed icon ppt powerpoint presentation professional good. This is a three stage process. The stages in this process are accelerator, seed accelerators, startup accelerator.
Accelerator Speed Meter Icon Ppt Powerpoint Presentation Outline Layout
This is a accelerator speed meter icon ppt powerpoint presentation outline layout. This is a four stage process. The stages in this process are accelerator, seed accelerators, startup accelerator.
Speed Level Meter Icon Ppt Powerpoint Presentation Inspiration Slides
This is a speed level meter icon ppt powerpoint presentation inspiration slides. This is a four stage process. The stages in this process are accelerator, seed accelerators, startup accelerator.
Speed Meter Vector Icon Ppt Powerpoint Presentation Model Inspiration
This is a speed meter vector icon ppt powerpoint presentation model inspiration. This is a four stage process. The stages in this process are accelerator, seed accelerators, startup accelerator.
Speedometer Vector Icon Ppt Powerpoint Presentation Gallery Objects
This is a speedometer vector icon ppt powerpoint presentation gallery objects. This is a four stage process. The stages in this process are accelerator, seed accelerators, startup accelerator.
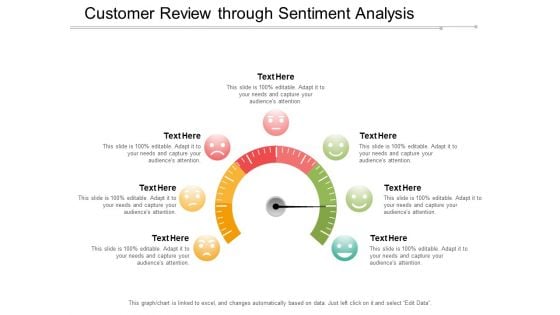
Customer Review Through Sentiment Analysis Ppt Powerpoint Presentation Show Design Templates
This is a customer review through sentiment analysis ppt powerpoint presentation show design templates. This is a six stage process. The stages in this process are feeling, emotion, sentiment.

Circles With Team Photos Powerpoint Slides
This dashboard template contains graphics of circles with team photos. This dashboard PowerPoint template conveys employees performance in a visual manner. Download this PPT slide for quick decision-making.
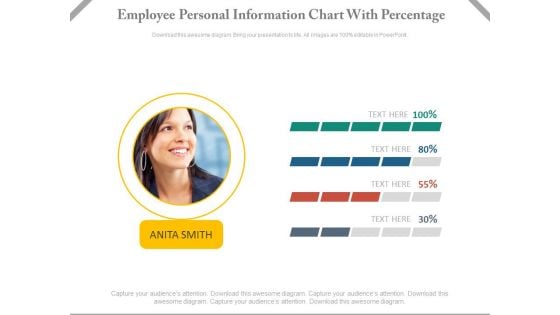
Employee Performance Information Chart Powerpoint Slides
This dashboard template contains employee picture with percentage slides. This dashboard PowerPoint template conveys employees performance in a visual manner. Download this PPT slide for quick decision-making.

Employee Photo With Percentage Bars Powerpoint Slides
This dashboard template contains employee photo with percentage bars. This dashboard PowerPoint template conveys employees performance in a visual manner. Download this PPT slide for quick decision-making.
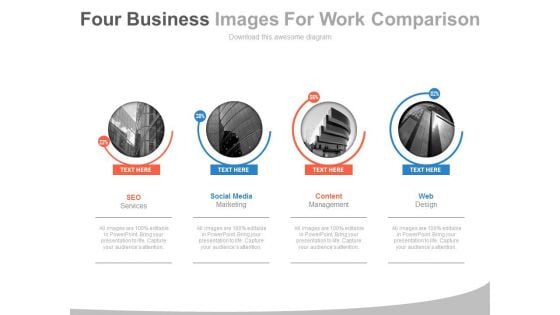
Four Companies With Web Services Powerpoint Slides
This PowerPoint template display graphics of four corporate buildings. You may use this PPT slide for financial and strategic analysis for web services companies. This dashboard slide may useful for multilevel status report creation and approval process.
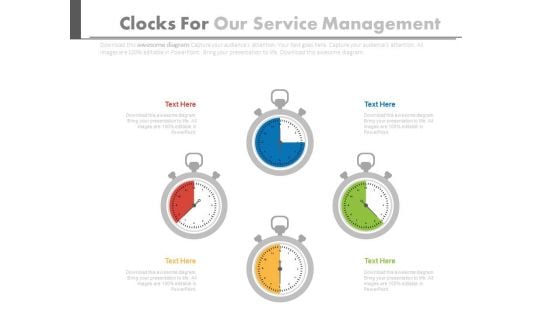
Four Stopwatches In Pie Chart Style Powerpoint Slides
This PPT slide has been designed with graphics of four stop watches in pie chart style. You may sue this PowerPoint template for time management. This dashboard slide may useful for multilevel status report creation and approval process.
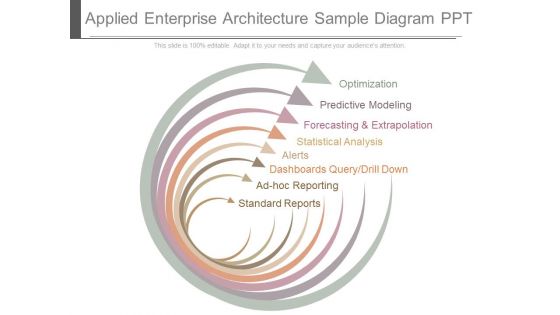
Applied Enterprise Architecture Sample Diagram Ppt
This is a applied enterprise architecture sample diagram ppt. This is a eight stage process. The stages in this process are optimization, predictive modeling, forecasting and extrapolation, statistical analysis, alerts, dashboards query/drill down, ad-hoc reporting, standard reports.
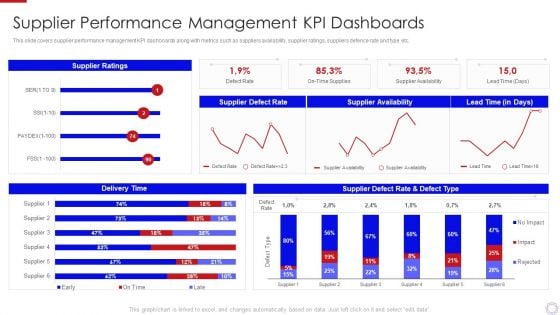
Major Strategies To Nurture Effective Vendor Association Supplier Performance Management Information PDF
This slide covers supplier performance management KPI dashboards along with metrics such as suppliers availability, supplier ratings, suppliers defence rate and type etc. Deliver and pitch your topic in the best possible manner with this major strategies to nurture effective vendor association supplier performance management information pdf. Use them to share invaluable insights on supplier performance management kpi dashboards and impress your audience. This template can be altered and modified as per your expectations. So, grab it now.
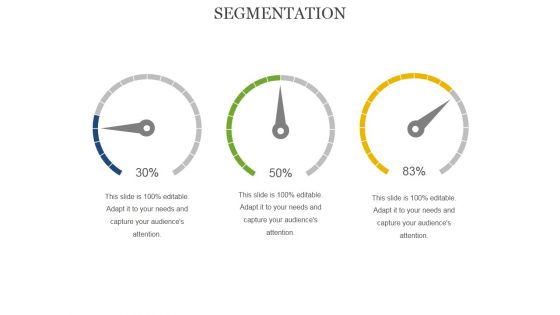
Segmentation Ppt PowerPoint Presentation Layouts Display
This is a segmentation ppt powerpoint presentation layouts display. This is a three stage process. The stages in this process are segmentation, dashboard, technology, communication, business.
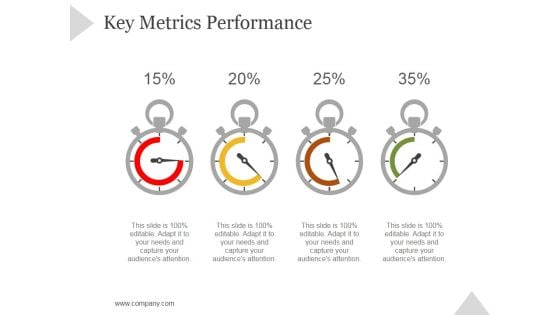
Key Metrics Performance Ppt PowerPoint Presentation Tips
This is a key metrics performance ppt powerpoint presentation tips. This is a four stage process. The stages in this process are business, strategy, marketing, success, dashboard, measuring.
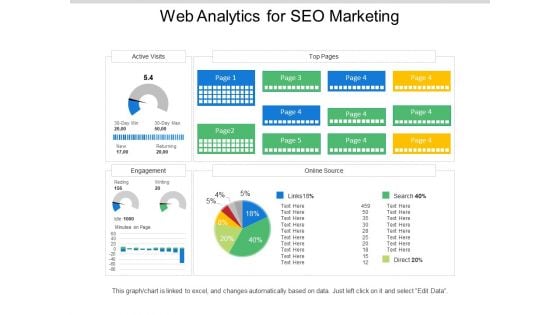
Web Analytics For Seo Marketing Ppt PowerPoint Presentation Examples
This is a web analytics for seo marketing ppt powerpoint presentation examples. This is a five stage process. The stages in this process are digital analytics, digital dashboard, marketing.
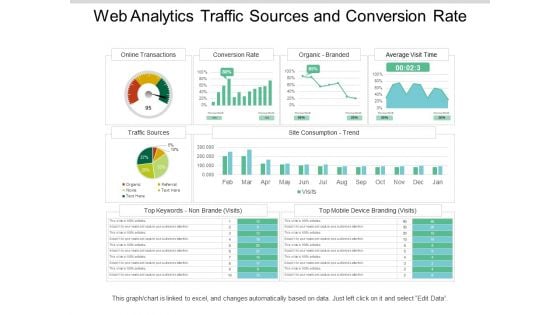
Web Analytics Traffic Sources And Conversion Rate Ppt PowerPoint Presentation Picture
This is a web analytics traffic sources and conversion rate ppt powerpoint presentation picture. This is a four stage process. The stages in this process are digital analytics, digital dashboard, marketing.
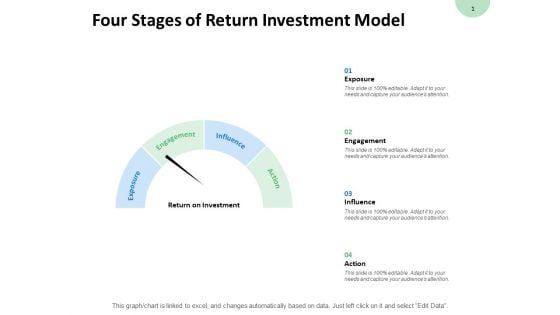
Four Stages Of Return Investment Model Engagement Ppt PowerPoint Presentation Inspiration Layout Ideas
Presenting this set of slides with name four stages of return investment model engagement ppt powerpoint presentation inspiration layout ideas. This is a four stage process. The stages in this process are dashboard, marketing, management, investment, analysis. This is a completely editable PowerPoint presentation and is available for immediate download. Download now and impress your audience.
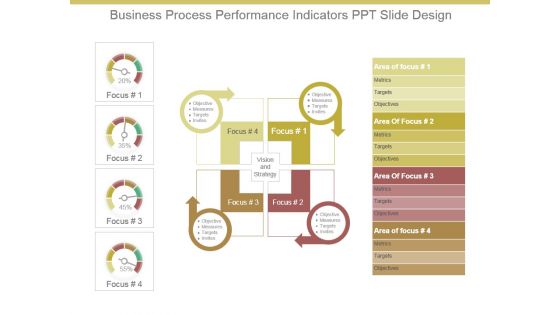
Business Process Performance Indicators Ppt Slide Design
This is a business process performance indicators ppt slide design. This is a four stage process. The stages in this process are focus, objective, measures, targets, invites, vision and strategy, area of focus, metrics, targets, objectives.
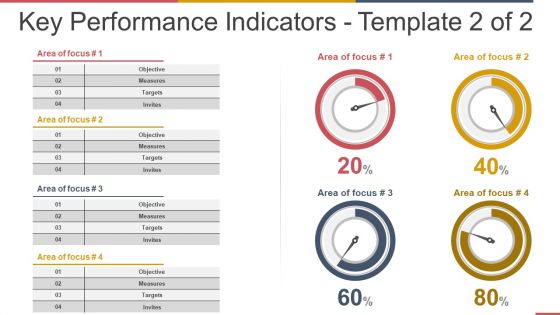
Key Performance Indicators Template 2 Ppt PowerPoint Presentation Ideas Background Images
This is a key performance indicators template 2 ppt powerpoint presentation ideas background images. This is a four stage process. The stages in this process are objective, measures, targets, invites.
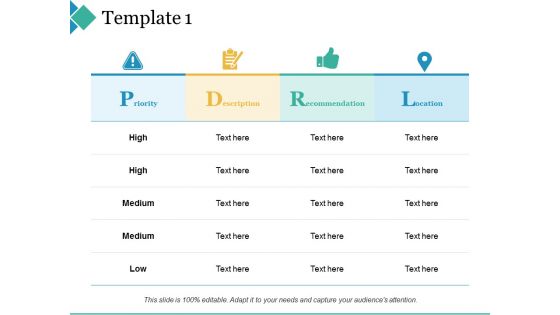
Template 1 Ppt PowerPoint Presentation Infographic Template Format Ideas
This is a template 1 ppt powerpoint presentation infographic template format ideas. This is a four stage process. The stages in this process are priority, description, recommendation, location.
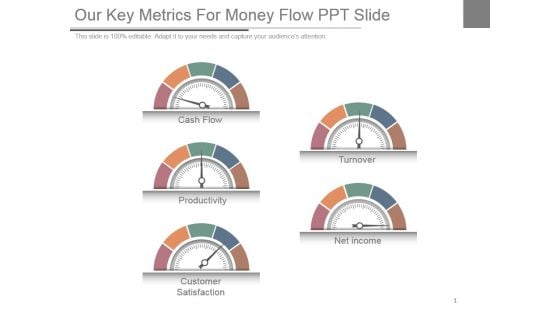
Our Key Metrics For Money Flow Ppt Slide
This is a our key metrics for money flow ppt slide. This is a five stage process. The stages in this process are cash flow, productivity, customer satisfaction, turnover, net income.
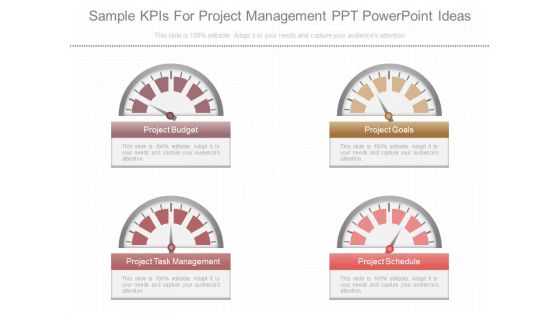
Sample Kpis For Project Management Ppt Powerpoint Ideas
This is a sample kpis for project management ppt powerpoint ideas. This is a four stage process. The stages in this process are project budget, project goals, project task management, project schedule.
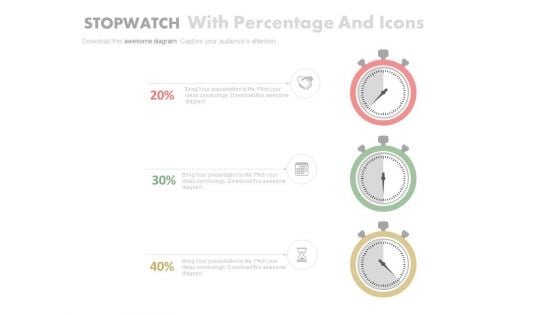
Three Stopwatches To Display Profit Trends Powerpoint Slides
This PowerPoint template has been designed with graphics of three stopwatches. Use this PPT slide to depict profit trends. Download this template to make impressive presentations.

Revenue Performance Reporting Speedometer Ppt PowerPoint Presentation Visuals
This is a revenue performance reporting speedometer ppt powerpoint presentation visuals. This is a four stage process. The stages in this process are speedometer, measurement, business, marketing, finance.

Four Arrows Circular Diagram For Business Process Powerpoint Slides
This PowerPoint template contains graphics of circular diagram. This PowerPoint template helps to conveys business processes in a visual manner. Download this PPT slide for quick decision-making.
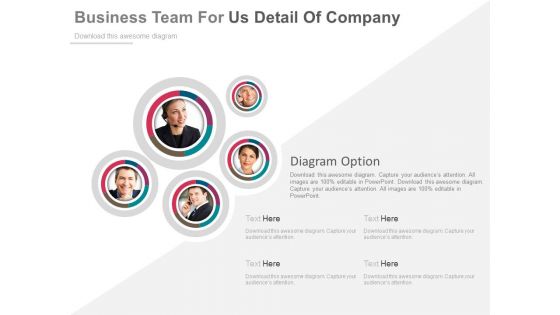
Illustration Of Customer Support Team Powerpoint Slides
On this template you can see team of five persons. This PowerPoint slide is an excellent tool for announcing the members of customer care team. Give a detailed introduction of your team with complete profile information.
Linear Steps Timeline Chart And Icons Powerpoint Slides
This PowerPoint template graphics of linear timeline steps. Download this PPT chart for yearly business performance analysis. This PowerPoint slide is of great help in the business sector to make realistic presentations and provides effective way of presenting your newer thoughts.

Mobile For Team Performance Analysis Powerpoint Slides
This PowerPoint template graphics of mobile with team members photos. Download this PPT slide for team performance analysis. This PowerPoint slide is of great help in the business sector to make realistic presentations and provides effective way of presenting your newer thoughts.
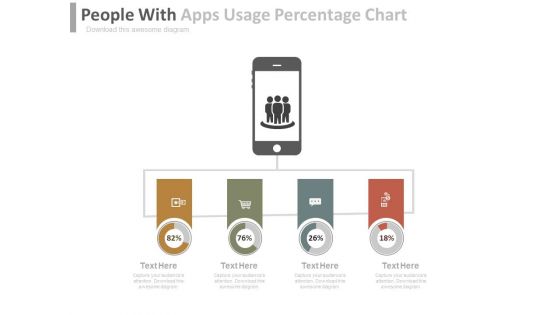
Team Efforts For Company Growth Powerpoint Slides
This PowerPoint template has been designed with mobile and four tags. Use this PPT slide to depict team efforts for companys growth. Download this template to make impressive presentations.
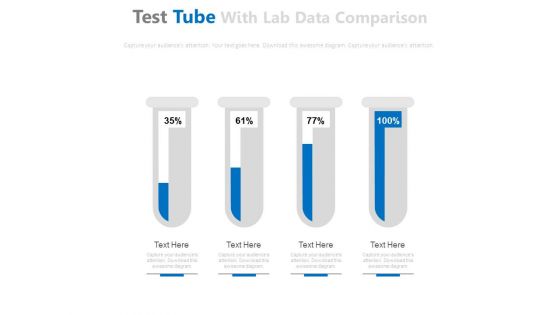
Test Tubes For Financial Ratio Analysis Powerpoint Slides
This PowerPoint template has been designed with graphics of test tubes. Use this PPT slide to depict financial ratio analysis. Download this PPT template to make impressive presentations.
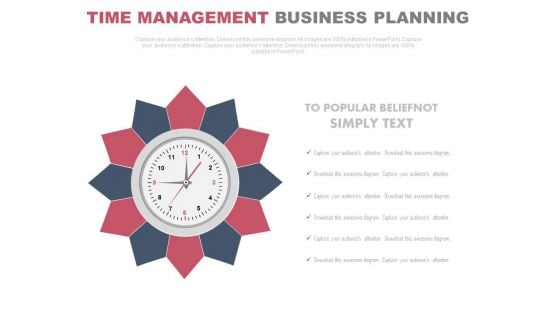
Clock For Strategic Time Management And Business Vision Powerpoint Slides
Our above PPT slide contains flower clock design. This professional slide may be used to display strategic time management. Enlighten your audience with your breathtaking ideas.
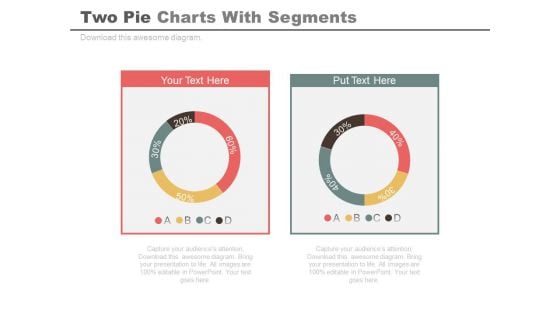
Two Pie Charts For Comparison And Analysis Powerpoint Slides
Develop competitive advantage with our above template of two pie charts. This PowerPoint diagram provides an effective way of displaying business information. You can edit text, color, shade and style as per you need.
Four Circles With Percentage Values And Icons Powerpoint Slides
This PowerPoint template displays info graphic diagram of linear circles. This diagram may be used to exhibit financial growth and analysis. Grab center stage with this slide and capture the attention of your audience.
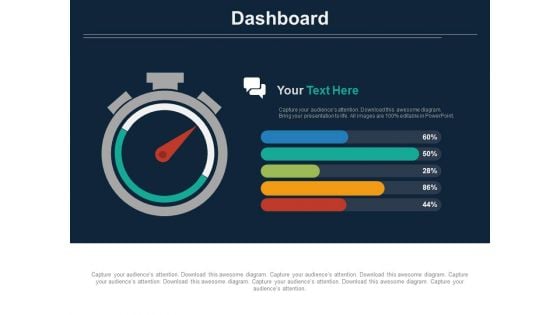
Stopwatch With Percentage Value Analysis Powerpoint Slides
The above template displays a diagram of stopwatch with percentage value. This diagram has been professionally designed to emphasize on time management. Grab center stage with this slide and capture the attention of your audience.
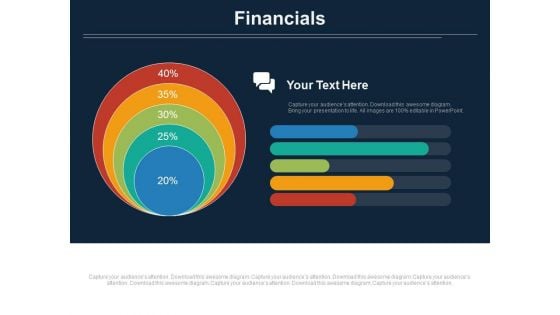
Concentric Chart With Five Financial Steps Powerpoint Slides
This PowerPoint slide contains diagram of concentric chart with five financial steps This professional slide helps to exhibit financial planning for business. Use this PowerPoint template to make impressive presentations.
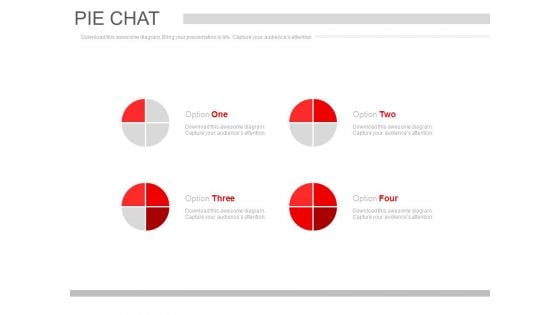
Pie Charts For Market Segmentation Powerpoint Slides
This PowerPoint contains graphics of pie charts. Download this diagram slide to display market segmentations. This template is editable, You can edit text, color, shade and style of this diagram as per you need.
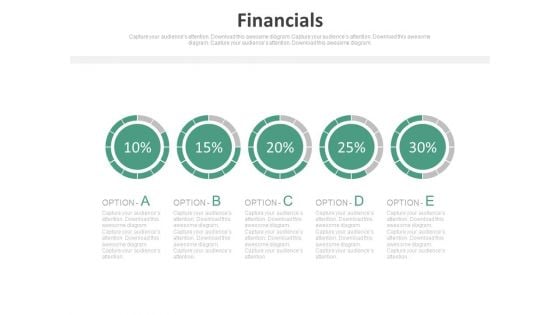
Pie Charts For Percentage Value Analysis Powerpoint Slides
Our above PPT slide displays graphics of Pie charts. This PowerPoint template may be used to display percentage value analysis. Download this template to leave permanent impression on your audience.
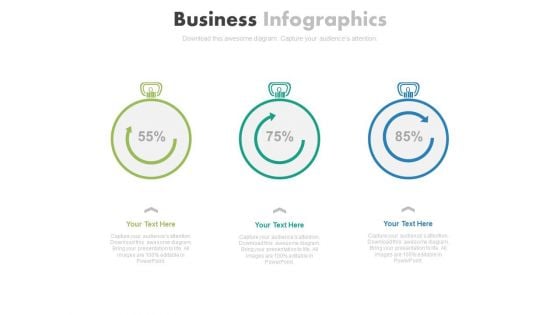
Three Stopwatches For Percentage Growth Powerpoint Slides
Three stopwatches have been displayed in this business slide. This business diagram helps to exhibit parameters of growth and development. Download this PowerPoint template to build an exclusive presentation.
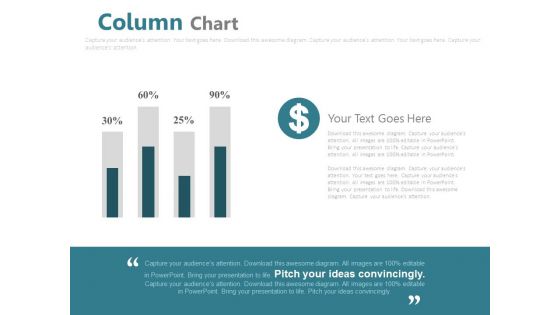
Column Chart For Financial Analysis Powerpoint Slides
This PowerPoint template has been designed with graphics of column chart with percentage values. You may use this business slide design for topics like financial analysis and planning. This PPT slide is powerful tool to describe your ideas.
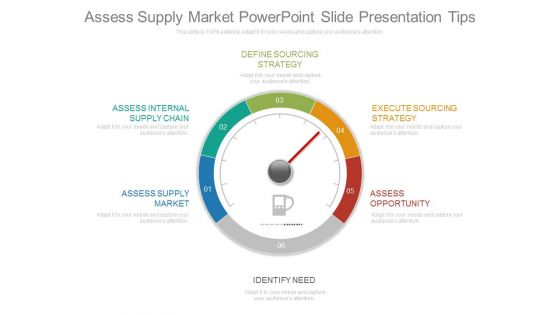
Assess Supply Market Powerpoint Slide Presentation Tips
This is a assess supply market powerpoint slide presentation tips. This is a six stage process. The stages in this process are define sourcing strategy, assess internal supply chain, execute sourcing strategy, assess supply market, assess opportunity, identify need.
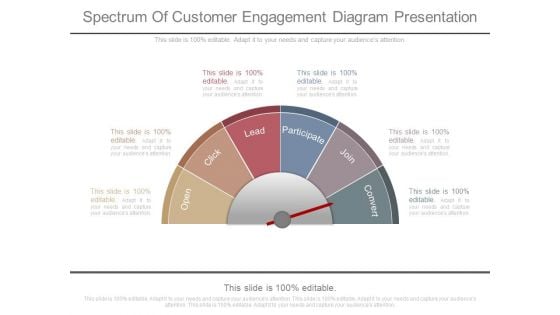
Spectrum Of Customer Engagement Diagram Presentation
This is a spectrum of customer engagement diagram presentation. This is a six stage process. The stages in this process are open, click, lead, participate, join, convert.
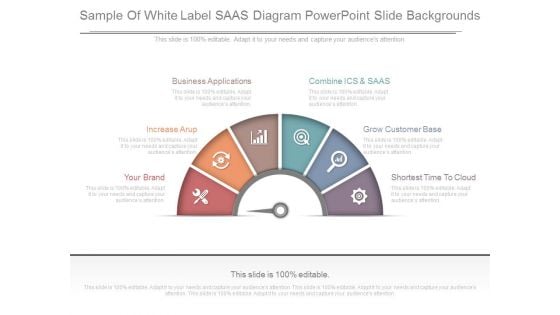
Sample Of White Label Saas Diagram Powerpoint Slide Backgrounds
This is a sample of white label saas diagram powerpoint slide backgrounds. This is a six stage process. The stages in this process are your brand, increase arup, business applications, combine ics and saas, grow customer base, shortest time to cloud.


 Continue with Email

 Home
Home


