Dashboards
Metrics Showcasing Project Management Operations Icons PDF
This slide exhibits project management operations dashboard. It covers task status, budget status, pending tasks, activity progress status etc to track project progress. Showcasing this set of slides titled Metrics Showcasing Project Management Operations Icons PDF. The topics addressed in these templates are Metrics Showcasing, Project Management Operations. All the content presented in this PPT design is completely editable. Download it and make adjustments in color, background, font etc. as per your unique business setting.
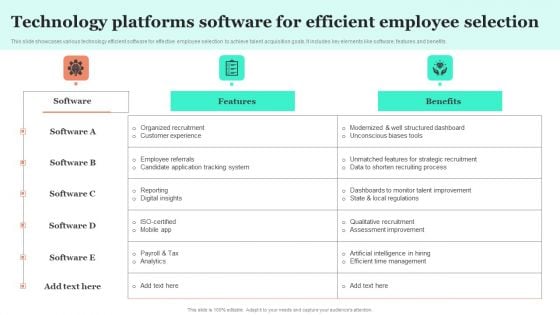
Technology Platforms Software For Efficient Employee Selection Elements PDF
This slide showcases various technology efficient software for effective employee selection to achieve talent acquisition goals. It includes key elements like software, features and benefits. Showcasing this set of slides titled Technology Platforms Software For Efficient Employee Selection Elements PDF. The topics addressed in these templates are Application Tracking System, Organized Recruitment, Structured Dashboard. All the content presented in this PPT design is completely editable. Download it and make adjustments in color, background, font etc. as per your unique business setting.
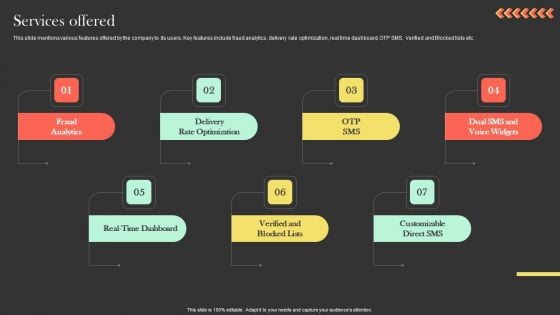
Services Offered Ringcaptcha Capital Funding Pitch Deck Rules PDF
This slide mentions various features offered by the company to its users. Key features include fraud analytics, delivery rate optimization, real time dashboard, OTP SMS, Verified and Blocked lists etc. There are so many reasons you need a Services Offered Ringcaptcha Capital Funding Pitch Deck Rules PDF. The first reason is you can not spend time making everything from scratch, Thus, Slidegeeks has made presentation templates for you too. You can easily download these templates from our website easily.
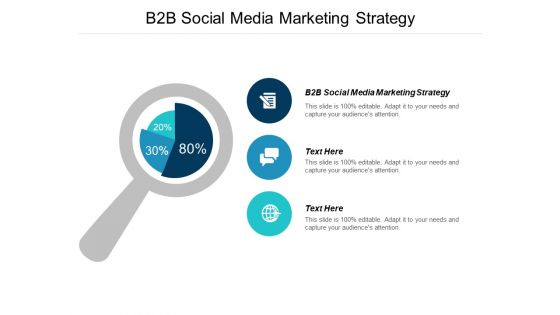
B2B Social Media Marketing Strategy Ppt PowerPoint Presentation Outline Influencers
This is a b2b social media marketing strategy ppt powerpoint presentation outline influencers. This is a three stage process. The stages in this process are b2b social media marketing strategy.
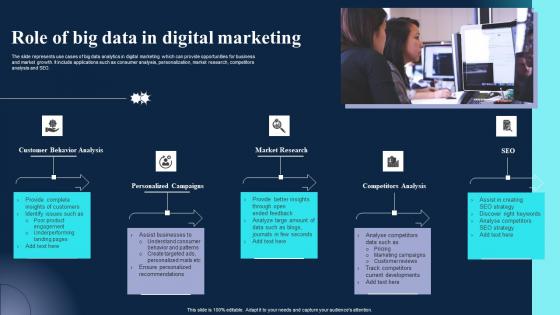
Role Of Big Data In Digital Marketing Information Pdf
The slide represents use cases of big data analytics in digital marketing which can provide opportunities for business and market growth. It include applications such as consumer analysis, personalization, market research, competitors analysis and SEO. Pitch your topic with ease and precision using this Role Of Big Data In Digital Marketing Information Pdf. This layout presents information on Behavior Analysis, Personalized Campaigns, Market Research. It is also available for immediate download and adjustment. So, changes can be made in the color, design, graphics or any other component to create a unique layout. The slide represents use cases of big data analytics in digital marketing which can provide opportunities for business and market growth. It include applications such as consumer analysis, personalization, market research, competitors analysis and SEO.
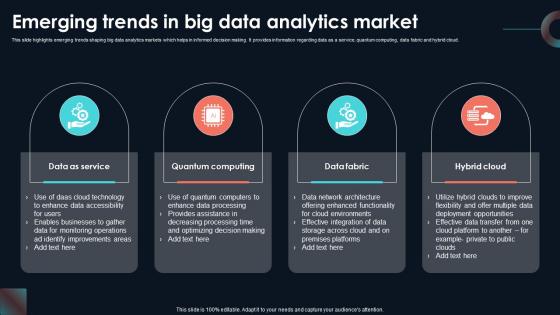
Emerging Trends In Big Data Analytics Developing Strategic Insights Using Big Data Analytics SS V
This slide highlights emerging trends shaping big data analytics markets which helps in informed decision making. It provides information regarding data as a service, quantum computing, data fabric and hybrid cloud. The Emerging Trends In Big Data Analytics Developing Strategic Insights Using Big Data Analytics SS V is a compilation of the most recent design trends as a series of slides. It is suitable for any subject or industry presentation, containing attractive visuals and photo spots for businesses to clearly express their messages. This template contains a variety of slides for the user to input data, such as structures to contrast two elements, bullet points, and slides for written information. Slidegeeks is prepared to create an impression. This slide highlights emerging trends shaping big data analytics markets which helps in informed decision making. It provides information regarding data as a service, quantum computing, data fabric and hybrid cloud.
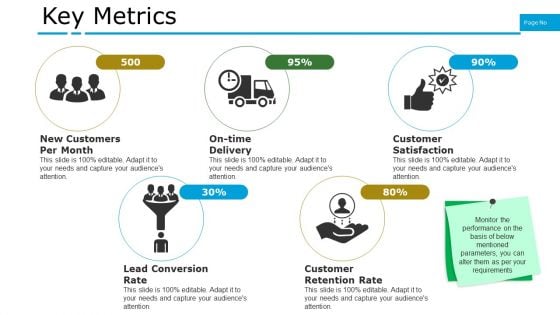
Key Metrics Ppt PowerPoint Presentation Infographics Example Topics
This is a key metrics ppt powerpoint presentation infographics example topics. This is a five stage process. The stages in this process are new customers per month, on time delivery, customer satisfaction, lead conversion rate, customer retention rate.
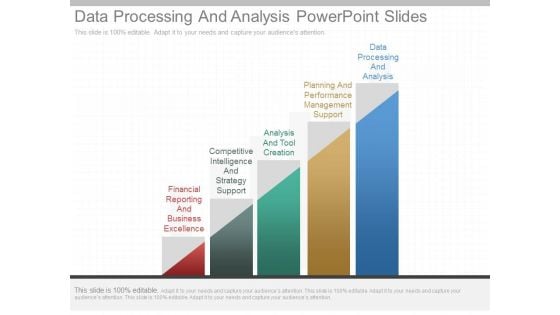
Data Processing And Analysis Powerpoint Slides
This is a data processing and analysis powerpoint slides. This is a five stage process. The stages in this process are financial reporting and business excellence, competitive intelligence and strategy support, analysis and tool creation, planning and performance management support, data processing and analysis.
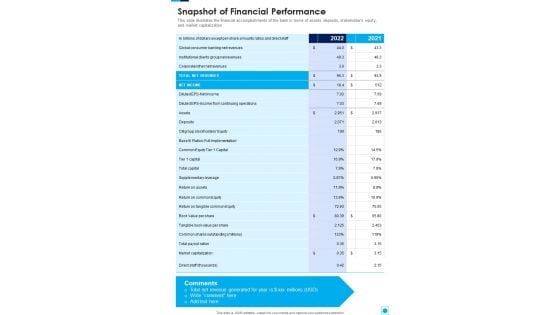
Snapshot Of Financial Performance One Pager Documents
This slide illustrates the financial accomplishments of the bank in terms of assets, deposits, stakeholders equity, and market capitalization. Presenting you a fantastic Snapshot Of Financial Performance One Pager Documents. This piece is crafted on hours of research and professional design efforts to ensure you have the best resource. It is completely editable and its design allow you to rehash its elements to suit your needs. Get this Snapshot Of Financial Performance One Pager Documents A4 One-pager now.

Key Metrics Used To Track Product Analytics Product Analytics Implementation Data Analytics V
This slide outlines major metrics used by businesses to analyse product performance aimed at making necessary improvements. It covers key metrics such as engagement, retention, customer lifetime value, number of crashes and feature adoption rate with benefits Do you know about Slidesgeeks Key Metrics Used To Track Product Analytics Product Analytics Implementation Data Analytics V These are perfect for delivering any kind od presentation. Using it, create PowerPoint presentations that communicate your ideas and engage audiences. Save time and effort by using our pre-designed presentation templates that are perfect for a wide range of topic. Our vast selection of designs covers a range of styles, from creative to business, and are all highly customizable and easy to edit. Download as a PowerPoint template or use them as Google Slides themes. This slide outlines major metrics used by businesses to analyse product performance aimed at making necessary improvements. It covers key metrics such as engagement, retention, customer lifetime value, number of crashes and feature adoption rate with benefits
Financial Report Review Procedure Icon Demonstration PDF
Presenting Financial Report Review Procedure Icon Demonstration PDF to dispense important information. This template comprises Four stages. It also presents valuable insights into the topics includingFinancial Report, Review Procedure Icon. This is a completely customizable PowerPoint theme that can be put to use immediately. So, download it and address the topic impactfully.
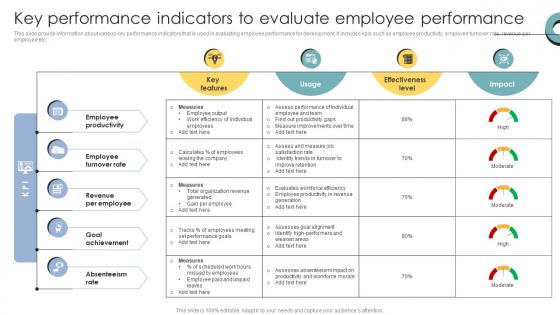
Skill Enhancement Performance Key Performance Indicators To Evaluate Employee Performance
This slide provide information about various key performance indicators that is used in evaluating employee performance for development. It includes kpis such as employee productivity, employee turnover rate, revenue per employee etc. Get a simple yet stunning designed Skill Enhancement Performance Key Performance Indicators To Evaluate Employee Performance. It is the best one to establish the tone in your meetings. It is an excellent way to make your presentations highly effective. So, download this PPT today from Slidegeeks and see the positive impacts. Our easy-to-edit Skill Enhancement Performance Key Performance Indicators To Evaluate Employee Performance can be your go-to option for all upcoming conferences and meetings. So, what are you waiting for Grab this template today. This slide provide information about various key performance indicators that is used in evaluating employee performance for development. It includes kpis such as employee productivity, employee turnover rate, revenue per employee etc.
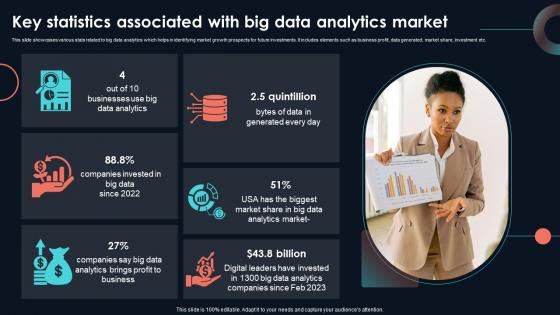
Key Statistics Associated With Big Data Developing Strategic Insights Using Big Data Analytics SS V
This slide showcases various stats related to big data analytics which helps in identifying market growth prospects for future investments. It includes elements such as business profit, data generated, market share, investment etc. If you are looking for a format to display your unique thoughts, then the professionally designed Key Statistics Associated With Big Data Developing Strategic Insights Using Big Data Analytics SS V is the one for you. You can use it as a Google Slides template or a PowerPoint template. Incorporate impressive visuals, symbols, images, and other charts. Modify or reorganize the text boxes as you desire. Experiment with shade schemes and font pairings. Alter, share or cooperate with other people on your work. Download Key Statistics Associated With Big Data Developing Strategic Insights Using Big Data Analytics SS V and find out how to give a successful presentation. Present a perfect display to your team and make your presentation unforgettable. This slide showcases various stats related to big data analytics which helps in identifying market growth prospects for future investments. It includes elements such as business profit, data generated, market share, investment etc.
Key Metrics To Measure Success Digital Marketing Strategies Improve Enterprise Sales Icons Pdf
The following slide showcases key performance indicators KPIs through which marketers can evaluate the effectiveness of marketing tactics. The KPIs covered in the slide are website traffic, brand impressions, annual contract value, new leads in pipeline, gross profit, net profit, market share, attrition rate, and monthly active users. Do you know about Slidesgeeks Key Metrics To Measure Success Digital Marketing Strategies Improve Enterprise Sales Icons Pdf These are perfect for delivering any kind od presentation. Using it, create PowerPoint presentations that communicate your ideas and engage audiences. Save time and effort by using our pre designed presentation templates that are perfect for a wide range of topic. Our vast selection of designs covers a range of styles, from creative to business, and are all highly customizable and easy to edit. Download as a PowerPoint template or use them as Google Slides themes. The following slide showcases key performance indicators KPIs through which marketers can evaluate the effectiveness of marketing tactics. The KPIs covered in the slide are website traffic, brand impressions, annual contract value, new leads in pipeline, gross profit, net profit, market share, attrition rate, and monthly active users.
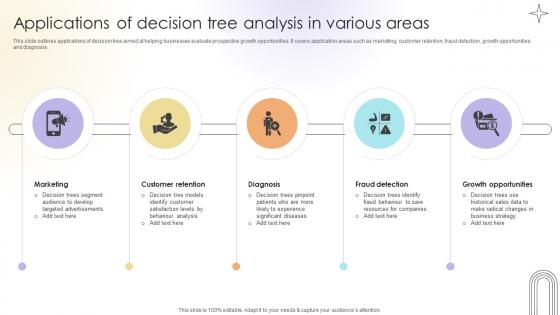
Applications Of Decision Tree Analysis In Various Areas Data Analytics SS V
This slide outlines applications of decision tree aimed at helping businesses evaluate prospective growth opportunities. It covers application areas such as marketing, customer retention, fraud detection, growth opportunities and diagnosis.Get a simple yet stunning designed Applications Of Decision Tree Analysis In Various Areas Data Analytics SS V. It is the best one to establish the tone in your meetings. It is an excellent way to make your presentations highly effective. So, download this PPT today from Slidegeeks and see the positive impacts. Our easy-to-edit Applications Of Decision Tree Analysis In Various Areas Data Analytics SS V can be your go-to option for all upcoming conferences and meetings. So, what are you waiting for Grab this template today. This slide outlines applications of decision tree aimed at helping businesses evaluate prospective growth opportunities. It covers application areas such as marketing, customer retention, fraud detection, growth opportunities and diagnosis.

Post It Ppt PowerPoint Presentation Portfolio Shapes
This is a post it ppt powerpoint presentation portfolio shapes. This is a four stage process. The stages in this process are business, strategy, analysis, marketing, post it.
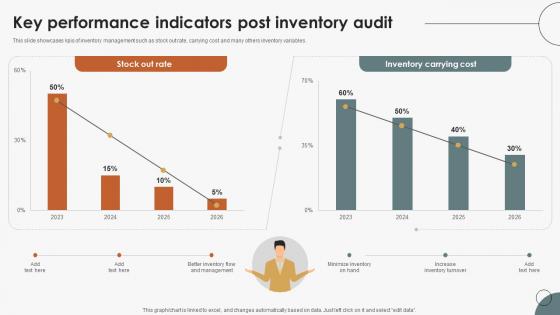
Boosting Efficiency In Inventory Key Performance Indicators Post Inventory Audit
This slide showcases kpis of inventory management such as stock out rate, carrying cost and many others inventory variables. Make sure to capture your audiences attention in your business displays with our gratis customizable Boosting Efficiency In Inventory Key Performance Indicators Post Inventory Audit. These are great for business strategies, office conferences, capital raising or task suggestions. If you desire to acquire more customers for your tech business and ensure they stay satisfied, create your own sales presentation with these plain slides. This slide showcases kpis of inventory management such as stock out rate, carrying cost and many others inventory variables.

Key Performance Indicators Of IBN Outsourcing Company PPT Presentation SS
The slide shows the key Performance Indicator KPIs which will help the company to track the success rate of implemented strategies. Some of the KPIs are Customer Attrition Rate, Product, Service Adoption Rate, Average Customer Queue Time , Customer Satisfaction Rate etc. Are you in need of a template that can accommodate all of your creative concepts This one is crafted professionally and can be altered to fit any style. Use it with Google Slides or PowerPoint. Include striking photographs, symbols, depictions, and other visuals. Fill, move around, or remove text boxes as desired. Test out color palettes and font mixtures. Edit and save your work, or work with colleagues. Download Key Performance Indicators Of IBN Outsourcing Company PPT Presentation SS and observe how to make your presentation outstanding. Give an impeccable presentation to your group and make your presentation unforgettable. The slide shows the key Performance Indicator KPIs which will help the company to track the success rate of implemented strategies. Some of the KPIs are Customer Attrition Rate, Product, Service Adoption Rate, Average Customer Queue Time , Customer Satisfaction Rate etc.

Benefits Of Leveraging Decision Tree Analysis Data Analytics SS V
This slide outlines key advantages of leveraging decision tree analysis aimed at identifying correct solutions to any problem. It covers the benefits such as depicts suitable project, easy classification, assistance for multiple tools, etc.Coming up with a presentation necessitates that the majority of the effort goes into the content and the message you intend to convey. The visuals of a PowerPoint presentation can only be effective if it supplements and supports the story that is being told. Keeping this in mind our experts created Benefits Of Leveraging Decision Tree Analysis Data Analytics SS V to reduce the time that goes into designing the presentation. This way, you can concentrate on the message while our designers take care of providing you with the right template for the situation. This slide outlines key advantages of leveraging decision tree analysis aimed at identifying correct solutions to any problem. It covers the benefits such as depicts suitable project, easy classification, assistance for multiple tools, etc.

Advanced Big Data Analytics Framework Developing Strategic Insights Using Big Data Analytics SS V
This slide showcases framework illustrating use of big data analytics in retain industry to improve operational efficiency. It includes elements such as demand forecasting, personalized marketing, price optimization, fraud detection etc. Boost your pitch with our creative Advanced Big Data Analytics Framework Developing Strategic Insights Using Big Data Analytics SS V. Deliver an awe-inspiring pitch that will mesmerize everyone. Using these presentation templates you will surely catch everyones attention. You can browse the ppts collection on our website. We have researchers who are experts at creating the right content for the templates. So you do not have to invest time in any additional work. Just grab the template now and use them. This slide showcases framework illustrating use of big data analytics in retain industry to improve operational efficiency. It includes elements such as demand forecasting, personalized marketing, price optimization, fraud detection etc.
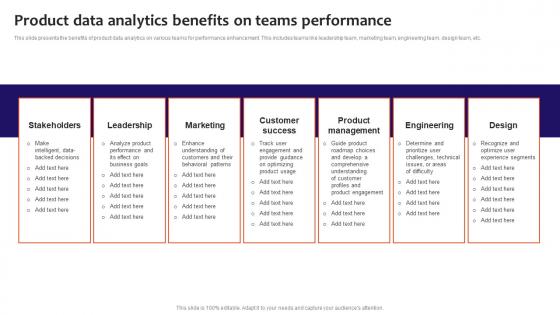
Product Data Analytics Benefits On Teams Performance Mockup Pdf
This slide presents the benefits of product data analytics on various teams for performance enhancement. This includes teams like leadership team, marketing team, engineering team, design team, etc. Pitch your topic with ease and precision using this Product Data Analytics Benefits On Teams Performance Mockup Pdf. This layout presents information on Leadership, Marketing, Customer Success. It is also available for immediate download and adjustment. So, changes can be made in the color, design, graphics or any other component to create a unique layout. This slide presents the benefits of product data analytics on various teams for performance enhancement. This includes teams like leadership team, marketing team, engineering team, design team, etc.
Advanced Data Statistics Report Icon Formats Pdf
Showcasing this set of slides titled Advanced Data Statistics Report Icon Formats Pdf. The topics addressed in these templates are Advanced Data Statistics, Report Icon. All the content presented in this PPT design is completely editable. Download it and make adjustments in color, background, font etc. as per your unique business setting. Our Advanced Data Statistics Report Icon Formats Pdf are topically designed to provide an attractive backdrop to any subject. Use them to look like a presentation pro.
Magnify Glass Research Ppt PowerPoint Presentation Styles Gallery
This is a magnify glass research ppt powerpoint presentation styles gallery. This is a three stage process. The stages in this process are magnifying glass, research, marketing, strategy, business.
Magnifying Glass Research Ppt PowerPoint Presentation Gallery Clipart Images
This is a magnifying glass research ppt powerpoint presentation gallery clipart images. This is a five stage process. The stages in this process are magnifying glass, research, marketing, strategy, business.
Magnifying Glass Research Ppt PowerPoint Presentation Infographics Example Introduction
This is a magnifying glass research ppt powerpoint presentation infographics example introduction. This is a four stage process. The stages in this process are magnifying glass, research, marketing, strategy, business.
Magnifying Glass Research Ppt PowerPoint Presentation Infographics Good
This is a magnifying glass research ppt powerpoint presentation infographics good. This is a four stage process. The stages in this process are magnifying glass, research, marketing, strategy, business.
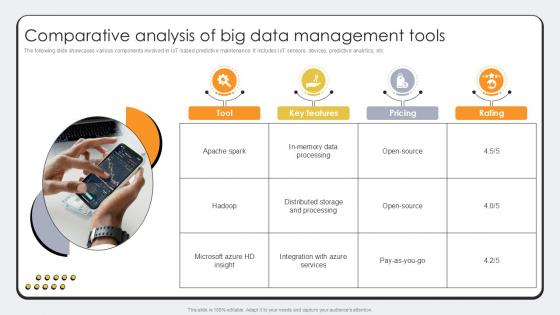
Comparative Analysis Of Big Data Revolutionizing Production IoT Ppt Slide
The following slide showcases various components involved in IoT-based predictive maintenance. It includes IoT sensors, devices, predictive analytics, etc. Slidegeeks is here to make your presentations a breeze with Comparative Analysis Of Big Data Revolutionizing Production IoT Ppt Slide With our easy-to-use and customizable templates, you can focus on delivering your ideas rather than worrying about formatting. With a variety of designs to choose from, you are sure to find one that suits your needs. And with animations and unique photos, illustrations, and fonts, you can make your presentation pop. So whether you are giving a sales pitch or presenting to the board, make sure to check out Slidegeeks first The following slide showcases various components involved in IoT-based predictive maintenance. It includes IoT sensors, devices, predictive analytics, etc.
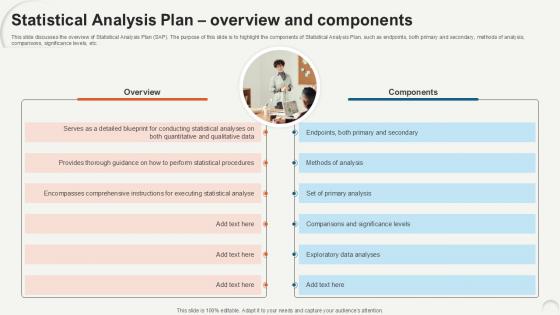
Statistical Analysis Plan Overview Data Analytics For Informed Decision Ppt Template
This slide discusses the overview of Statistical Analysis Plan SAP. The purpose of this slide is to highlight the components of Statistical Analysis Plan, such as endpoints, both primary and secondary, methods of analysis, comparisons, significance levels, etc. Here you can discover an assortment of the finest PowerPoint and Google Slides templates. With these templates, you can create presentations for a variety of purposes while simultaneously providing your audience with an eye-catching visual experience. Download Statistical Analysis Plan Overview Data Analytics For Informed Decision Ppt Template to deliver an impeccable presentation. These templates will make your job of preparing presentations much quicker, yet still, maintain a high level of quality. Slidegeeks has experienced researchers who prepare these templates and write high-quality content for you. Later on, you can personalize the content by editing the Statistical Analysis Plan Overview Data Analytics For Informed Decision Ppt Template. This slide discusses the overview of Statistical Analysis Plan SAP. The purpose of this slide is to highlight the components of Statistical Analysis Plan, such as endpoints, both primary and secondary, methods of analysis, comparisons, significance levels, etc.
Employee Progress Reporting Procedure Icon Diagrams PDF
Persuade your audience using this Employee Progress Reporting Procedure Icon Diagrams PDF. This PPT design covers four stages, thus making it a great tool to use. It also caters to a variety of topics including Employee Progress, Reporting Procedure Icon. Download this PPT design now to present a convincing pitch that not only emphasizes the topic but also showcases your presentation skills.
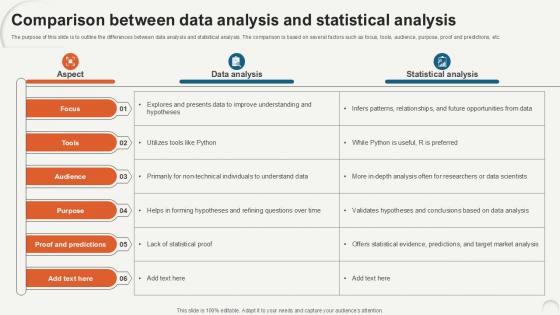
Comparison Between Data Analytics For Informed Decision Ppt Presentation
The purpose of this slide is to outline the differences between data analysis and statistical analysis. The comparison is based on several factors such as focus, tools, audience, purpose, proof and predictions, etc. From laying roadmaps to briefing everything in detail, our templates are perfect for you. You can set the stage with your presentation slides. All you have to do is download these easy-to-edit and customizable templates. Comparison Between Data Analytics For Informed Decision Ppt Presentation will help you deliver an outstanding performance that everyone would remember and praise you for. Do download this presentation today. The purpose of this slide is to outline the differences between data analysis and statistical analysis. The comparison is based on several factors such as focus, tools, audience, purpose, proof and predictions, etc.
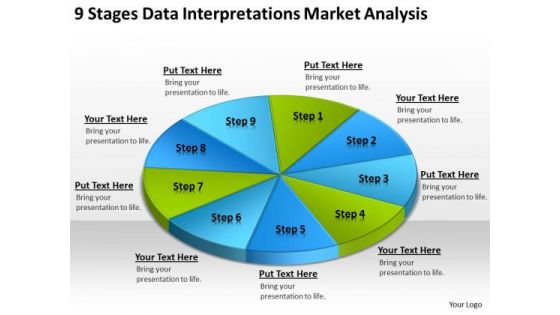
Data Interpretations Market Analysis Templates For Business Plan PowerPoint
We present our data interpretations market analysis templates for business plan PowerPoint.Present our Circle Charts PowerPoint Templates because Our PowerPoint Templates and Slides come in all colours, shades and hues. They help highlight every nuance of your views. Use our Business PowerPoint Templates because Our PowerPoint Templates and Slides will let you Hit the right notes. Watch your audience start singing to your tune. Download our Shapes PowerPoint Templates because Our PowerPoint Templates and Slides will fulfill your every need. Use them and effectively satisfy the desires of your audience. Present our Signs PowerPoint Templates because Our PowerPoint Templates and Slides will provide you a launch platform. Give a lift off to your ideas and send them into orbit. Use our Metaphors-Visual Concepts PowerPoint Templates because You have a driving passion to excel in your field. Our PowerPoint Templates and Slides will prove ideal vehicles for your ideas.Use these PowerPoint slides for presentations relating to business, chart, circle, circular, diagram, economy, finance, framework, graph, isolated, percentage, pie chart, results, scheme, statistics, stats, strategy, success. The prominent colors used in the PowerPoint template are Blue, Green, Blue light. Affiliate our Data Interpretations Market Analysis Templates For Business Plan PowerPoint to your thoughts. They will develop an affinity for them.
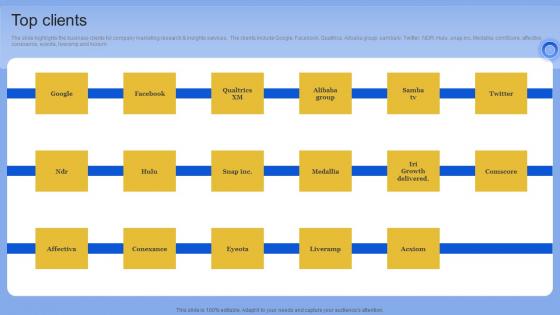
Top Clients Data Analytics Company Outline Pictures PDF
The slide highlights the business clients for company marketing research and insights services. The clients include Google, Facebook, Qualtrics, Alibaba group, samba tv, Twitter, NDR, Hulu, snap.inc, Medallia, comScore, affective, conexance, eyeota, liveramp and Acxiom Find a pre-designed and impeccable Top Clients Data Analytics Company Outline Pictures PDF The templates can ace your presentation without additional effort. You can download these easy-to-edit presentation templates to make your presentation stand out from others. So, what are you waiting for Download the template from Slidegeeks today and give a unique touch to your presentation. The slide highlights the business clients for company marketing research and insights services. The clients include Google, Facebook, Qualtrics, Alibaba group, samba tv, Twitter, NDR, Hulu, snap.inc, Medallia, comScore, affective, conexance, eyeota, liveramp and Acxiom
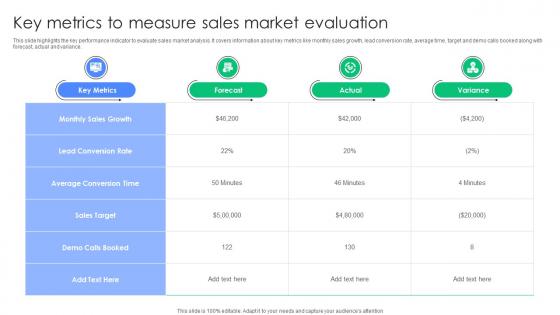
Key Metrics To Measure Sales Market Evaluation Portrait Pdf
This slide highlights the key performance indicator to evaluate sales market analysis. It covers information about key metrics like monthly sales growth, lead conversion rate, average time, target and demo calls booked along with forecast, actual and variance. Showcasing this set of slides titled Key Metrics To Measure Sales Market Evaluation Portrait Pdf. The topics addressed in these templates are Monthly Sales Growth, Lead Conversion Rate, Sales Target. All the content presented in this PPT design is completely editable. Download it and make adjustments in color, background, font etc. as per your unique business setting. This slide highlights the key performance indicator to evaluate sales market analysis. It covers information about key metrics like monthly sales growth, lead conversion rate, average time, target and demo calls booked along with forecast, actual and variance.

Global Data Security Industry Report Powerpoint Presentation Slides IR V
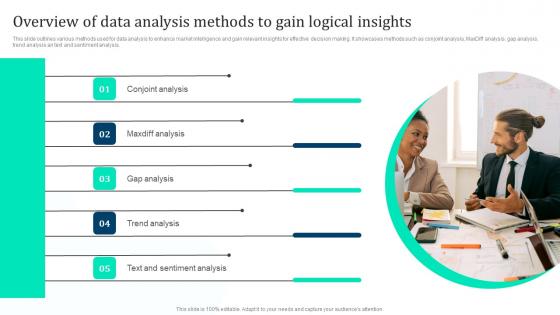
Overview Data Analysis Methods Gain Marketing Intelligence Guide Data Gathering Infographics Pdf
This slide outlines various methods used for data analysis to enhance market intelligence and gain relevant insights for effective decision making. It showcases methods such as conjoint analysis, MaxDiff analysis, gap analysis, trend analysis an text and sentiment analysis. This Overview Data Analysis Methods Gain Marketing Intelligence Guide Data Gathering Infographics Pdf from Slidegeeks makes it easy to present information on your topic with precision. It provides customization options, so you can make changes to the colors, design, graphics, or any other component to create a unique layout. It is also available for immediate download, so you can begin using it right away. Slidegeeks has done good research to ensure that you have everything you need to make your presentation stand out. Make a name out there for a brilliant performance. This slide outlines various methods used for data analysis to enhance market intelligence and gain relevant insights for effective decision making. It showcases methods such as conjoint analysis, MaxDiff analysis, gap analysis, trend analysis an text and sentiment analysis.
Market Research Growth Reporting Workflow Icon Formats PDF
Persuade your audience using this Market Research Growth Reporting Workflow Icon Formats PDF. This PPT design covers three stages, thus making it a great tool to use. It also caters to a variety of topics including Market Research Growth, Reporting Workflow Icon. Download this PPT design now to present a convincing pitch that not only emphasizes the topic but also showcases your presentation skills.
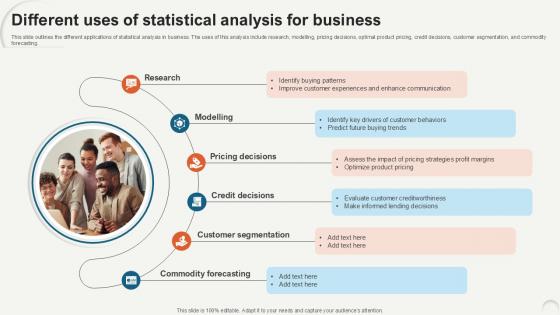
Different Uses Of Statistical Data Analytics For Informed Decision Ppt Slide
This slide outlines the different applications of statistical analysis in business. The uses of this analysis include research, modelling, pricing decisions, optimal product pricing, credit decisions, customer segmentation, and commodity forecasting. If your project calls for a presentation, then Slidegeeks is your go-to partner because we have professionally designed, easy-to-edit templates that are perfect for any presentation. After downloading, you can easily edit Different Uses Of Statistical Data Analytics For Informed Decision Ppt Slide and make the changes accordingly. You can rearrange slides or fill them with different images. Check out all the handy templates This slide outlines the different applications of statistical analysis in business. The uses of this analysis include research, modelling, pricing decisions, optimal product pricing, credit decisions, customer segmentation, and commodity forecasting.
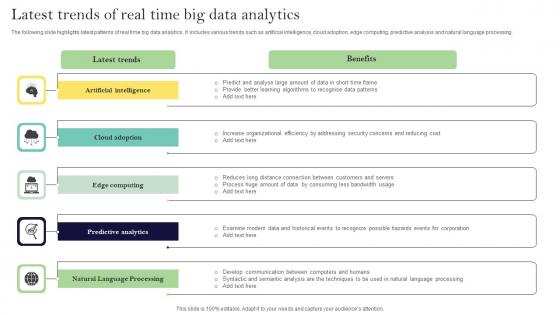
Latest Trends Of Real Time Big Data Analytics Ppt Infographic Template Smartart Pdf
The following slide highlights latest patterns of real time big data analytics. It includes various trends such as artificial intelligence, cloud adoption, edge computing, predictive analysis and natural language processing. Showcasing this set of slides titled Latest Trends Of Real Time Big Data Analytics Ppt Infographic Template Smartart Pdf. The topics addressed in these templates are Edge Computing, Predictive Analysis, Natural Language Processing. All the content presented in this PPT design is completely editable. Download it and make adjustments in color, background, font etc. as per your unique business setting. The following slide highlights latest patterns of real time big data analytics. It includes various trends such as artificial intelligence, cloud adoption, edge computing, predictive analysis and natural language processing.
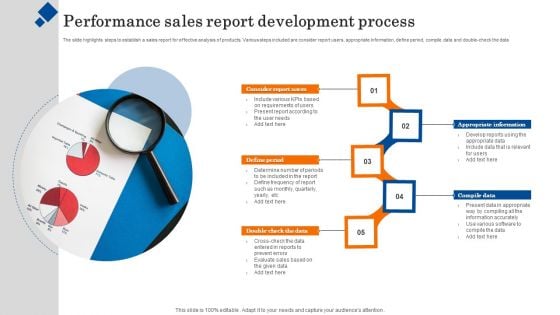
Performance Sales Report Development Process Portrait PDF
The slide highlights steps to establish a sales report for effective analysis of products. Various steps included are consider report users, appropriate information, define period, compile data and double-check the data. Persuade your audience using this Performance Sales Report Development Process Portrait PDF. This PPT design covers five stages, thus making it a great tool to use. It also caters to a variety of topics including Compile Data, Appropriate Information, Consider Report Users. Download this PPT design now to present a convincing pitch that not only emphasizes the topic but also showcases your presentation skills.

Introduction To Big Data Analytics Technology Advanced Tools For Hyperautomation Ppt Designs Pdf
This slide represents the introduction of big data analytics, including the complete data handling process, such as data collection, storage, research, analysis, visualization, volume, and network. It also caters to the critical Vs and benefits of big data. Slidegeeks has constructed Introduction To Big Data Analytics Technology Advanced Tools For Hyperautomation Ppt Designs Pdf after conducting extensive research and examination. These presentation templates are constantly being generated and modified based on user preferences and critiques from editors. Here, you will find the most attractive templates for a range of purposes while taking into account ratings and remarks from users regarding the content. This is an excellent jumping-off point to explore our content and will give new users an insight into our top-notch PowerPoint Templates. This slide represents the introduction of big data analytics, including the complete data handling process, such as data collection, storage, research, analysis, visualization, volume, and network. It also caters to the critical Vs and benefits of big data.
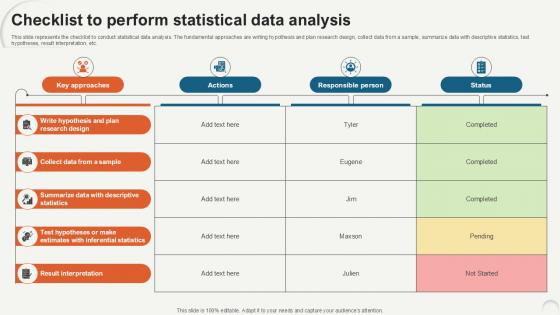
Checklist To Perform Statistical Data Analytics For Informed Decision Ppt Slide
This slide represents the checklist to conduct statistical data analysis. The fundamental approaches are writing hypothesis and plan research design, collect data from a sample, summarize data with descriptive statistics, test hypotheses, result interpretation, etc. Get a simple yet stunning designed Checklist To Perform Statistical Data Analytics For Informed Decision Ppt Slide. It is the best one to establish the tone in your meetings. It is an excellent way to make your presentations highly effective. So, download this PPT today from Slidegeeks and see the positive impacts. Our easy-to-edit Checklist To Perform Statistical Data Analytics For Informed Decision Ppt Slide can be your go-to option for all upcoming conferences and meetings. So, what are you waiting for Grab this template today. This slide represents the checklist to conduct statistical data analysis. The fundamental approaches are writing hypothesis and plan research design, collect data from a sample, summarize data with descriptive statistics, test hypotheses, result interpretation, etc.

Table Of Contents Global Data Security Industry Report IR SS V
Slidegeeks has constructed Table Of Contents Global Data Security Industry Report IR SS V after conducting extensive research and examination. These presentation templates are constantly being generated and modified based on user preferences and critiques from editors. Here, you will find the most attractive templates for a range of purposes while taking into account ratings and remarks from users regarding the content. This is an excellent jumping-off point to explore our content and will give new users an insight into our top-notch PowerPoint Templates. Our Table Of Contents Global Data Security Industry Report IR SS V are topically designed to provide an attractive backdrop to any subject. Use them to look like a presentation pro.

Global Data Security Industry Report Risk Evaluation Within Cybersecurity Industry IR SS V
The slide depicts risk assessment for the cybersecurity industry. It aims to educate the audience on the need of successfully recognizing and managing risks to maintain the stability. It covers potential hazards associated with data beaches, phishing attacks, malware, regulatory compliance, and IoT security issues. The best PPT templates are a great way to save time, energy, and resources. Slidegeeks have 100 percent editable powerpoint slides making them incredibly versatile. With these quality presentation templates, you can create a captivating and memorable presentation by combining visually appealing slides and effectively communicating your message. Download Global Data Security Industry Report Risk Evaluation Within Cybersecurity Industry IR SS V from Slidegeeks and deliver a wonderful presentation. The slide depicts risk assessment for the cybersecurity industry. It aims to educate the audience on the need of successfully recognizing and managing risks to maintain the stability. It covers potential hazards associated with data beaches, phishing attacks, malware, regulatory compliance, and IoT security issues.

Timeline To Conduct Statistical Data Analytics For Informed Decision Ppt Presentation
This slide shows the timeline for performing statistical data analysis. The key steps include writing hypothesis and plan research design, collect data from a sample, summarize data with descriptive statistics, test hypotheses, result interpretation, etc. Slidegeeks is here to make your presentations a breeze with Timeline To Conduct Statistical Data Analytics For Informed Decision Ppt Presentation With our easy-to-use and customizable templates, you can focus on delivering your ideas rather than worrying about formatting. With a variety of designs to choose from, you are sure to find one that suits your needs. And with animations and unique photos, illustrations, and fonts, you can make your presentation pop. So whether you are giving a sales pitch or presenting to the board, make sure to check out Slidegeeks first This slide shows the timeline for performing statistical data analysis. The key steps include writing hypothesis and plan research design, collect data from a sample, summarize data with descriptive statistics, test hypotheses, result interpretation, etc.
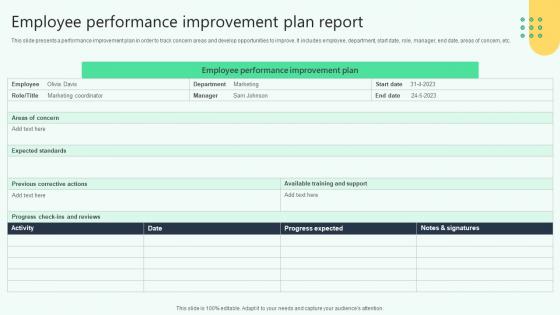
Employee Performance Improvement Plan Report Analysing Hr Data For Effective Decision Making
This slide presents a performance improvement plan in order to track concern areas and develop opportunities to improve. It includes employee, department, start date, role, manager, end date, areas of concern, etc. Formulating a presentation can take up a lot of effort and time, so the content and message should always be the primary focus. The visuals of the PowerPoint can enhance the presenters message, so our Employee Performance Improvement Plan Report Analysing Hr Data For Effective Decision Making was created to help save time. Instead of worrying about the design, the presenter can concentrate on the message while our designers work on creating the ideal templates for whatever situation is needed. Slidegeeks has experts for everything from amazing designs to valuable content, we have put everything into Employee Performance Improvement Plan Report Analysing Hr Data For Effective Decision Making. This slide presents a performance improvement plan in order to track concern areas and develop opportunities to improve. It includes employee, department, start date, role, manager, end date, areas of concern, etc.
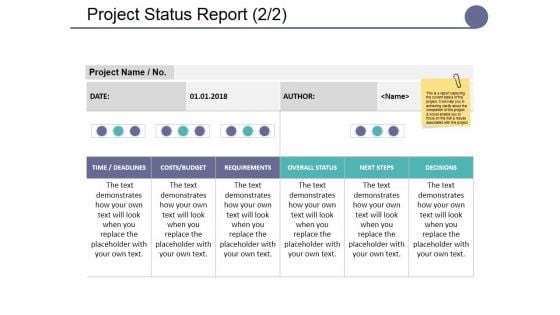
Project Status Report Template Ppt PowerPoint Presentation Model Background Designs
This is a project status report template ppt powerpoint presentation model background designs. This is a three stage process. The stages in this process are business, marketing, strategy, table, data.

Before Vs After Performing Data Analytics For Informed Decision Ppt Template
This slide shows the before vs. after comparison of statistical analysis of business data. The different aspects compared in this slide are decision-making, operational efficiency, customer insights, product quality, revenue generation, supply chain efficiency, etc. Create an editable Before Vs After Performing Data Analytics For Informed Decision Ppt Template that communicates your idea and engages your audience. Whether you are presenting a business or an educational presentation, pre-designed presentation templates help save time. Before Vs After Performing Data Analytics For Informed Decision Ppt Template is highly customizable and very easy to edit, covering many different styles from creative to business presentations. Slidegeeks has creative team members who have crafted amazing templates. So, go and get them without any delay. This slide shows the before vs. after comparison of statistical analysis of business data. The different aspects compared in this slide are decision-making, operational efficiency, customer insights, product quality, revenue generation, supply chain efficiency, etc.
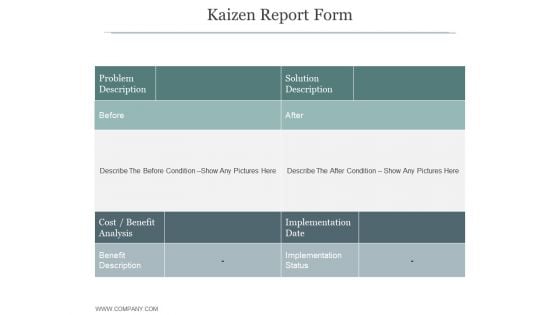
Kaizen Report Form Ppt PowerPoint Presentation Design Ideas
This is a kaizen report form ppt powerpoint presentation design ideas. This is a two stage process. The stages in this process are problem description, solution description, implementation date, benefit description, implementation status.
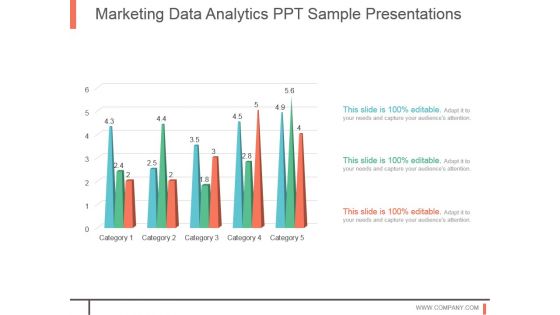
Marketing Data Analytics Ppt Sample Presentations
This is a marketing data analytics ppt sample presentations. This is a five stage process. The stages in this process are business, strategy, marketing, process, linear process.
Business Performance Analysis Report Vector Icon Ppt PowerPoint Presentation File Visuals PDF
Presenting business performance analysis report vector icon ppt powerpoint presentation file visuals pdf to dispense important information. This template comprises three stages. It also presents valuable insights into the topics including business performance analysis report vector icon. This is a completely customizable PowerPoint theme that can be put to use immediately. So, download it and address the topic impactfully.
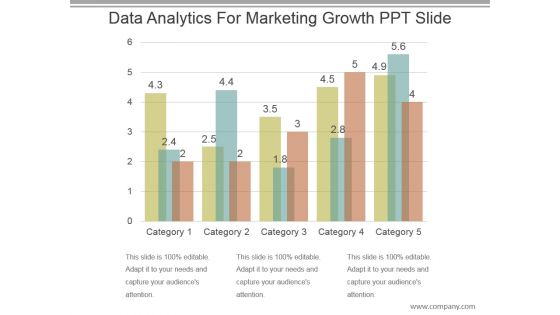
Data Analytics For Marketing Growth Ppt Slide
This is a data analytics for marketing growth ppt slide. This is a five stage process. The stages in this process are category.
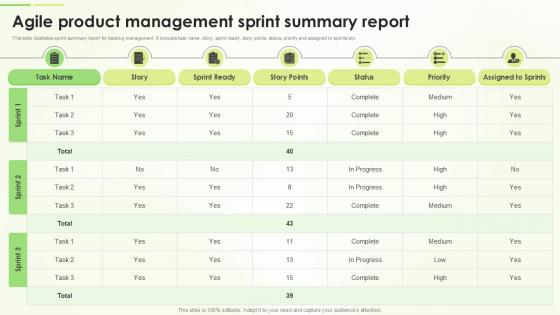
Agile Product Management Sprint Summary Report
Slidegeeks is one of the best resources for PowerPoint templates. You can download easily and regulate Agile Product Management Sprint Summary Report for your personal presentations from our wonderful collection. A few clicks is all it takes to discover and get the most relevant and appropriate templates. Use our Templates to add a unique zing and appeal to your presentation and meetings. All the slides are easy to edit and you can use them even for advertisement purposes. Use our professionally crafted templated on Sprint Summary Report designed for effective backlog management covering key elements including task names, user stories, sprint readiness, story points, current status, priority levels, and sprint assignments, etc. providing overview of priorities and progress.
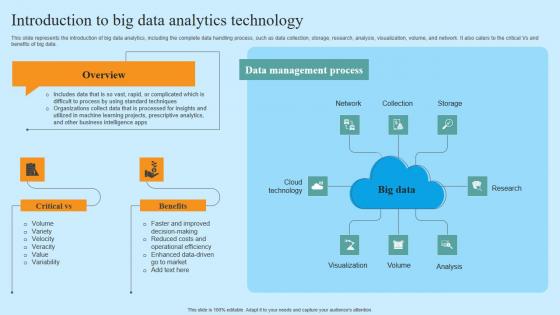
Introduction To Big Data Analytics Technology Hyper Automation Solutions Designs Pdf
This slide represents the introduction of big data analytics, including the complete data handling process, such as data collection, storage, research, analysis, visualization, volume, and network. It also caters to the critical Vs and benefits of big data. Retrieve professionally designed Introduction To Big Data Analytics Technology Hyper Automation Solutions Designs Pdf to effectively convey your message and captivate your listeners. Save time by selecting pre-made slideshows that are appropriate for various topics, from business to educational purposes. These themes come in many different styles, from creative to corporate, and all of them are easily adjustable and can be edited quickly. Access them as PowerPoint templates or as Google Slides themes. You do not have to go on a hunt for the perfect presentation because Slidegeeks got you covered from everywhere. This slide represents the introduction of big data analytics, including the complete data handling process, such as data collection, storage, research, analysis, visualization, volume, and network. It also caters to the critical Vs and benefits of big data.
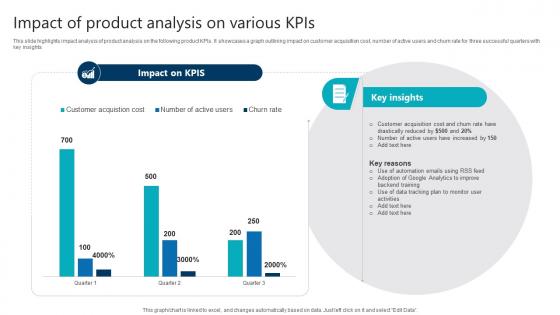
Impact Of Product Analysis On Various Kpis Product Analytics Implementation Data Analytics V
This slide highlights impact analysis of product analysis on the following product KPIs. It showcases a graph outlining impact on customer acquisition cost, number of active users and churn rate for three successful quarters with key insights Are you searching for a Impact Of Product Analysis On Various Kpis Product Analytics Implementation Data Analytics V that is uncluttered, straightforward, and original Its easy to edit, and you can change the colors to suit your personal or business branding. For a presentation that expresses how much effort you have put in, this template is ideal With all of its features, including tables, diagrams, statistics, and lists, its perfect for a business plan presentation. Make your ideas more appealing with these professional slides. Download Impact Of Product Analysis On Various Kpis Product Analytics Implementation Data Analytics V from Slidegeeks today. This slide highlights impact analysis of product analysis on the following product KPIs. It showcases a graph outlining impact on customer acquisition cost, number of active users and churn rate for three successful quarters with key insights
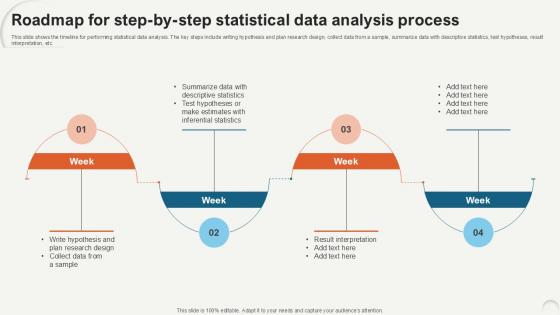
Roadmap For Step By Step Statistical Data Analytics For Informed Decision Ppt PowerPoint
This slide shows the timeline for performing statistical data analysis. The key steps include writing hypothesis and plan research design, collect data from a sample, summarize data with descriptive statistics, test hypotheses, result interpretation, etc. Retrieve professionally designed Roadmap For Step By Step Statistical Data Analytics For Informed Decision Ppt PowerPoint to effectively convey your message and captivate your listeners. Save time by selecting pre-made slideshows that are appropriate for various topics, from business to educational purposes. These themes come in many different styles, from creative to corporate, and all of them are easily adjustable and can be edited quickly. Access them as PowerPoint templates or as Google Slides themes. You do not have to go on a hunt for the perfect presentation because Slidegeeks got you covered from everywhere. This slide shows the timeline for performing statistical data analysis. The key steps include writing hypothesis and plan research design, collect data from a sample, summarize data with descriptive statistics, test hypotheses, result interpretation, etc.
Business Report Analysis Vector Icon Ppt PowerPoint Presentation Gallery Visual Aids PDF
Presenting business report analysis vector icon ppt powerpoint presentation gallery visual aids pdf to dispense important information. This template comprises three stages. It also presents valuable insights into the topics including business report analysis vector icon. This is a completely customizable PowerPoint theme that can be put to use immediately. So, download it and address the topic impactfully.
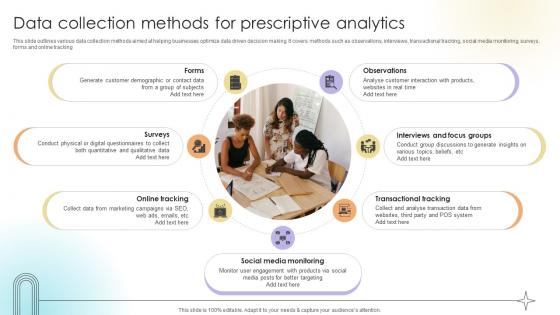
Data Collection Methods For Prescriptive Analytics Data Analytics SS V
This slide outlines various data collection methods aimed at helping businesses optimize data driven decision making. It covers methods such as observations, interviews, transactional tracking, social media monitoring, surveys, forms and online tracking.Slidegeeks has constructed Data Collection Methods For Prescriptive Analytics Data Analytics SS V after conducting extensive research and examination. These presentation templates are constantly being generated and modified based on user preferences and critiques from editors. Here, you will find the most attractive templates for a range of purposes while taking into account ratings and remarks from users regarding the content. This is an excellent jumping-off point to explore our content and will give new users an insight into our top-notch PowerPoint Templates. This slide outlines various data collection methods aimed at helping businesses optimize data driven decision making. It covers methods such as observations, interviews, transactional tracking, social media monitoring, surveys, forms and online tracking.

Key Features Of Prescriptive Data Analytics Data Analytics SS V
This slide provides a table comparing four types of analytics such as descriptive diagnostic, predictive and prescriptive analytics. The basis of comparison are definition, focus.Present like a pro with Key Features Of Prescriptive Data Analytics Data Analytics SS V. Create beautiful presentations together with your team, using our easy-to-use presentation slides. Share your ideas in real-time and make changes on the fly by downloading our templates. So whether you are in the office, on the go, or in a remote location, you can stay in sync with your team and present your ideas with confidence. With Slidegeeks presentation got a whole lot easier. Grab these presentations today. This slide provides a table comparing four types of analytics such as descriptive diagnostic, predictive and prescriptive analytics. The basis of comparison are definition, focus.
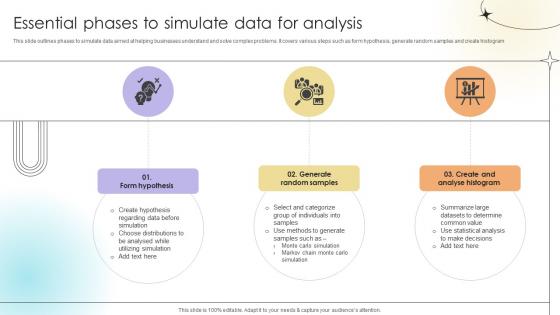
Essential Phases To Simulate Data For Analysis Data Analytics SS V
This slide outlines phases to simulate data aimed at helping businesses understand and solve complex problems. It covers various steps such as form hypothesis, generate random samples and create histogram.Here you can discover an assortment of the finest PowerPoint and Google Slides templates. With these templates, you can create presentations for a variety of purposes while simultaneously providing your audience with an eye-catching visual experience. Download Essential Phases To Simulate Data For Analysis Data Analytics SS V to deliver an impeccable presentation. These templates will make your job of preparing presentations much quicker, yet still, maintain a high level of quality. Slidegeeks has experienced researchers who prepare these templates and write high-quality content for you. Later on, you can personalize the content by editing the Essential Phases To Simulate Data For Analysis Data Analytics SS V. This slide outlines phases to simulate data aimed at helping businesses understand and solve complex problems. It covers various steps such as form hypothesis, generate random samples and create histogram.

Types Of Data Monitored In Product Analytics Product Analytics Implementation Data Analytics V
This slide outlines major categories of data tracked using product analytics aimed at improving performance to increase business revenue. It covers categories such as event tracking as well as properties Are you searching for a Types Of Data Monitored In Product Analytics Product Analytics Implementation Data Analytics V that is uncluttered, straightforward, and original Its easy to edit, and you can change the colors to suit your personal or business branding. For a presentation that expresses how much effort you have put in, this template is ideal With all of its features, including tables, diagrams, statistics, and lists, its perfect for a business plan presentation. Make your ideas more appealing with these professional slides. Download Types Of Data Monitored In Product Analytics Product Analytics Implementation Data Analytics V from Slidegeeks today. This slide outlines major categories of data tracked using product analytics aimed at improving performance to increase business revenue. It covers categories such as event tracking as well as properties


 Continue with Email

 Home
Home


