Dashboards
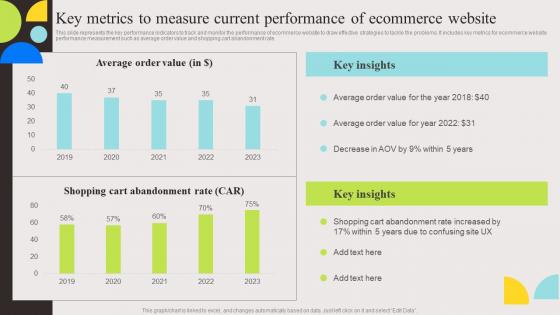
Key Metrics To Measure Current Evaluation And Deployment Of Enhanced Professional Pdf
This slide represents the key performance indicators to track and monitor the performance of ecommerce website to draw effective strategies to tackle the problems. It includes key metrics for ecommerce website performance measurement such as average order value and shopping cart abandonment rate. Are you searching for a Key Metrics To Measure Current Evaluation And Deployment Of Enhanced Professional Pdf that is uncluttered, straightforward, and original It is easy to edit, and you can change the colors to suit your personal or business branding. For a presentation that expresses how much effort you have put in, this template is ideal With all of its features, including tables, diagrams, statistics, and lists, it is perfect for a business plan presentation. Make your ideas more appealing with these professional slides. Download Key Metrics To Measure Current Evaluation And Deployment Of Enhanced Professional Pdf from Slidegeeks today. This slide represents the key performance indicators to track and monitor the performance of ecommerce website to draw effective strategies to tackle the problems. It includes key metrics for ecommerce website performance measurement such as average order value and shopping cart abandonment rate.
Business Report With Magnifying Glass Vector Icon Ppt PowerPoint Presentation Layouts Smartart PDF
Presenting this set of slides with name business report with magnifying glass vector icon ppt powerpoint presentation layouts smartart pdf. This is a three stage process. The stages in this process are business report with magnifying glass vector icon. This is a completely editable PowerPoint presentation and is available for immediate download. Download now and impress your audience.
Business Report With Magnifying Glass Vector Icon Ppt PowerPoint Presentation Gallery Summary PDF
Presenting this set of slides with name business report with magnifying glass vector icon ppt powerpoint presentation gallery summary pdf. This is a three stage process. The stages in this process are business report with magnifying glass vector icon. This is a completely editable PowerPoint presentation and is available for immediate download. Download now and impress your audience.
Business Consultant Vector Analyzing Financial Reports Icon Ppt PowerPoint Presentation Gallery Example Introduction PDF
Presenting this set of slides with name business consultant vector analyzing financial reports icon ppt powerpoint presentation gallery example introduction pdf. This is a three stage process. The stages in this process are business consultant vector analyzing financial reports icon. This is a completely editable PowerPoint presentation and is available for immediate download. Download now and impress your audience.

Business Reports With Main Findings And Recommendations Ppt PowerPoint Presentation Gallery Design Templates PDF
Presenting business reports with main findings and recommendations ppt powerpoint presentation gallery design templates pdf to dispense important information. This template comprises three stages. It also presents valuable insights into the topics including business reports with main findings and recommendations. This is a completely customizable PowerPoint theme that can be put to use immediately. So, download it and address the topic impactfully.
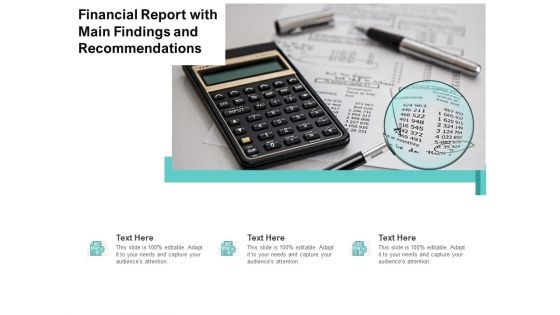
Financial Report With Main Findings And Recommendations Ppt PowerPoint Presentation File Demonstration PDF
Presenting financial report with main findings and recommendations ppt powerpoint presentation file demonstration pdf to dispense important information. This template comprises three stages. It also presents valuable insights into the topics including financial report with main findings and recommendations. This is a completely customizable PowerPoint theme that can be put to use immediately. So, download it and address the topic impactfully.
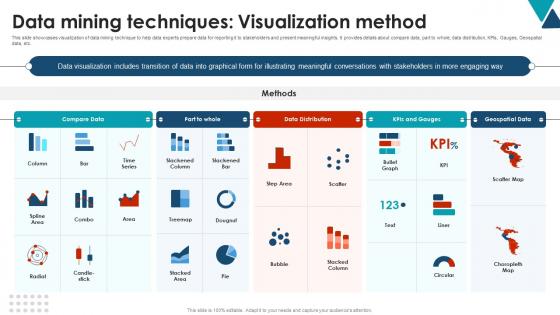
Data Mining Techniques Visualization Method Using Data Mining Tools To Optimize Processes AI SS V
This slide showcases visualization of data mining technique to help data experts prepare data for reporting it to stakeholders and present meaningful insights. It provides details about compare data, part to whole, data distribution, KPIs, Gauges, Geospatial data, etc. Here you can discover an assortment of the finest PowerPoint and Google Slides templates. With these templates, you can create presentations for a variety of purposes while simultaneously providing your audience with an eye-catching visual experience. Download Data Mining Techniques Visualization Method Using Data Mining Tools To Optimize Processes AI SS V to deliver an impeccable presentation. These templates will make your job of preparing presentations much quicker, yet still, maintain a high level of quality. Slidegeeks has experienced researchers who prepare these templates and write high-quality content for you. Later on, you can personalize the content by editing the Data Mining Techniques Visualization Method Using Data Mining Tools To Optimize Processes AI SS V. This slide showcases visualization of data mining technique to help data experts prepare data for reporting it to stakeholders and present meaningful insights. It provides details about compare data, part to whole, data distribution, KPIs, Gauges, Geospatial data, etc.
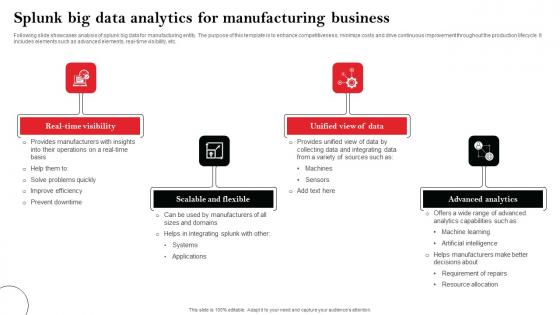
Splunk Big Data Analytics For Manufacturing Business Ideas Pdf
Following slide showcases analysis of splunk big data for manufacturing entity. The purpose of this template is to enhance competitiveness, minimize costs and drive continuous improvement throughout the production lifecycle. It includes elements such as advanced elements, real-time visibility, etc. Pitch your topic with ease and precision using this Splunk Big Data Analytics For Manufacturing Business Ideas Pdf This layout presents information on Real-Time Visibility, Scalable And Flexible, Advanced Analytics It is also available for immediate download and adjustment. So, changes can be made in the color, design, graphics or any other component to create a unique layout. Following slide showcases analysis of splunk big data for manufacturing entity. The purpose of this template is to enhance competitiveness, minimize costs and drive continuous improvement throughout the production lifecycle. It includes elements such as advanced elements, real-time visibility, etc.

Global Data Security Industry Report Blueprint Of The Global Cybersecurity Industry Report IR SS V
The slide shows the overview of the cybersecurity industry report. It sets the stage for subsequent content by introducing the key topics covered in the report to capture the readers attention. It covers a detailed scope, research methodology, and objectives. Slidegeeks is one of the best resources for PowerPoint templates. You can download easily and regulate Global Data Security Industry Report Blueprint Of The Global Cybersecurity Industry Report IR SS V for your personal presentations from our wonderful collection. A few clicks is all it takes to discover and get the most relevant and appropriate templates. Use our Templates to add a unique zing and appeal to your presentation and meetings. All the slides are easy to edit and you can use them even for advertisement purposes. The slide shows the overview of the cybersecurity industry report. It sets the stage for subsequent content by introducing the key topics covered in the report to capture the readers attention. It covers a detailed scope, research methodology, and objectives.
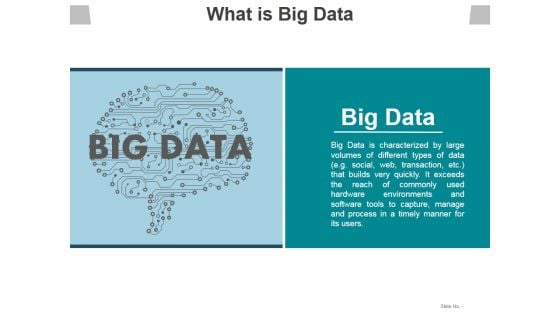
What Is Big Data Ppt PowerPoint Presentation Styles Background
This is a what is big data ppt powerpoint presentation styles background. This is a one stage process. The stages in this process are big data, data analysis, business, marketing, management.
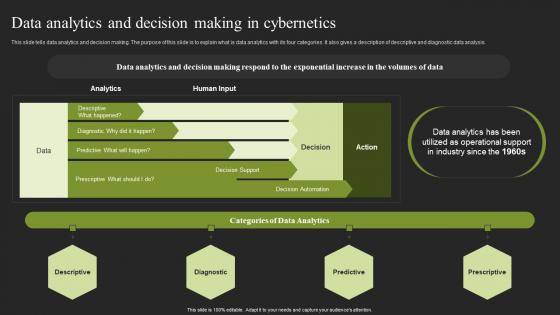
Data Analytics And Decision Making In Cybernetics Cybernetic Systems Inspiration Pdf
This slide tells data analytics and decision making. The purpose of this slide is to explain what is data analytics with its four categories. It also gives a description of descriptive and diagnostic data analysis. Welcome to our selection of the Data Analytics And Decision Making In Cybernetics Cybernetic Systems Inspiration Pdf. These are designed to help you showcase your creativity and bring your sphere to life. Planning and Innovation are essential for any business that is just starting out. This collection contains the designs that you need for your everyday presentations. All of our PowerPoints are 100 percent editable, so you can customize them to suit your needs. This multi purpose template can be used in various situations. Grab these presentation templates today This slide tells data analytics and decision making. The purpose of this slide is to explain what is data analytics with its four categories. It also gives a description of descriptive and diagnostic data analysis.
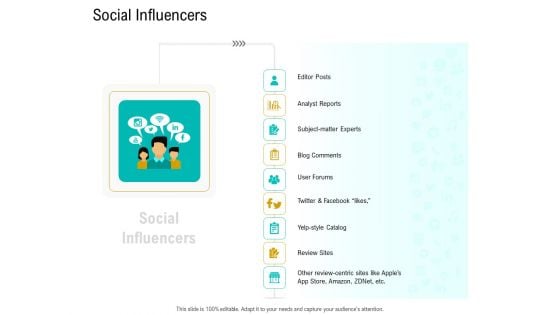
Business Data Analysis Social Influencers Diagrams PDF
Deliver an awe inspiring pitch with this creative business data analysis social influencers diagrams pdf bundle. Topics like analyst reports, subject matter experts, blog comments review sites, user forums can be discussed with this completely editable template. It is available for immediate download depending on the needs and requirements of the user.
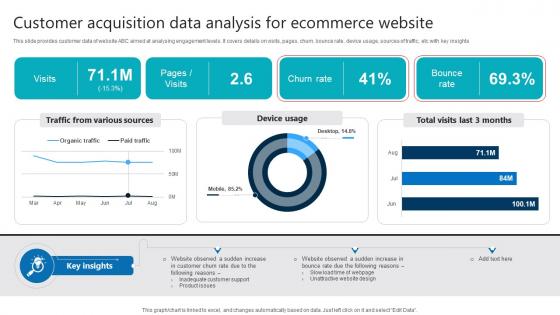
Customer Acquisition Data Analysis For Ecommerce Website Product Analytics Implementation Data Analytics V
This slide provides customer data of website ABC aimed at analysing engagement levels. It covers details on visits, pages, churn, bounce rate, device usage, sources of traffic, etc with key insights If you are looking for a format to display your unique thoughts, then the professionally designed Customer Acquisition Data Analysis For Ecommerce Website Product Analytics Implementation Data Analytics V is the one for you. You can use it as a Google Slides template or a PowerPoint template. Incorporate impressive visuals, symbols, images, and other charts. Modify or reorganize the text boxes as you desire. Experiment with shade schemes and font pairings. Alter, share or cooperate with other people on your work. Download Customer Acquisition Data Analysis For Ecommerce Website Product Analytics Implementation Data Analytics V and find out how to give a successful presentation. Present a perfect display to your team and make your presentation unforgettable. This slide provides customer data of website ABC aimed at analysing engagement levels. It covers details on visits, pages, churn, bounce rate, device usage, sources of traffic, etc with key insights
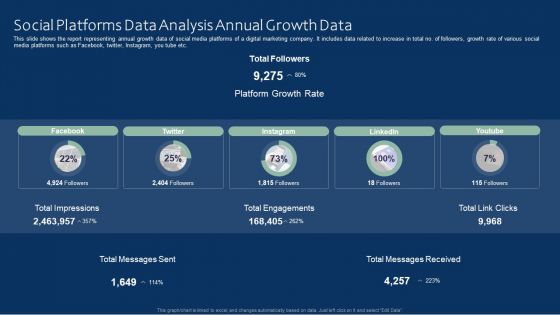
Social Platforms Data Analysis Annual Growth Data Ideas PDF
This slide shows the report representing annual growth data of social media platforms of a digital marketing company. It includes data related to increase in total no. of followers, growth rate of various social media platforms such as Facebook, twitter, Instagram, you tube etc. Pitch your topic with ease and precision using this Social Platforms Data Analysis Annual Growth Data Ideas PDF. This layout presents information on Social Platforms Data Analysis, Annual Growth Data. It is also available for immediate download and adjustment. So, changes can be made in the color, design, graphics or any other component to create a unique layout.
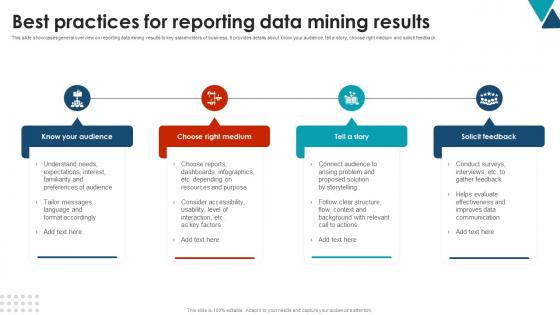
Best Practices For Reporting Data Mining Results Using Data Mining Tools To Optimize Processes AI SS V
This slide showcases general overview on reporting data mining results to key stakeholders of business. It provides details about know your audience, tell a story, choose right medium and solicit feedback. From laying roadmaps to briefing everything in detail, our templates are perfect for you. You can set the stage with your presentation slides. All you have to do is download these easy-to-edit and customizable templates. Best Practices For Reporting Data Mining Results Using Data Mining Tools To Optimize Processes AI SS V will help you deliver an outstanding performance that everyone would remember and praise you for. Do download this presentation today. This slide showcases general overview on reporting data mining results to key stakeholders of business. It provides details about know your audience, tell a story, choose right medium and solicit feedback.
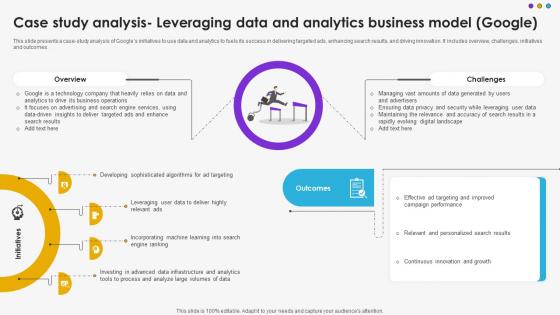
Case Study Analysis Leveraging Data And Analytics Business Model Google DT SS V
This slide presents a case-study analysis of Googles initiatives to use data and analytics to fuels its success in delivering targeted ads, enhancing search results, and driving innovation. It includes overview, challenges, initiatives and outcomes.Find highly impressive Case Study Analysis Leveraging Data And Analytics Business Model Google DT SS V on Slidegeeks to deliver a meaningful presentation. You can save an ample amount of time using these presentation templates. No need to worry to prepare everything from scratch because Slidegeeks experts have already done a huge research and work for you. You need to download Case Study Analysis Leveraging Data And Analytics Business Model Google DT SS V for your upcoming presentation. All the presentation templates are 100 percent editable and you can change the color and personalize the content accordingly. Download now This slide presents a case-study analysis of Googles initiatives to use data and analytics to fuels its success in delivering targeted ads, enhancing search results, and driving innovation. It includes overview, challenges, initiatives and outcomes.
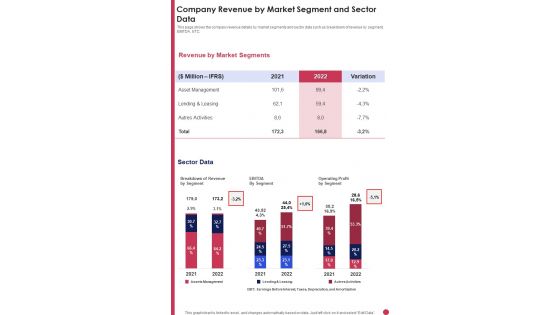
Company Revenue By Market Segment And Sector Data Template 281 One Pager Documents
This page shows the company revenue details by market segments and sector data such as breakdown of revenue by segment, EBITDA, ETC. Presenting you a fantastic Company Revenue By Market Segment And Sector Data Template 281 One Pager Documents. This piece is crafted on hours of research and professional design efforts to ensure you have the best resource. It is completely editable and its design allow you to rehash its elements to suit your needs. Get this Company Revenue By Market Segment And Sector Data Template 281 One Pager Documents A4 One-pager now.
Data And Analytics Ppt PowerPoint Presentation Icon Layouts Cpb
This is a data and analytics ppt powerpoint presentation icon layouts cpb. This is a five stage process. The stages in this process are data and analytics.
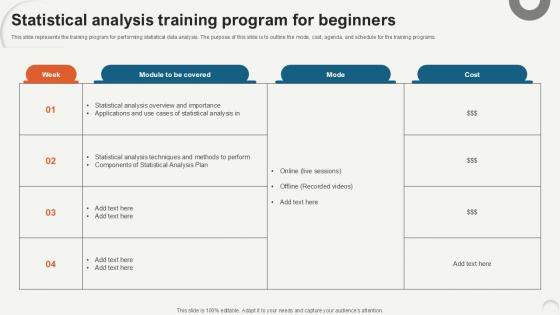
Statistical Analysis Training Program Data Analytics For Informed Decision Ppt Template
This slide represents the training program for performing statistical data analysis. The purpose of this slide is to outline the mode, cost, agenda, and schedule for the training programs. Take your projects to the next level with our ultimate collection of Statistical Analysis Training Program Data Analytics For Informed Decision Ppt Template. Slidegeeks has designed a range of layouts that are perfect for representing task or activity duration, keeping track of all your deadlines at a glance. Tailor these designs to your exact needs and give them a truly corporate look with your own brand colors they will make your projects stand out from the rest This slide represents the training program for performing statistical data analysis. The purpose of this slide is to outline the mode, cost, agenda, and schedule for the training programs.
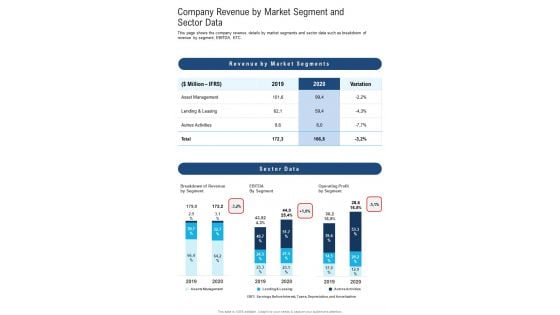
Company Revenue By Market Segment And Sector Data One Pager Documents
Presenting you an exemplary Company Revenue By Market Segment And Sector Data One Pager Documents. Our one-pager comprises all the must-have essentials of an inclusive document. You can edit it with ease, as its layout is completely editable. With such freedom, you can tweak its design and other elements to your requirements. Download this Company Revenue By Market Segment And Sector Data One Pager Documents brilliant piece now.
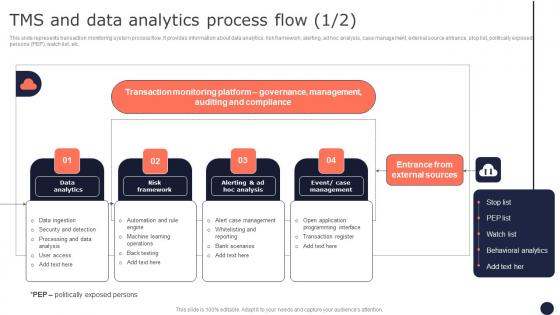
TMS And Data Analytics Process Flow Mitigating Corporate Scams And Robberies Topics Pdf Inspiration Pdf
This slide represents transaction monitoring system process flow. It provides information about data analytics, risk framework, alerting, ad hoc analysis, case management, external source entrance, stop list, politically exposed persons PEP, watch list, etc. Want to ace your presentation in front of a live audience Our TMS And Data Analytics Process Flow Mitigating Corporate Scams And Robberies Topics Pdf Inspiration Pdf can help you do that by engaging all the users towards you. Slidegeeks experts have put their efforts and expertise into creating these impeccable powerpoint presentations so that you can communicate your ideas clearly. Moreover, all the templates are customizable, and easy-to-edit and downloadable. Use these for both personal and commercial use. This slide represents transaction monitoring system process flow. It provides information about data analytics, risk framework, alerting, ad hoc analysis, case management, external source entrance, stop list, politically exposed persons PEP, watch list, etc.
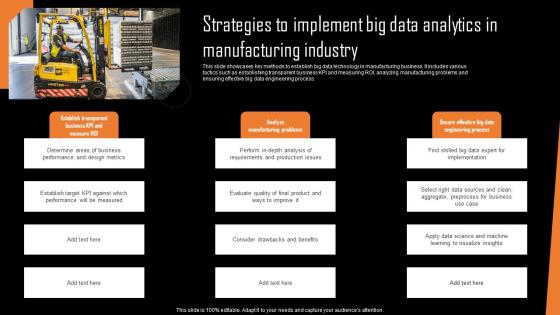
Strategies To Implement Big Data Analytics In Manufacturing Industry Portrait Pdf
This slide showcases key methods to establish big data technology in manufacturing business. It includes various tactics such as establishing transparent business KPI and measuring ROI, analyzing manufacturing problems and ensuring effective big data engineering process.Pitch your topic with ease and precision using this Strategies To Implement Big Data Analytics In Manufacturing Industry Portrait Pdf This layout presents information on Determine Areas, Performance Design Metrics, Performance Measured It is also available for immediate download and adjustment. So, changes can be made in the color, design, graphics or any other component to create a unique layout. This slide showcases key methods to establish big data technology in manufacturing business. It includes various tactics such as establishing transparent business KPI and measuring ROI, analyzing manufacturing problems and ensuring effective big data engineering process.
Analysis Icon Of Latest Market Research Trend Ppt PowerPoint Presentation File Images PDF
Persuade your audience using this analysis icon of latest market research trend ppt powerpoint presentation file images pdf. This PPT design covers one stages, thus making it a great tool to use. It also caters to a variety of topics including analysis icon of latest market research trend. Download this PPT design now to present a convincing pitch that not only emphasizes the topic but also showcases your presentation skills.
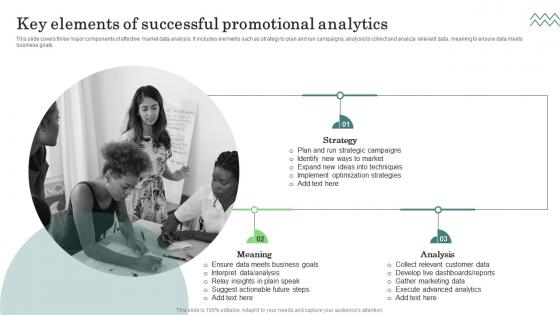
Key Elements Successful Major Promotional Analytics Future Trends Summary Pdf
This slide covers three major components of effective market data analysis. It includes elements such as strategy to plan and run campaigns, analysis to collect and analyze relevant data, meaning to ensure data meets business goals. Explore a selection of the finest Key Elements Successful Major Promotional Analytics Future Trends Summary Pdf here. With a plethora of professionally designed and pre made slide templates, you can quickly and easily find the right one for your upcoming presentation. You can use our Key Elements Successful Major Promotional Analytics Future Trends Summary Pdf to effectively convey your message to a wider audience. Slidegeeks has done a lot of research before preparing these presentation templates. The content can be personalized and the slides are highly editable. Grab templates today from Slidegeeks. This slide covers three major components of effective market data analysis. It includes elements such as strategy to plan and run campaigns, analysis to collect and analyze relevant data, meaning to ensure data meets business goals.
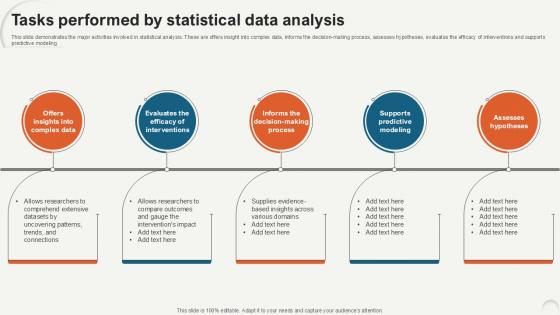
Tasks Performed By Statistical Data Analytics For Informed Decision Ppt Presentation
This slide demonstrates the major activities involved in statistical analysis. These are offers insight into complex data, informs the decision-making process, assesses hypotheses, evaluates the efficacy of interventions and supports predictive modeling. Present like a pro with Tasks Performed By Statistical Data Analytics For Informed Decision Ppt Presentation. Create beautiful presentations together with your team, using our easy-to-use presentation slides. Share your ideas in real-time and make changes on the fly by downloading our templates. So whether you are in the office, on the go, or in a remote location, you can stay in sync with your team and present your ideas with confidence. With Slidegeeks presentation got a whole lot easier. Grab these presentations today. This slide demonstrates the major activities involved in statistical analysis. These are offers insight into complex data, informs the decision-making process, assesses hypotheses, evaluates the efficacy of interventions and supports predictive modeling.

Monitoring And Reporting Healthcare Data And Analytics Guidelines PDF
This slide covers the actions performed to deploy data and analytics monitoring capabilities which focuses on market actions, assets and capabilities, and other considerations. Deliver an awe-inspiring pitch with this creative monitoring and reporting healthcare data and analytics guidelines pdf bundle. Topics like market actions, assets and capabilities, other considerations, data protection framework, social media capabilities can be discussed with this completely editable template. It is available for immediate download depending on the needs and requirements of the user.

Global Data Security Industry Report Exploring Recent Developments In Cybersecurity Industry IR SS V
The slide highlights recent news and developments of major key players in the cybersecurity industry, enabling stakeholders to stay informed and make informed decisions. It covers developments related to acquisitions, collaborations, new product launches, and investments. Whether you have daily or monthly meetings, a brilliant presentation is necessary. Global Data Security Industry Report Exploring Recent Developments In Cybersecurity Industry IR SS V can be your best option for delivering a presentation. Represent everything in detail using Global Data Security Industry Report Exploring Recent Developments In Cybersecurity Industry IR SS V and make yourself stand out in meetings. The template is versatile and follows a structure that will cater to your requirements. All the templates prepared by Slidegeeks are easy to download and edit. Our research experts have taken care of the corporate themes as well. So, give it a try and see the results. The slide highlights recent news and developments of major key players in the cybersecurity industry, enabling stakeholders to stay informed and make informed decisions. It covers developments related to acquisitions, collaborations, new product launches, and investments.
Key Metrics For Finance Unit Presentation Images
This is a key metrics for finance unit presentation images. This is a three stage process. The stages in this process are business, management, strategy, finance unit, marketing.
Data Analytics Vector Icon Ppt PowerPoint Presentation Professional
Presenting this set of slides with name data analytics vector icon ppt powerpoint presentation professional. This is a four stage process. The stages in this process are data visualization icon, research analysis, business focus. This is a completely editable PowerPoint presentation and is available for immediate download. Download now and impress your audience.
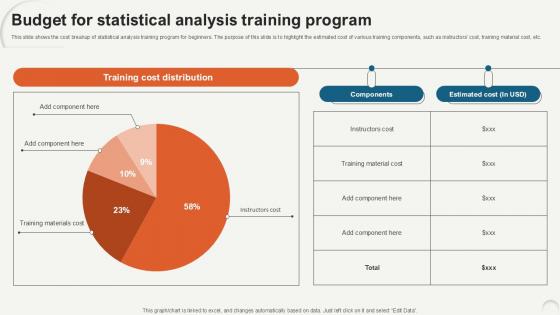
Budget For Statistical Data Analytics For Informed Decision Ppt Slide
This slide shows the cost breakup of statistical analysis training program for beginners. The purpose of this slide is to highlight the estimated cost of various training components, such as instructors cost, training material cost, etc. Do you have to make sure that everyone on your team knows about any specific topic I yes, then you should give Budget For Statistical Data Analytics For Informed Decision Ppt Slide a try. Our experts have put a lot of knowledge and effort into creating this impeccable Budget For Statistical Data Analytics For Informed Decision Ppt Slide. You can use this template for your upcoming presentations, as the slides are perfect to represent even the tiniest detail. You can download these templates from the Slidegeeks website and these are easy to edit. So grab these today This slide shows the cost breakup of statistical analysis training program for beginners. The purpose of this slide is to highlight the estimated cost of various training components, such as instructors cost, training material cost, etc.
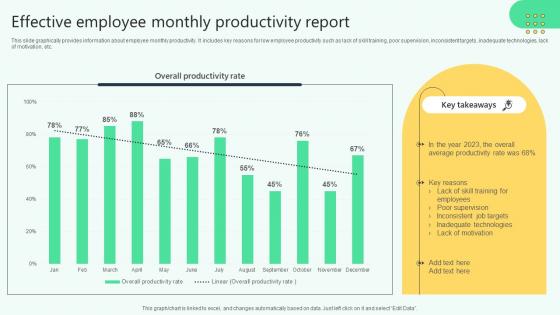
Effective Employee Monthly Productivity Report Analysing Hr Data For Effective Decision Making
This slide graphically provides information about employee monthly productivity. It includes key reasons for low employee productivity such as lack of skill training, poor supervision, inconsistent targets, inadequate technologies, lack of motivation, etc. If your project calls for a presentation, then Slidegeeks is your go-to partner because we have professionally designed, easy-to-edit templates that are perfect for any presentation. After downloading, you can easily edit Effective Employee Monthly Productivity Report Analysing Hr Data For Effective Decision Making and make the changes accordingly. You can rearrange slides or fill them with different images. Check out all the handy templates This slide graphically provides information about employee monthly productivity. It includes key reasons for low employee productivity such as lack of skill training, poor supervision, inconsistent targets, inadequate technologies, lack of motivation, etc.
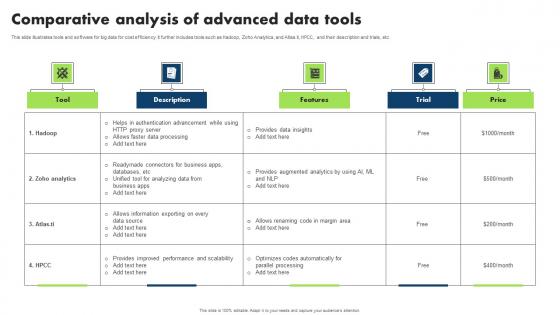
Comparative Analysis Of Advanced Data Tools Template Pdf
This slide illustrates tools and software for big data for cost efficiency. It further includes tools such as Hadoop, Zoho Analytics, and Atlas.ti, HPCC, and their description and trials, etc Showcasing this set of slides titled Comparative Analysis Of Advanced Data Tools Template Pdf. The topics addressed in these templates are Hadoop, Readymade Connectors Business, Unified Tool Analyzing Data. All the content presented in this PPT design is completely editable. Download it and make adjustments in color, background, font etc. as per your unique business setting. This slide illustrates tools and software for big data for cost efficiency. It further includes tools such as Hadoop, Zoho Analytics, and Atlas.ti, HPCC, and their description and trials, etc

Global Data Security Industry Report Challenges Impeding Cybersecurity Industry Growth IR SS V
The purpose of the slide is to analyze challenges facing cybersecurity industry. It will assist stakeholders to devise effective strategies and solutions to overcome the repercussions. It covers restraints like shortage skills, rapidly evolving threat landscape, budget constraints, cloud security concerns, IoT and connected devices. Want to ace your presentation in front of a live audience Our Global Data Security Industry Report Challenges Impeding Cybersecurity Industry Growth IR SS V can help you do that by engaging all the users towards you. Slidegeeks experts have put their efforts and expertise into creating these impeccable powerpoint presentations so that you can communicate your ideas clearly. Moreover, all the templates are customizable, and easy-to-edit and downloadable. Use these for both personal and commercial use. The purpose of the slide is to analyze challenges facing cybersecurity industry. It will assist stakeholders to devise effective strategies and solutions to overcome the repercussions. It covers restraints like shortage skills, rapidly evolving threat landscape, budget constraints, cloud security concerns, IoT and connected devices.
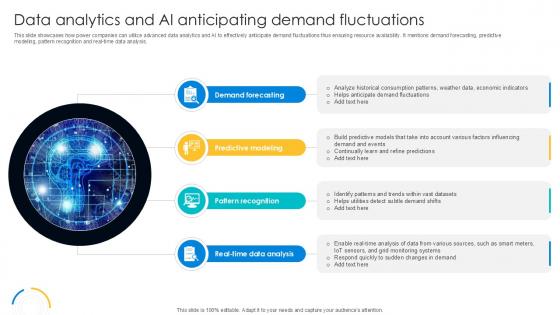
Data Analytics And AI Anticipating Digital Transformation Journey PPT Example DT SS V
This slide showcases how power companies can utilize advanced data analytics and AI to effectively anticipate demand fluctuations thus ensuring resource availability. It mentions demand forecasting, predictive modeling, pattern recognition and real-time data analysis. Formulating a presentation can take up a lot of effort and time, so the content and message should always be the primary focus. The visuals of the PowerPoint can enhance the presenters message, so our Data Analytics And AI Anticipating Digital Transformation Journey PPT Example DT SS V was created to help save time. Instead of worrying about the design, the presenter can concentrate on the message while our designers work on creating the ideal templates for whatever situation is needed. Slidegeeks has experts for everything from amazing designs to valuable content, we have put everything into Data Analytics And AI Anticipating Digital Transformation Journey PPT Example DT SS V This slide showcases how power companies can utilize advanced data analytics and AI to effectively anticipate demand fluctuations thus ensuring resource availability. It mentions demand forecasting, predictive modeling, pattern recognition and real-time data analysis.

Executive Project Status Report With Sprint Deliverables
Present like a pro with Executive Project Status Report With Sprint Deliverables. Create beautiful presentations together with your team, using our easy-to-use presentation slides. Share your ideas in real-time and make changes on the fly by downloading our templates. So whether you are in the office, on the go, or in a remote location, you can stay in sync with your team and present your ideas with confidence. With Slidegeeks presentation got a whole lot easier. Grab these presentations today. Use our professionally crafted template on topic Executive Project Status Report with Sprint Deliverables that helps to deliver effective presentations. Use data driven insights to effectively communicate progress and outcomes while capturing audience attention.
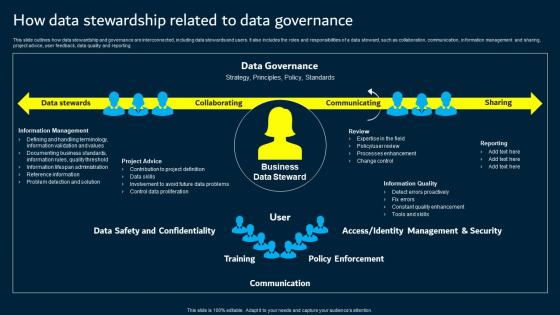
How Data Stewardship Related To Data Governance Data Custodianship Portrait Pdf
This slide outlines how data stewardship and governance are interconnected, including data stewards and users. It also includes the roles and responsibilities of a data steward, such as collaboration, communication, information management and sharing, project advice, user feedback, data quality and reporting. If your project calls for a presentation, then Slidegeeks is your go to partner because we have professionally designed, easy to edit templates that are perfect for any presentation. After downloading, you can easily edit How Data Stewardship Related To Data Governance Data Custodianship Portrait Pdf and make the changes accordingly. You can rearrange slides or fill them with different images. Check out all the handy templates This slide outlines how data stewardship and governance are interconnected, including data stewards and users. It also includes the roles and responsibilities of a data steward, such as collaboration, communication, information management and sharing, project advice, user feedback, data quality and reporting.
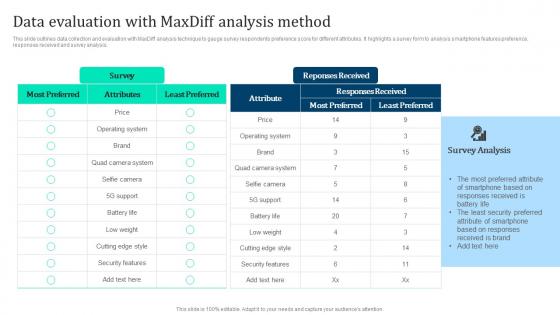
Data Evaluation MaxDiff Analysis Marketing Intelligence Guide Data Gathering Background Pdf
This slide outlines data collection and evaluation with MaxDiff analysis technique to gauge survey respondents preference score for different attributes. It highlights a survey form to analysis smartphone features preference, responses received and survey analysis. Present like a pro with Data Evaluation MaxDiff Analysis Marketing Intelligence Guide Data Gathering Background Pdf Create beautiful presentations together with your team, using our easy to use presentation slides. Share your ideas in real time and make changes on the fly by downloading our templates. So whether you are in the office, on the go, or in a remote location, you can stay in sync with your team and present your ideas with confidence. With Slidegeeks presentation got a whole lot easier. Grab these presentations today. This slide outlines data collection and evaluation with MaxDiff analysis technique to gauge survey respondents preference score for different attributes. It highlights a survey form to analysis smartphone features preference, responses received and survey analysis.
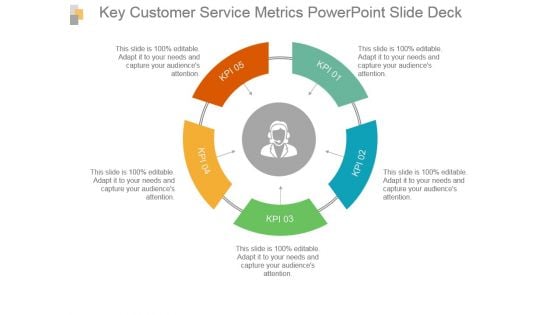
Key Customer Service Metrics Powerpoint Slide Deck
This is a key customer service metrics powerpoint slide deck. This is a five stage process. The stages in this process are process, management, arrow, marketing, strategy.
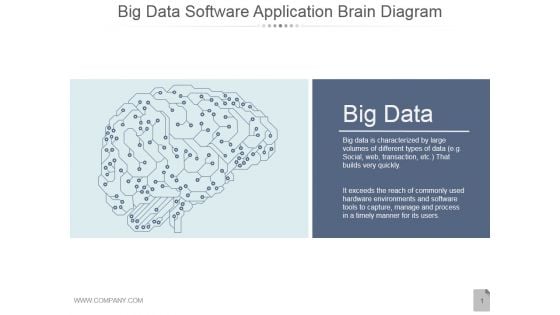
Big Data Software Application Brain Diagram Ppt PowerPoint Presentation Slides
This is a big data software application brain diagram ppt powerpoint presentation slides. This is a one stage process. The stages in this process are big data, communication, business, marketing, idea.
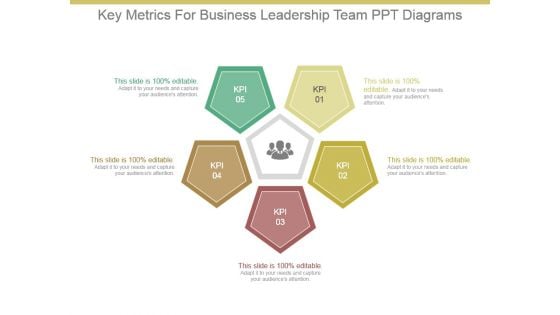
Key Metrics For Business Leadership Team Ppt Diagrams
This is a key metrics for business leadership team ppt diagrams. This is a five stage process. The stages in this process are kpi.
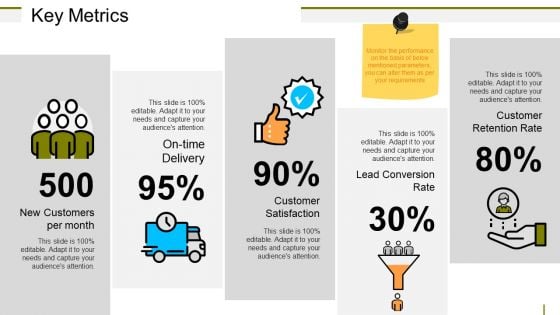
Key Metrics Ppt PowerPoint Presentation Model Portrait
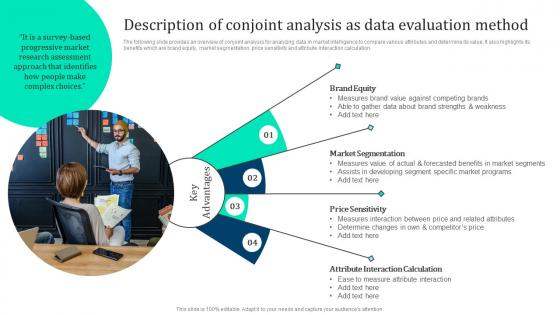
Description Conjoint Analysis Data Marketing Intelligence Guide Data Gathering Microsoft Pdf
The following slide provides an overview of conjoint analysis for analyzing data in market intelligence to compare various attributes and determine its value. It also highlights its benefits which are brand equity, market segmentation, price sensitivity and attribute interaction calculation. Do you have an important presentation coming up Are you looking for something that will make your presentation stand out from the rest Look no further than Description Conjoint Analysis Data Marketing Intelligence Guide Data Gathering Microsoft Pdf. With our professional designs, you can trust that your presentation will pop and make delivering it a smooth process. And with Slidegeeks, you can trust that your presentation will be unique and memorable. So why wait Grab Description Conjoint Analysis Data Marketing Intelligence Guide Data Gathering Microsoft Pdf today and make your presentation stand out from the rest The following slide provides an overview of conjoint analysis for analyzing data in market intelligence to compare various attributes and determine its value. It also highlights its benefits which are brand equity, market segmentation, price sensitivity and attribute interaction calculation.
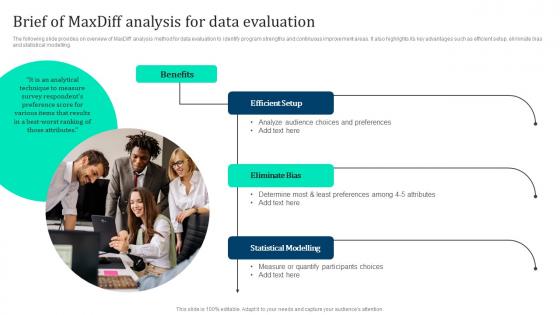
Brief Of MaxDiff Analysis Data Marketing Intelligence Guide Data Gathering Topics Pdf
The following slide provides on overview of MaxDiff analysis method for data evaluation to identify program strengths and continuous improvement areas. It also highlights its key advantages such as efficient setup, eliminate bias and statistical modelling. There are so many reasons you need a Brief Of MaxDiff Analysis Data Marketing Intelligence Guide Data Gathering Topics Pdf. The first reason is you can not spend time making everything from scratch, Thus, Slidegeeks has made presentation templates for you too. You can easily download these templates from our website easily. The following slide provides on overview of MaxDiff analysis method for data evaluation to identify program strengths and continuous improvement areas. It also highlights its key advantages such as efficient setup, eliminate bias and statistical modelling.
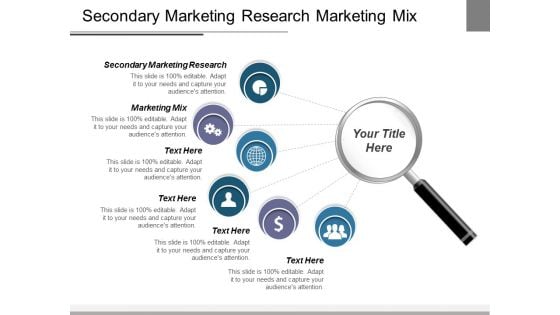
Secondary Marketing Research Marketing Mix Ppt PowerPoint Presentation Model Show
This is a secondary marketing research marketing mix ppt powerpoint presentation model show. This is a six stage process. The stages in this process are secondary marketing research, marketing mix.
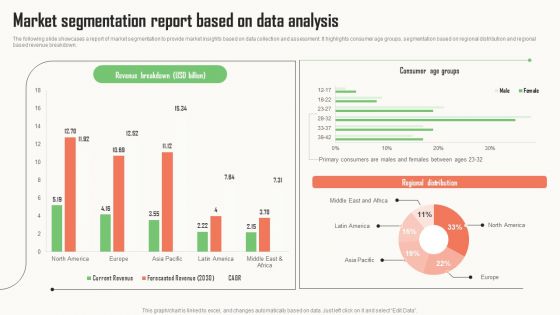
Strategic Market Insight Implementation Guide Market Segmentation Report Based On Data Analysis Themes PDF
The following slide showcases a report of market segmentation to provide market insights based on data collection and assessment. It highlights consumer age groups, segmentation based on regional distribution and regional based revenue breakdown. Presenting this PowerPoint presentation, titled Strategic Market Insight Implementation Guide Market Segmentation Report Based On Data Analysis Themes PDF, with topics curated by our researchers after extensive research. This editable presentation is available for immediate download and provides attractive features when used. Download now and captivate your audience. Presenting this Strategic Market Insight Implementation Guide Market Segmentation Report Based On Data Analysis Themes PDF. Our researchers have carefully researched and created these slides with all aspects taken into consideration. This is a completely customizable Strategic Market Insight Implementation Guide Market Segmentation Report Based On Data Analysis Themes PDF that is available for immediate downloading. Download now and make an impact on your audience. Highlight the attractive features available with our PPTs.
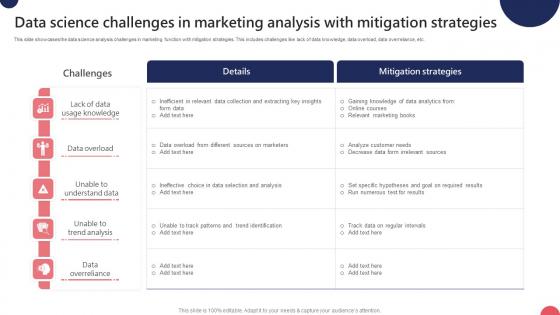
Data Science Challenges In Marketing Analysis With Mitigation Strategies Ppt Outline Pdf
This slide showcases the data science analysis challenges in marketing function with mitigation strategies. This includes challenges like lack of data knowledge, data overload, data overreliance, etc. Pitch your topic with ease and precision using this Data Science Challenges In Marketing Analysis With Mitigation Strategies Ppt Outline Pdf. This layout presents information on Data Knowledge, Data Overload, Data Overreliance. It is also available for immediate download and adjustment. So, changes can be made in the color, design, graphics or any other component to create a unique layout. This slide showcases the data science analysis challenges in marketing function with mitigation strategies. This includes challenges like lack of data knowledge, data overload, data overreliance, etc.
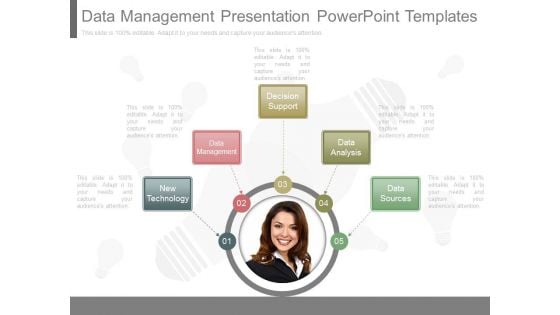
Data Management Presentation Powerpoint Templates
This is a data management presentation powerpoint templates. This is a five stage process. The stages in this process are new technology, data management, decision support, data analysis, data sources.
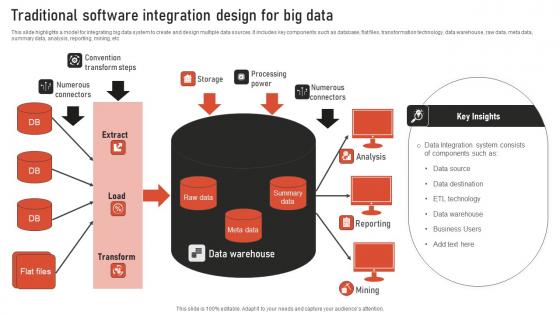
Traditional Software Integration Design For Big Data Microsoft Pdf
This slide highlights a model for integrating big data system to create and design multiple data sources. It includes key components such as database, flat files, transformation technology, data warehouse, raw data, meta data, summary data, analysis, reporting, mining, etc Showcasing this set of slides titled Traditional Software Integration Design For Big Data Microsoft Pdf. The topics addressed in these templates are Data Warehouse, Data Source, ETL Technology. All the content presented in this PPT design is completely editable. Download it and make adjustments in color, background, font etc. as per your unique business setting. This slide highlights a model for integrating big data system to create and design multiple data sources. It includes key components such as database, flat files, transformation technology, data warehouse, raw data, meta data, summary data, analysis, reporting, mining, etc
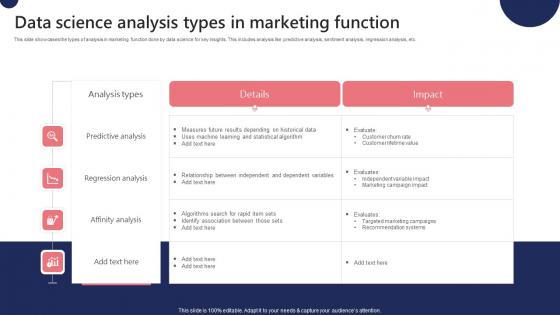
Data Science Analysis Types In Marketing Function Ppt Ideas Designs Download Pdf
This slide showcases the types of analysis in marketing function done by data science for key insights. This includes analysis like predictive analysis, sentiment analysis, regression analysis, etc. Pitch your topic with ease and precision using this Data Science Analysis Types In Marketing Function Ppt Ideas Designs Download Pdf. This layout presents information on Predictive Analysis, Sentiment Analysis, Regression Analysis. It is also available for immediate download and adjustment. So, changes can be made in the color, design, graphics or any other component to create a unique layout. This slide showcases the types of analysis in marketing function done by data science for key insights. This includes analysis like predictive analysis, sentiment analysis, regression analysis, etc.

Data Analysis Types Provides By BI Mockup Pdf
This slide represents the type of analytics provided by the business intelligence for business performance enhancement. This includes descriptive analysis, diagnostic analysis, predictive analytics, etc. Pitch your topic with ease and precision using this Data Analysis Types Provides By BI Mockup Pdf. This layout presents information on Descriptive Analytics, Diagnostic Analytics, Predictive Analytics. It is also available for immediate download and adjustment. So, changes can be made in the color, design, graphics or any other component to create a unique layout. This slide represents the type of analytics provided by the business intelligence for business performance enhancement. This includes descriptive analysis, diagnostic analysis, predictive analytics, etc.
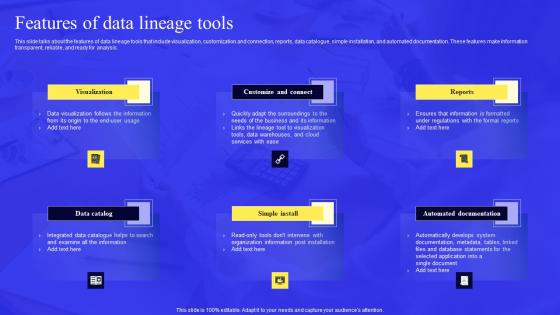
Business Process Data Lineage Features Of Data Lineage Tools Structure Pdf
This slide talks about the features of data lineage tools that include visualization, customization and connection, reports, data catalogue, simple installation, and automated documentation. These features make information transparent, reliable, and ready for analysis. The best PPT templates are a great way to save time, energy, and resources. Slidegeeks have 100 percent editable powerpoint slides making them incredibly versatile. With these quality presentation templates, you can create a captivating and memorable presentation by combining visually appealing slides and effectively communicating your message. Download Business Process Data Lineage Features Of Data Lineage Tools Structure Pdf from Slidegeeks and deliver a wonderful presentation. This slide talks about the features of data lineage tools that include visualization, customization and connection, reports, data catalogue, simple installation, and automated documentation. These features make information transparent, reliable, and ready for analysis.
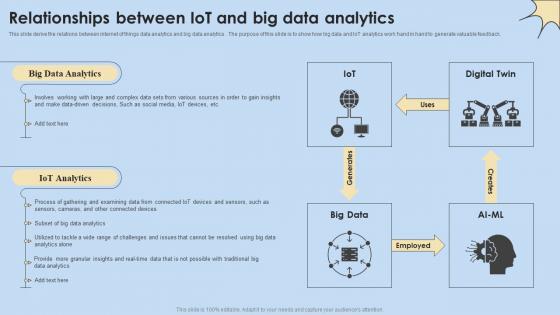
Relationships Between IoT And Big Data Analytics Internet Of Things Analysis Slides Pdf
This slide derive the relations between internet of things data analytics and big data analytics . The purpose of this slide is to show how big data and IoT analytics work hand in hand to generate valuable feedback. Here you can discover an assortment of the finest PowerPoint and Google Slides templates. With these templates, you can create presentations for a variety of purposes while simultaneously providing your audience with an eye-catching visual experience. Download Relationships Between IoT And Big Data Analytics Internet Of Things Analysis Slides Pdf to deliver an impeccable presentation. These templates will make your job of preparing presentations much quicker, yet still, maintain a high level of quality. Slidegeeks has experienced researchers who prepare these templates and write high-quality content for you. Later on, you can personalize the content by editing the Relationships Between IoT And Big Data Analytics Internet Of Things Analysis Slides Pdf. This slide derive the relations between internet of things data analytics and big data analytics . The purpose of this slide is to show how big data and IoT analytics work hand in hand to generate valuable feedback.
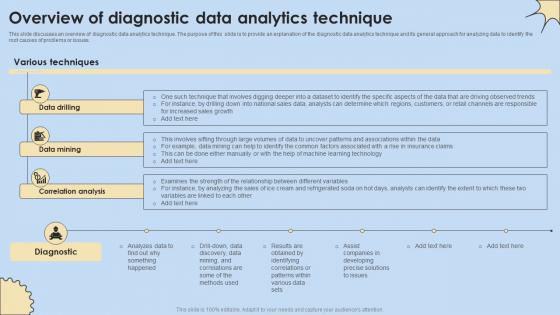
Overview Of Diagnostic Data Analytics Technique Internet Of Things Analysis Introduction Pdf
This slide discusses an overview of diagnostic data analytics technique. The purpose of this slide is to provide an explanation of the diagnostic data analytics technique and its general approach for analyzing data to identify the root causes of problems or issues. Are you searching for a Overview Of Diagnostic Data Analytics Technique Internet Of Things Analysis Introduction Pdf that is uncluttered, straightforward, and original It is easy to edit, and you can change the colors to suit your personal or business branding. For a presentation that expresses how much effort you have put in, this template is ideal With all of its features, including tables, diagrams, statistics, and lists, it is perfect for a business plan presentation. Make your ideas more appealing with these professional slides. Download Overview Of Diagnostic Data Analytics Technique Internet Of Things Analysis Introduction Pdf from Slidegeeks today. This slide discusses an overview of diagnostic data analytics technique. The purpose of this slide is to provide an explanation of the diagnostic data analytics technique and its general approach for analyzing data to identify the root causes of problems or issues.
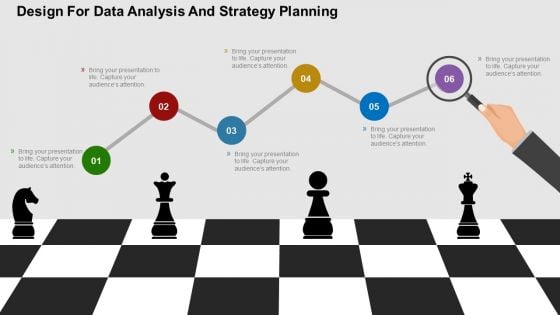
Design For Data Analysis And Strategy Planning Powerpoint Templates
This business slide has backdrop of chess game with six zigzag steps. You may download this slide for data analysis and strategy planning related topics. Illustrate your plans to your listeners with using this slide.
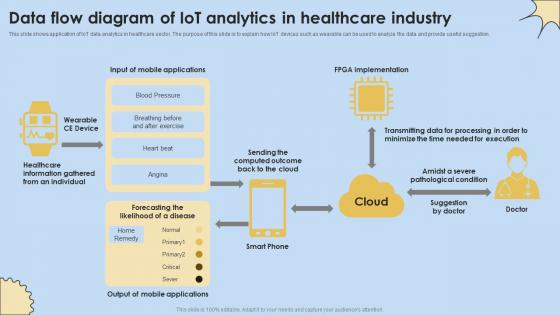
Data Flow Diagram Of IoT Analytics In Healthcare Industry Internet Of Things Analysis Clipart Pdf
This slide shows application of IoT data analytics in healthcare sector. The purpose of this slide is to explain how IoT devices such as wearable can be used to analyze the data and provide useful suggestion. If you are looking for a format to display your unique thoughts, then the professionally designed Data Flow Diagram Of IoT Analytics In Healthcare Industry Internet Of Things Analysis Clipart Pdf is the one for you. You can use it as a Google Slides template or a PowerPoint template. Incorporate impressive visuals, symbols, images, and other charts. Modify or reorganize the text boxes as you desire. Experiment with shade schemes and font pairings. Alter, share or cooperate with other people on your work. Download Data Flow Diagram Of IoT Analytics In Healthcare Industry Internet Of Things Analysis Clipart Pdf and find out how to give a successful presentation. Present a perfect display to your team and make your presentation unforgettable. This slide shows application of IoT data analytics in healthcare sector. The purpose of this slide is to explain how IoT devices such as wearable can be used to analyze the data and provide useful suggestion.
Recent BI Analysis Trends For Performance Enhancements Icons Pdf
This slide showcases the recent trends in BI analytics for business performance enhancement. This includes trends like augmented analytics, data discovery, data storytelling, Data quality management, etc. Pitch your topic with ease and precision using this Recent BI Analysis Trends For Performance Enhancements Icons Pdf. This layout presents information on Collaborative Business Intelligence, Embedded Analytics, Data Governance. It is also available for immediate download and adjustment. So, changes can be made in the color, design, graphics or any other component to create a unique layout. This slide showcases the recent trends in BI analytics for business performance enhancement. This includes trends like augmented analytics, data discovery, data storytelling, Data quality management, etc.
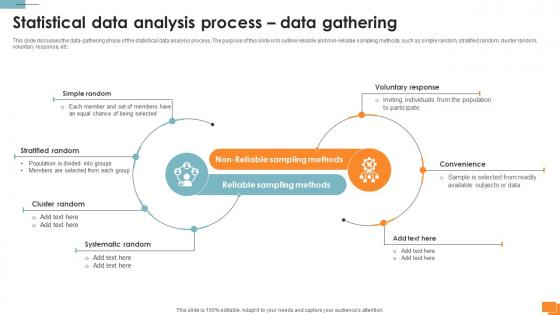
A132 Statistical Tools For Evidence Statistical Data Analysis Process Data Gathering
This slide discusses the data-gathering phase of the statistical data analysis process. The purpose of this slide is to outline reliable and non-reliable sampling methods, such as simple random, stratified random, cluster random, voluntary response, etc. Find a pre-designed and impeccable A132 Statistical Tools For Evidence Statistical Data Analysis Process Data Gathering. The templates can ace your presentation without additional effort. You can download these easy-to-edit presentation templates to make your presentation stand out from others. So, what are you waiting for Download the template from Slidegeeks today and give a unique touch to your presentation. This slide discusses the data-gathering phase of the statistical data analysis process. The purpose of this slide is to outline reliable and non-reliable sampling methods, such as simple random, stratified random, cluster random, voluntary response, etc.

Product Analytics Tool 2 Adobe Analytics To Generate Data Product Analytics Implementation Data Analytics V
This slide provides an overview of product analytic tool Adobe Analytics. It covers details regarding tool description, benefits and pricing plans such as select, prime and ultimate.Slidegeeks is here to make your presentations a breeze with Product Analytics Tool 2 Adobe Analytics To Generate Data Product Analytics Implementation Data Analytics V With our easy-to-use and customizable templates, you can focus on delivering your ideas rather than worrying about formatting. With a variety of designs to choose from, you are sure to find one that suits your needs. And with animations and unique photos, illustrations, and fonts, you can make your presentation pop. So whether you are giving a sales pitch or presenting to the board, make sure to check out Slidegeeks first This slide provides an overview of product analytic tool Adobe Analytics. It covers details regarding tool description, benefits and pricing plans such as select, prime and ultimate.

Marketing Intelligence Guide For Data Gathering And Analysis Ppt Powerpoint Presentation Complete Deck
Heres another Marketing Intelligence Guide For Data Gathering And Analysis Ppt Powerpoint Presentation Complete Deck that highlights your vision and mission for business. You can customize this template as per your liking and bring your passion and skills in the industry you have chosen to be in under the spotlight. Moreover,you can print this business plan template and share it with your employees to maintain clarity of thought. Click the link below and gain instant access to this complete deck of seventy nine slides. All of this is,of course,made even better with the capability of editability and complete customization that we offer. Download now. Our Marketing Intelligence Guide For Data Gathering And Analysis Ppt Powerpoint Presentation Complete Deck are topically designed to provide an attractive backdrop to any subject. Use them to look like a presentation pro.
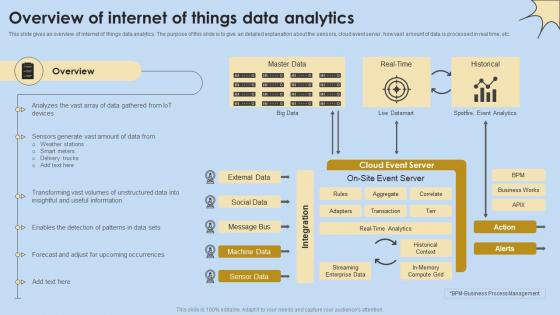
Overview Of Internet Of Things Data Analytics Internet Of Things Analysis Clipart Pdf
This slide gives an overview of internet of things data analytics. The purpose of this slide is to give an detailed explanation about the sensors, cloud event server, how vast amount of data is processed in real time, etc. Retrieve professionally designed Overview Of Internet Of Things Data Analytics Internet Of Things Analysis Clipart Pdf to effectively convey your message and captivate your listeners. Save time by selecting pre-made slideshows that are appropriate for various topics, from business to educational purposes. These themes come in many different styles, from creative to corporate, and all of them are easily adjustable and can be edited quickly. Access them as PowerPoint templates or as Google Slides themes. You do not have to go on a hunt for the perfect presentation because Slidegeeks got you covered from everywhere. This slide gives an overview of internet of things data analytics. The purpose of this slide is to give an detailed explanation about the sensors, cloud event server, how vast amount of data is processed in real time, etc.


 Continue with Email

 Home
Home


