Dashboards
Small Data Vs Big Data Ppt PowerPoint Presentation Icon Model
This is a small data vs big data ppt powerpoint presentation icon model. This is a two stage process. The stages in this process are small data, big data.
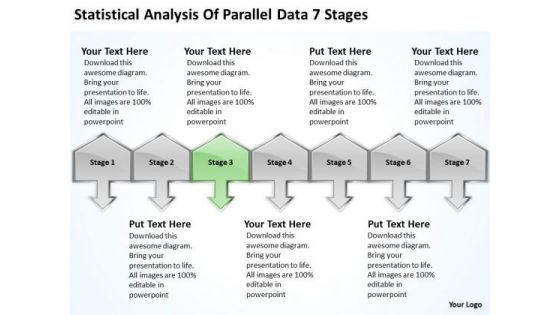
Analysis Of Parallel Data 7 Stages Ppt Franchise Business Plan Sample PowerPoint Slides
We present our analysis of parallel data 7 stages ppt franchise business plan sample PowerPoint Slides.Download our Arrows PowerPoint Templates because You have gained great respect for your brilliant ideas. Use our PowerPoint Templates and Slides to strengthen and enhance your reputation. Download and present our Shapes PowerPoint Templates because you can see clearly through to the bigger bowl ahead. Time your jump to perfection and hit the nail on the head. Download our Metaphors-Visual Concepts PowerPoint Templates because you know that the core of any organisation is the people who work for it. Use our Signs PowerPoint Templates because support groups are an essential element of the on going struggle against cancer. Download our Business PowerPoint Templates because this diagram can set an example to enthuse your team with the passion and fervour of your ideas.Use these PowerPoint slides for presentations relating to achieve, achievement, action, business, chinese, company, concept, conceptual, corporate, definition, idea, macro, market, nature, organization, paintbrush, plan, profit, research, results, sand, shape, single, success, successful, symbol, text, translation, treasure, vision, word. The prominent colors used in the PowerPoint template are Green, Gray, Black. People tell us our analysis of parallel data 7 stages ppt franchise business plan sample PowerPoint Slides are Quaint. Use our action PowerPoint templates and PPT Slides are Nifty. Use our analysis of parallel data 7 stages ppt franchise business plan sample PowerPoint Slides are Ultra. PowerPoint presentation experts tell us our corporate PowerPoint templates and PPT Slides are Magical. People tell us our analysis of parallel data 7 stages ppt franchise business plan sample PowerPoint Slides are Spiffy. Customers tell us our corporate PowerPoint templates and PPT Slides are Dynamic. Preach the value of good business ethics. Our Analysis Of Parallel Data 7 Stages Ppt Franchise Business Plan Sample PowerPoint Slides will keep the faith.
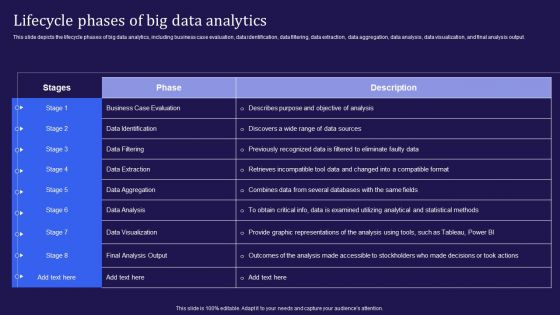
Big Data Analytics Lifecycle Lifecycle Phases Of Big Data Analytics Ppt Gallery Sample PDF
This slide depicts the lifecycle phases of big data analytics, including business case evaluation, data identification, data filtering, data extraction, data aggregation, data analysis, data visualization, and final analysis output. Slidegeeks is one of the best resources for PowerPoint templates. You can download easily and regulate Big Data Analytics Lifecycle Lifecycle Phases Of Big Data Analytics Ppt Gallery Sample PDF for your personal presentations from our wonderful collection. A few clicks is all it takes to discover and get the most relevant and appropriate templates. Use our Templates to add a unique zing and appeal to your presentation and meetings. All the slides are easy to edit and you can use them even for advertisement purposes.
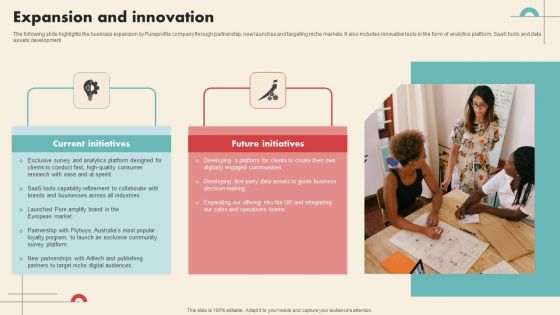
Data Driven Marketing Solutions Firm Company Profile Expansion And Innovation Summary PDF
The following slide highlights the business expansion by Pureprofile company through partnership, new launches and targeting niche markets. It also includes innovative tools in the form of analytics platform, SaaS tools and data assets development Are you in need of a template that can accommodate all of your creative concepts This one is crafted professionally and can be altered to fit any style. Use it with Google Slides or PowerPoint. Include striking photographs, symbols, depictions, and other visuals. Fill, move around, or remove text boxes as desired. Test out color palettes and font mixtures. Edit and save your work, or work with colleagues. Download Data Driven Marketing Solutions Firm Company Profile Expansion And Innovation Summary PDF and observe how to make your presentation outstanding. Give an impeccable presentation to your group and make your presentation unforgettable.
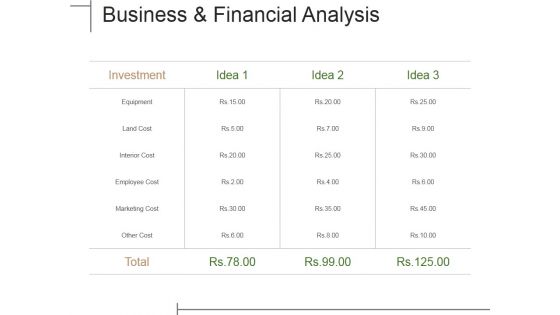
Business And Financial Analysis Ppt PowerPoint Presentation Portfolio Templates
This is a business and financial analysis ppt powerpoint presentation portfolio templates. This is a four stage process. The stages in this process are investment, tables, data analysis, marketing, equipment.
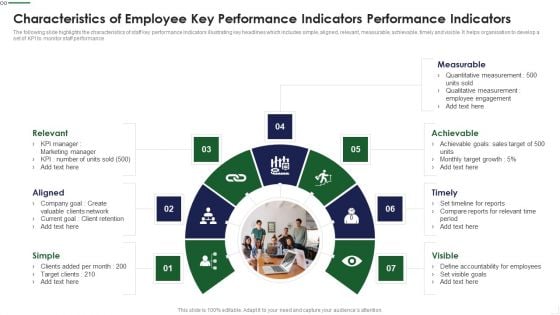
Characteristics Of Employee Key Performance Indicators Performance Indicators Guidelines PDF
The following slide highlights the characteristics of staff key performance Indicators illustrating key headlines which includes simple, aligned, relevant, measurable, achievable, timely and visible. It helps organisation to develop a set of KPI to monitor staff performance Presenting Characteristics Of Employee Key Performance Indicators Performance Indicators Guidelines PDF to dispense important information. This template comprises seven stages. It also presents valuable insights into the topics including Measurable, Achievable, Timely, Visible, Simple This is a completely customizable PowerPoint theme that can be put to use immediately. So, download it and address the topic impactfully.
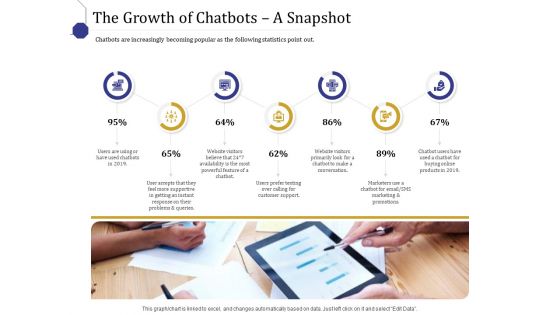
Boost Marketing And Sales Through Live Chat The Growth Of Chatbots A Snapshot Ppt File Slide Download PDF
Deliver and pitch your topic in the best possible manner with this boost marketing and sales through live chat the growth of chatbots a snapshot ppt file slide download pdf. Use them to share invaluable insights on the growth of chatbots a snapshot and impress your audience. This template can be altered and modified as per your expectations. So, grab it now.
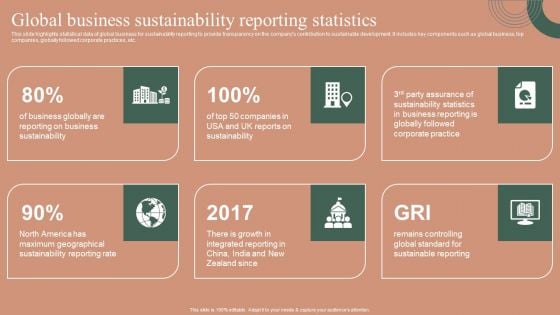
Global Business Sustainability Reporting Statistics Themes PDF
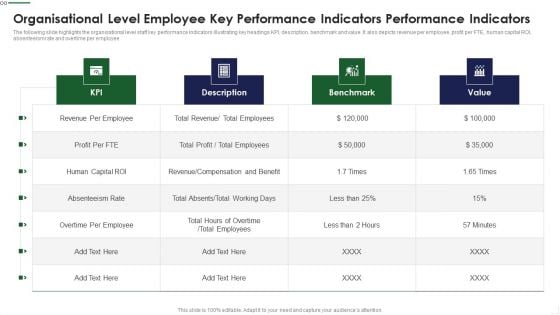
Organisational Level Employee Key Performance Indicators Performance Indicators Rules PDF
The following slide highlights the organisational level staff key performance Indicators illustrating key headings KPI, description, benchmark and value. It also depicts revenue per employee, profit per FTE, human capital ROI, absenteeism rate and overtime per employee Showcasing this set of slides titled Organisational Level Employee Key Performance Indicators Performance Indicators Rules PDF The topics addressed in these templates are Revenue Compensation, Overtime Employee, Benchmark All the content presented in this PPT design is completely editable. Download it and make adjustments in color, background, font etc. as per your unique business setting.
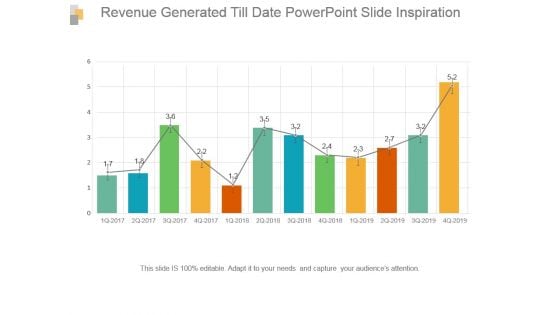
Revenue Generated Till Date Powerpoint Slide Inspiration
This is a revenue generated till date powerpoint slide inspiration. This is a twelve stage process. The stages in this process are bar graph, growth, success, data, analysis.
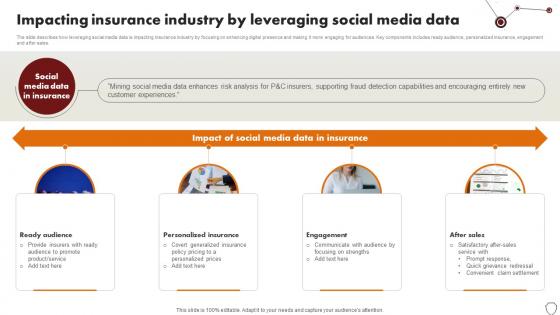
Technology Trends In Online Insurance Impacting Insurance Industry By Leveraging Social Media Data
The slide describes how leveraging social media data is impacting insurance industry by focusing on enhancing digital presence and making it more engaging for audiences. Key components includes ready audience, personalized insurance, engagement and after sales. Presenting this PowerPoint presentation, titled Technology Trends In Online Insurance Impacting Insurance Industry By Leveraging Social Media Data, with topics curated by our researchers after extensive research. This editable presentation is available for immediate download and provides attractive features when used. Download now and captivate your audience. Presenting this Technology Trends In Online Insurance Impacting Insurance Industry By Leveraging Social Media Data. Our researchers have carefully researched and created these slides with all aspects taken into consideration. This is a completely customizable Technology Trends In Online Insurance Impacting Insurance Industry By Leveraging Social Media Data that is available for immediate downloading. Download now and make an impact on your audience. Highlight the attractive features available with our PPTs. The slide describes how leveraging social media data is impacting insurance industry by focusing on enhancing digital presence and making it more engaging for audiences. Key components includes ready audience, personalized insurance, engagement and after sales.

Business Diagram Business Bar Graph For Data Analysis Presentation Template
This business slide displays pie charts with percentage ratios. This diagram is a data visualization tool that gives you a simple way to present statistical information. This slide helps your audience examines and interprets the data you present.
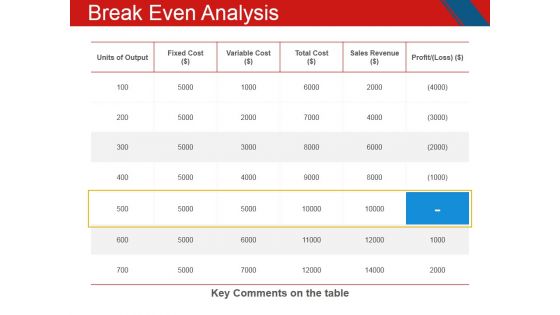
Break Even Analysis Ppt PowerPoint Presentation Inspiration Templates
This is a break even analysis ppt powerpoint presentation inspiration templates. This is a five stage process. The stages in this process are units of output, fixed cost, variable cost, total cost, sales revenue, profit.
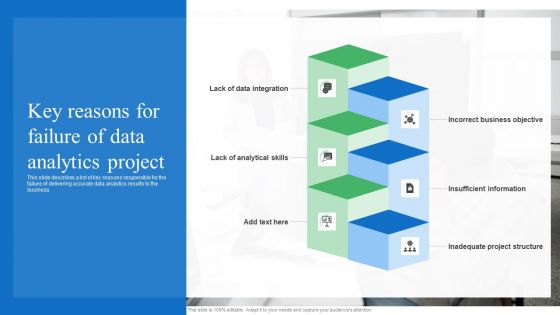
Toolkit For Data Science And Analytics Transition Key Reasons For Failure Of Data Analytics Project Portrait PDF
This slide describes a list of key reasons responsible for the failure of delivering accurate data analytics results to the business. Present like a pro with Toolkit For Data Science And Analytics Transition Key Reasons For Failure Of Data Analytics Project Portrait PDF Create beautiful presentations together with your team, using our easy to use presentation slides. Share your ideas in real time and make changes on the fly by downloading our templates. So whether you are in the office, on the go, or in a remote location, you can stay in sync with your team and present your ideas with confidence. With Slidegeeks presentation got a whole lot easier. Grab these presentations today.

Track Client Health Score Using Key Performance Indicators Summary PDF
This slide illustrates various key performance indicators used to analyze the performance of products and helps in measuring customer health scores. It includes metrics such as customer sentiment, customer engagement, customer ROI and customer feedback. Persuade your audience using this Track Client Health Score Using Key Performance Indicators Summary PDF. This PPT design covers four stages, thus making it a great tool to use. It also caters to a variety of topics including Customer Sentiment, Customer Engagement, Customer ROI. Download this PPT design now to present a convincing pitch that not only emphasizes the topic but also showcases your presentation skills.

Telecom Technology Industry Report With Growth Drivers Pictures PDF
The following slide highlights telecommunication technology industry report with growth drivers such as application services, BPO, digital operations, cybersecurity, data analytics, automation, robotics, business technology and consulting etc. Showcasing this set of slides titled Telecom Technology Industry Report With Growth Drivers Pictures PDF. The topics addressed in these templates are Application Services, Cybersecurity Data, Other Market Drivers. All the content presented in this PPT design is completely editable. Download it and make adjustments in color, background, font etc. as per your unique business setting.
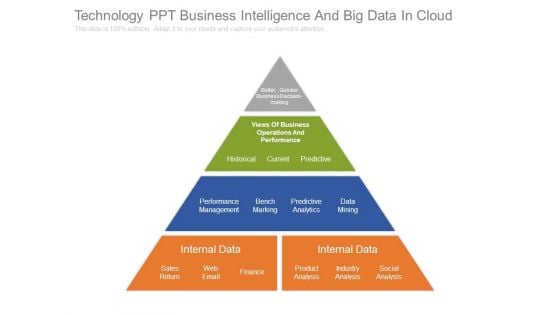
Technology Ppt Business Intelligence And Big Data In Cloud
This is a technology ppt business intelligence and big data in cloud. This is a four stage process. The stages in this process are better, quicker business decision making, views of business operations and performance, historical, current, predictive, performance management, bench marking, predictive analytics, data mining, internal data, sales return, web email, finance, product analysis, industry analysis, social analysis.
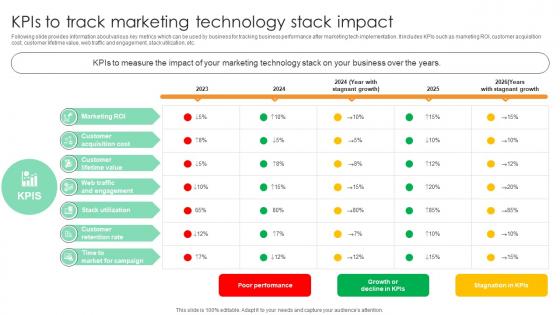
KPIs To Track Marketing Technology Stack Impact Comprehensive Guide For Marketing Technology
Following slide provides information about various key metrics which can be used by business for tracking business performance after marketing tech implementation. It includes KPIs such as marketing ROI, customer acquisition cost, customer lifetime value, web traffic and engagement, stack utilization, etc.There are so many reasons you need a KPIs To Track Marketing Technology Stack Impact Comprehensive Guide For Marketing Technology. The first reason is you can not spend time making everything from scratch, Thus, Slidegeeks has made presentation templates for you too. You can easily download these templates from our website easily. Following slide provides information about various key metrics which can be used by business for tracking business performance after marketing tech implementation. It includes KPIs such as marketing ROI, customer acquisition cost, customer lifetime value, web traffic and engagement, stack utilization, etc.
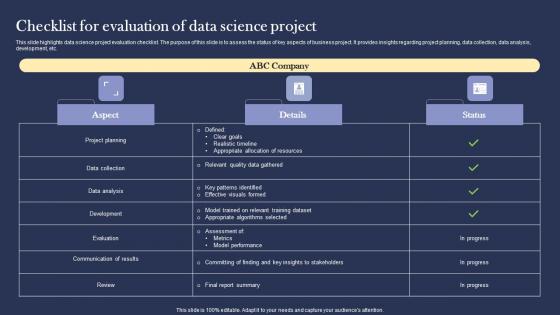
Checklist For Evaluation Of Data Science Project Ideas pdf
This slide highlights data science project evaluation checklist. The purpose of this slide is to assess the status of key aspects of business project. It provides insights regarding project planning, data collection, data analysis, development, etc. Pitch your topic with ease and precision using this Checklist For Evaluation Of Data Science Project Ideas pdf. This layout presents information on Data Collection, Data Analysis, Development. It is also available for immediate download and adjustment. So, changes can be made in the color, design, graphics or any other component to create a unique layout. This slide highlights data science project evaluation checklist. The purpose of this slide is to assess the status of key aspects of business project. It provides insights regarding project planning, data collection, data analysis, development, etc.
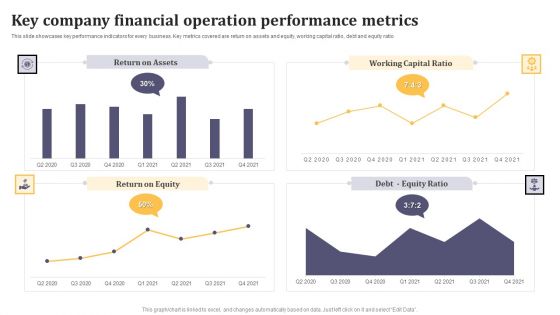
Key Company Financial Operation Performance Metrics Ppt Infographic Template Example Introduction PDF
This slide showcases key performance indicators for every business. Key metrics covered are return on assets and equity, working capital ratio, debt and equity ratio. Showcasing this set of slides titled Key Company Financial Operation Performance Metrics Ppt Infographic Template Example Introduction PDF. The topics addressed in these templates are Return on Assets, Working Capital Ratio, Return on Equity. All the content presented in this PPT design is completely editable. Download it and make adjustments in color, background, font etc. as per your unique business setting.
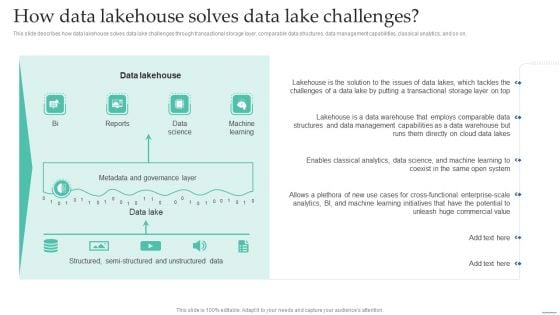
How Data Lakehouse Solves Data Lake Challenges Data Lake Creation With Hadoop Cluster Graphics PDF
This slide describes how data lakehouse solves data lake challenges through transactional storage layer, comparable data structures, data management capabilities, classical analytics, and so on.Do you have an important presentation coming up Are you looking for something that will make your presentation stand out from the rest Look no further than How Data Lakehouse Solves Data Lake Challenges Data Lake Creation With Hadoop Cluster Graphics PDF. With our professional designs, you can trust that your presentation will pop and make delivering it a smooth process. And with Slidegeeks, you can trust that your presentation will be unique and memorable. So why wait Grab How Data Lakehouse Solves Data Lake Challenges Data Lake Creation With Hadoop Cluster Graphics PDF today and make your presentation stand out from the rest.
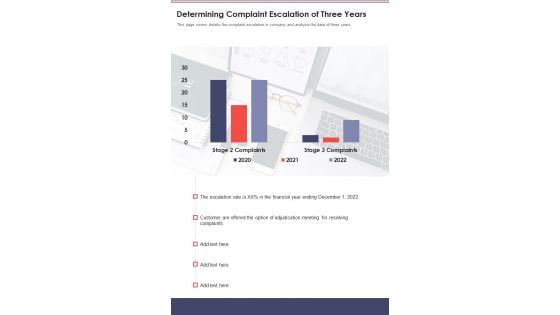
Determining Complaint Escalation Of Three Years Template 291 One Pager Documents
This page covers details the complaint escalation in company and analysis the data of three years. Presenting you an exemplary Determining Complaint Escalation Of Three Years Template 291 One Pager Documents. Our one-pager comprises all the must-have essentials of an inclusive document. You can edit it with ease, as its layout is completely editable. With such freedom, you can tweak its design and other elements to your requirements. Download this Determining Complaint Escalation Of Three Years Template 291 One Pager Documents brilliant piece now.

Market Research Study Template Ppt Sample
This is a market research study template ppt sample. This is a four stage process. The stages in this process are market size estimation, market crack down and data triangulation, market forecast model, key data points.
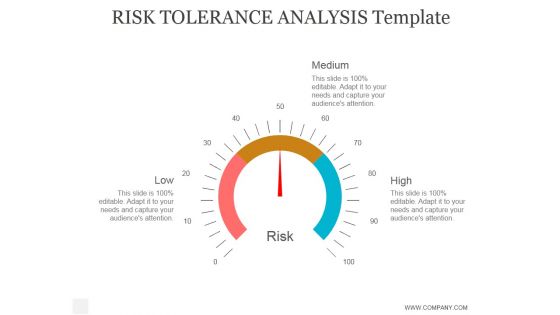
Risk Tolerance Analysis Template Ppt PowerPoint Presentation Example
This is a risk tolerance analysis template ppt powerpoint presentation example. This is a four stage process. The stages in this process are business, strategy, marketing, analysis, success, arrow.

Predictive Analytics In The Age Of Big Data Methods Of Data Clustering In Predictive Analytics Topics PDF
This slide outlines the two primary information clustering methods used in the predictive analytics clustering model. The methods include K-means and K-nearest neighbor clustering, including the working of both approaches. Slidegeeks is here to make your presentations a breeze with Predictive Analytics In The Age Of Big Data Methods Of Data Clustering In Predictive Analytics Topics PDF With our easy to use and customizable templates, you can focus on delivering your ideas rather than worrying about formatting. With a variety of designs to choose from, you are sure to find one that suits your needs. And with animations and unique photos, illustrations, and fonts, you can make your presentation pop. So whether you are giving a sales pitch or presenting to the board, make sure to check out Slidegeeks first.
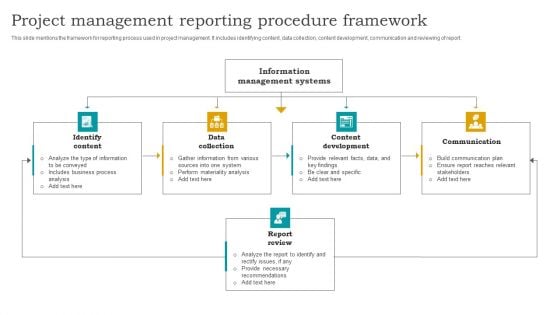
Project Management Reporting Procedure Framework Information PDF
This slide mentions the framework for reporting process used in project management. It includes identifying content, data collection, content development, communication and reviewing of report. Pitch your topic with ease and precision using this Project Management Reporting Procedure Framework Information PDF. This layout presents information on Data Collection, Content Development, Communication. It is also available for immediate download and adjustment. So, changes can be made in the color, design, graphics or any other component to create a unique layout.
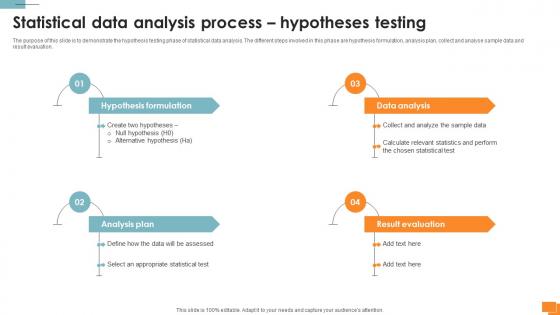
A134 Statistical Tools For Evidence Statistical Data Analysis Process Hypotheses Testing
The purpose of this slide is to demonstrate the hypothesis testing phase of statistical data analysis. The different steps involved in this phase are hypothesis formulation, analysis plan, collect and analyse sample data and result evaluation. Create an editable A134 Statistical Tools For Evidence Statistical Data Analysis Process Hypotheses Testing that communicates your idea and engages your audience. Whether you are presenting a business or an educational presentation, pre-designed presentation templates help save time. A134 Statistical Tools For Evidence Statistical Data Analysis Process Hypotheses Testing is highly customizable and very easy to edit, covering many different styles from creative to business presentations. Slidegeeks has creative team members who have crafted amazing templates. So, go and get them without any delay. The purpose of this slide is to demonstrate the hypothesis testing phase of statistical data analysis. The different steps involved in this phase are hypothesis formulation, analysis plan, collect and analyse sample data and result evaluation.
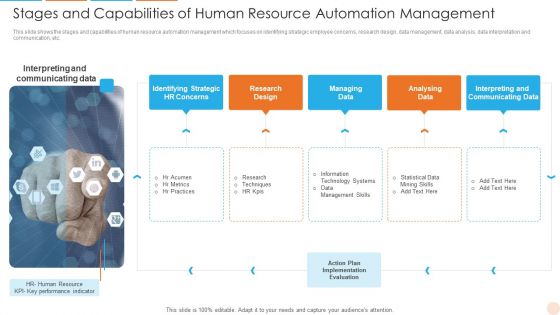
Stages And Capabilities Of Human Resource Automation Management Topics PDF
This slide shows the stages and capabilities of human resource automation management which focuses on identifying strategic employee concerns, research design, data management, data analysis, data interpretation and communication, etc. Persuade your audience using this Stages And Capabilities Of Human Resource Automation Management Topics PDF. This PPT design covers five stages, thus making it a great tool to use. It also caters to a variety of topics including Communicating Data, Strategic, Design. Download this PPT design now to present a convincing pitch that not only emphasizes the topic but also showcases your presentation skills.
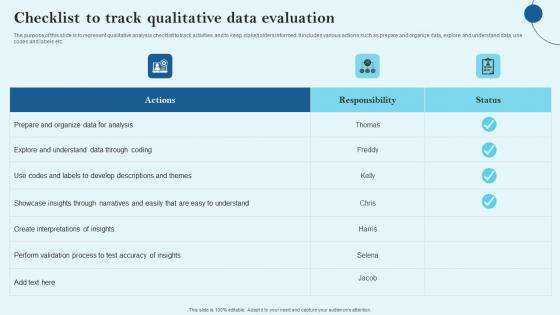
Checklist To Track Qualitative Data Evaluation Microsoft Pdf
The purpose of this slide is to represent qualitative analysis checklist to track activities and to keep stakeholders informed. It includes various actions such as prepare and organize data, explore and understand data, use codes and labels etc. Pitch your topic with ease and precision using this Checklist To Track Qualitative Data Evaluation Microsoft Pdf This layout presents information on Prepare And Organize, Data For Analysis, Responsibility It is also available for immediate download and adjustment. So, changes can be made in the color, design, graphics or any other component to create a unique layout. The purpose of this slide is to represent qualitative analysis checklist to track activities and to keep stakeholders informed. It includes various actions such as prepare and organize data, explore and understand data, use codes and labels etc.
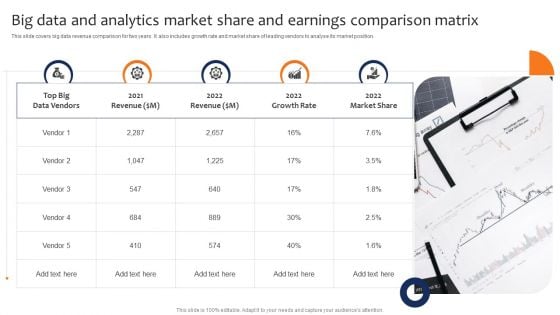
Big Data And Analytics Market Share And Earnings Comparison Matrix Elements PDF
This slide covers big data revenue comparison for two years. It also includes growth rate and market share of leading vendors to analyse its market position. Persuade your audience using this Big Data And Analytics Market Share And Earnings Comparison Matrix Elements PDF. This PPT design covers five stages, thus making it a great tool to use. It also caters to a variety of topics including Revenue, Growth Rate, Market Share. Download this PPT design now to present a convincing pitch that not only emphasizes the topic but also showcases your presentation skills.
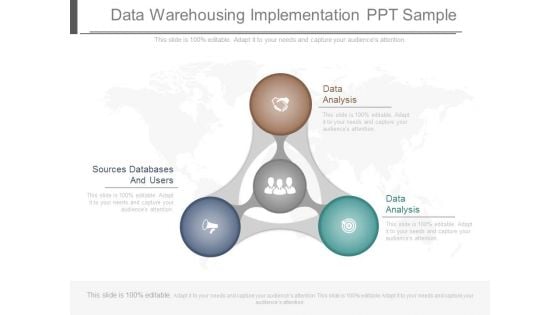
Data Warehousing Implementation Ppt Sample
This is a data warehousing implementation ppt sample. This is a three stage process. The stages in this process are data analysis, sources databases and users, data analysis.
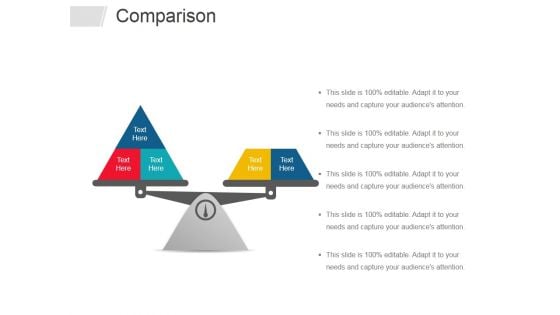
Comparison Ppt PowerPoint Presentation Infographic Template Graphics Tutorials
This is a comparison ppt powerpoint presentation infographic template graphics tutorials. This is a two stage process. The stages in this process are comparison, planning, business, management, marketing.
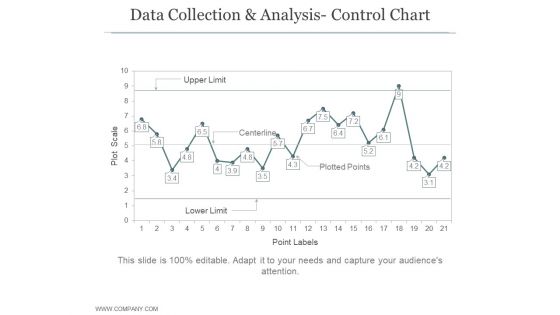
Data Collection And Analysis Control Chart Ppt PowerPoint Presentation Example File
This is a data collection and analysis control chart ppt powerpoint presentation example file. This is a four stage process. The stages in this process are business, strategy, marketing, bar graph, growth strategy.
Overview And Key Trends In Insurance Industry Effective General Insurance Marketing Icons Pdf
This slide presents an overview of the market and key trends in the insurance industry. It includes trends such as digital information, data analytics And AI, personalization, customer experience, collaboration And partnerships, and environmental and social responsibility. Slidegeeks is here to make your presentations a breeze with Overview And Key Trends In Insurance Industry Effective General Insurance Marketing Icons Pdf With our easy-to-use and customizable templates, you can focus on delivering your ideas rather than worrying about formatting. With a variety of designs to choose from, you are sure to find one that suits your needs. And with animations and unique photos, illustrations, and fonts, you can make your presentation pop. So whether you are giving a sales pitch or presenting to the board, make sure to check out Slidegeeks first. This slide presents an overview of the market and key trends in the insurance industry. It includes trends such as digital information, data analytics And AI, personalization, customer experience, collaboration And partnerships, and environmental and social responsibility.
Data Center Analytics Ppt PowerPoint Presentation Gallery Slides Cpb Pdf
Presenting this set of slides with name data center analytics ppt powerpoint presentation gallery slides cpb pdf. This is an editable Powerpoint four stages graphic that deals with topics like data center analytics to help convey your message better graphically. This product is a premium product available for immediate download and is 100 percent editable in Powerpoint. Download this now and use it in your presentations to impress your audience.
SAC Planning And Implementation Deployment Options For SAP Analytics Cloud Icons PDF
The purpose of this slide is to provide an information regarding the deployment methods for SAP Analytics Cloud implementation in the business organization. It also contains details of each deployment options key features. Presenting SAC Planning And Implementation Deployment Options For SAP Analytics Cloud Icons PDF to provide visual cues and insights. Share and navigate important information on two stages that need your due attention. This template can be used to pitch topics like Deployment Option Cloud, Most Suitable, Low implementation cost. In addtion, this PPT design contains high resolution images, graphics, etc, that are easily editable and available for immediate download.
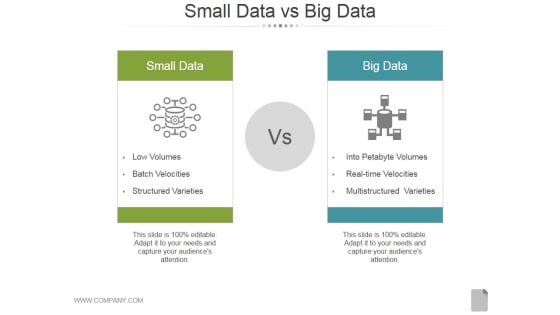
Small Data Vs Big Data Ppt PowerPoint Presentation Inspiration
This is a small data vs big data ppt powerpoint presentation inspiration. This is a two stage process. The stages in this process are low volumes, batch velocities, into petabyte volumes, multistructured varieties, structured varieties.
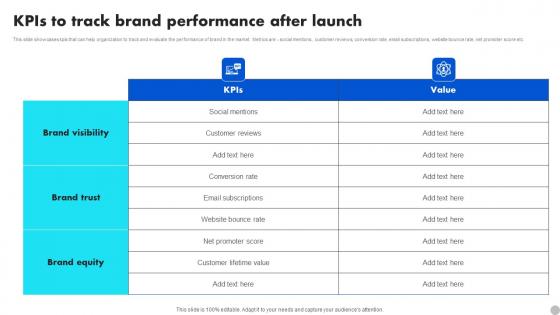
KPIS To Track Brand Performance After Launch Brand Diversification Approach Elements Pdf
This slide showcases kpis that can help organization to track and evaluate the performance of brand in the market. Metrics are social mentions, customer reviews, conversion rate, email subscriptions, website bounce rate, net promoter score etc. The KPIS To Track Brand Performance After Launch Brand Diversification Approach Elements Pdf is a compilation of the most recent design trends as a series of slides. It is suitable for any subject or industry presentation, containing attractive visuals and photo spots for businesses to clearly express their messages. This template contains a variety of slides for the user to input data, such as structures to contrast two elements, bullet points, and slides for written information. Slidegeeks is prepared to create an impression. This slide showcases kpis that can help organization to track and evaluate the performance of brand in the market. Metrics are social mentions, customer reviews, conversion rate, email subscriptions, website bounce rate, net promoter score etc.
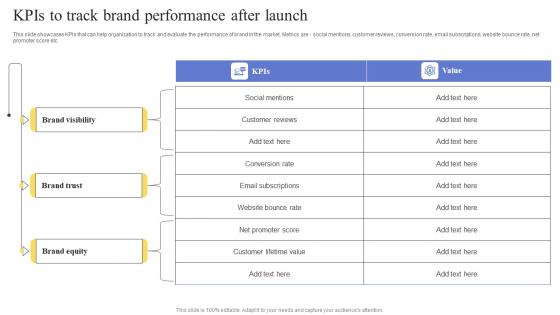
KPIS To Track Brand Performance After Launch Maximizing Revenue Using Demonstration Pdf
This slide showcases KPIs that can help organization to track and evaluate the performance of brand in the market. Metrics are - social mentions, customer reviews, conversion rate, email subscriptions, website bounce rate, net promoter score etc. The KPIS To Track Brand Performance After Launch Maximizing Revenue Using Demonstration Pdf is a compilation of the most recent design trends as a series of slides. It is suitable for any subject or industry presentation, containing attractive visuals and photo spots for businesses to clearly express their messages. This template contains a variety of slides for the user to input data, such as structures to contrast two elements, bullet points, and slides for written information. Slidegeeks is prepared to create an impression. This slide showcases KPIs that can help organization to track and evaluate the performance of brand in the market. Metrics are - social mentions, customer reviews, conversion rate, email subscriptions, website bounce rate, net promoter score etc.
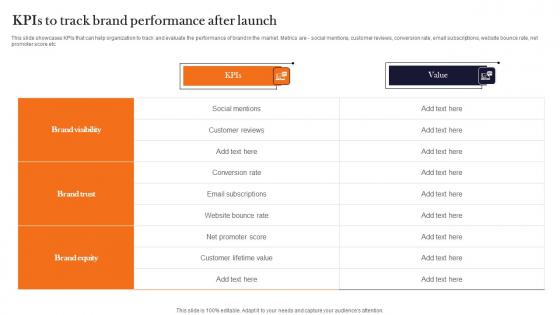
Kpis To Track Brand Performance After Launch Product Advertising And Positioning Pictures Pdf
This slide showcases KPIs that can help organization to track and evaluate the performance of brand in the market. Metrics are social mentions, customer reviews, conversion rate, email subscriptions, website bounce rate, net promoter score etc. The Kpis To Track Brand Performance After Launch Product Advertising And Positioning Pictures Pdf is a compilation of the most recent design trends as a series of slides. It is suitable for any subject or industry presentation, containing attractive visuals and photo spots for businesses to clearly express their messages. This template contains a variety of slides for the user to input data, such as structures to contrast two elements, bullet points, and slides for written information. Slidegeeks is prepared to create an impression. This slide showcases KPIs that can help organization to track and evaluate the performance of brand in the market. Metrics are social mentions, customer reviews, conversion rate, email subscriptions, website bounce rate, net promoter score etc.
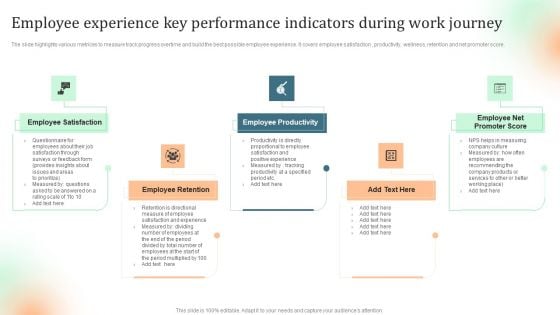
Employee Experience Key Performance Indicators During Work Journey Topics PDF
The slide highlights various metrices to measure track progress overtime and build the best possible employee experience. It covers employee satisfaction , productivity, wellness, retention and net promoter score. Presenting Employee Experience Key Performance Indicators During Work Journey Topics PDF to dispense important information. This template comprises five stages. It also presents valuable insights into the topics including Employee Productivity, Employee Retention, Employee Satisfaction. This is a completely customizable PowerPoint theme that can be put to use immediately. So, download it and address the topic impactfully.

Splunk Analysis Of Big Data To Assess Business Value Sample Pdf
Following slide showcases splunk big data analysis to evaluate business value. The purpose of this slide is to help businesses in forming better decisions by providing insights into their data. It includes components such as search, deploy, proactive monitoring, etc. Showcasing this set of slides titled Splunk Analysis Of Big Data To Assess Business Value Sample Pdf The topics addressed in these templates are Enterprise Scalability, Operational Intelligence All the content presented in this PPT design is completely editable. Download it and make adjustments in color, background, font etc. as per your unique business setting. Following slide showcases splunk big data analysis to evaluate business value. The purpose of this slide is to help businesses in forming better decisions by providing insights into their data. It includes components such as search, deploy, proactive monitoring, etc.
Key Performance Indicators Construction Company Icons PDF
The slide shows the key Performance Indicator KPI s which will help the company to track the success rate of implemented strategies. Major KPIs include Number of construction projects, Number of construction defect, Total project cost, customer satisfaction level etc. Deliver and pitch your topic in the best possible manner with this key performance indicators construction company icons pdf. Use them to share invaluable insights on key performance indicators construction company and impress your audience. This template can be altered and modified as per your expectations. So, grab it now.

Pharmaceutical Company Key Performance Indicators Clipart PDF
The slide shows the key Performance Indicator KPI s which will help the company to track the success rate of implemented strategies. Major KPIs include number of products sold, pharma products manufactures, research and development expenses per year, total number of patients, etc.Presenting pharmaceutical company key performance indicators clipart pdf to provide visual cues and insights. Share and navigate important information on one stage that need your due attention. This template can be used to pitch topics like research and development, key performance indicator, pharma products manufactured In addtion, this PPT design contains high resolution images, graphics, etc, that are easily editable and available for immediate download.
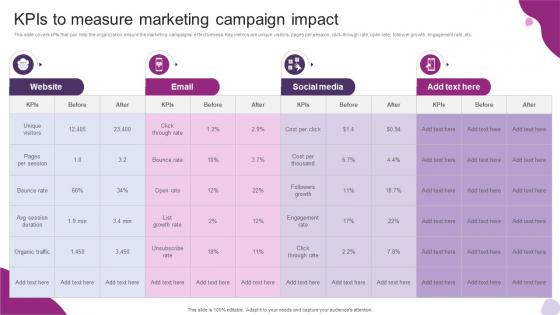
Kpis To Measure Marketing Campaign Impact Powerful Marketing Techniques Strategy SS V
This slide covers kPIs that can help the organization ensure the marketing campaigns effectiveness. Key metrics are unique visitors, pages per session, click-through rate, open rate, follower growth, engagement rate, etc. Do you know about Slidesgeeks Kpis To Measure Marketing Campaign Impact Powerful Marketing Techniques Strategy SS V These are perfect for delivering any kind od presentation. Using it, create PowerPoint presentations that communicate your ideas and engage audiences. Save time and effort by using our pre-designed presentation templates that are perfect for a wide range of topic. Our vast selection of designs covers a range of styles, from creative to business, and are all highly customizable and easy to edit. Download as a PowerPoint template or use them as Google Slides themes. This slide covers kPIs that can help the organization ensure the marketing campaigns effectiveness. Key metrics are unique visitors, pages per session, click-through rate, open rate, follower growth, engagement rate, etc.
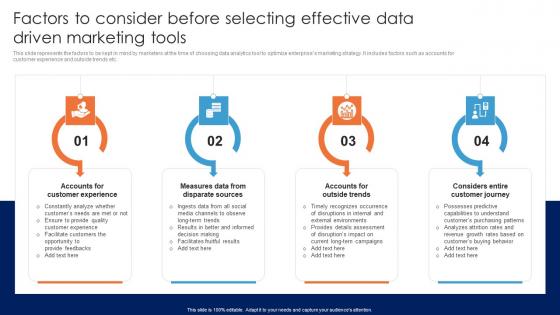
Factors To Consider Before Selecting Effective Guide For Data Driven Advertising Microsoft Pdf
This slide represents the factors to be kept in mind by marketers at the time of choosing data analytics tool to optimize enterprises marketing strategy. It includes factors such as accounts for customer experience and outside trends etc.Boost your pitch with our creative Factors To Consider Before Selecting Effective Guide For Data Driven Advertising Microsoft Pdf. Deliver an awe-inspiring pitch that will mesmerize everyone. Using these presentation templates you will surely catch everyones attention. You can browse the ppts collection on our website. We have researchers who are experts at creating the right content for the templates. So you do not have to invest time in any additional work. Just grab the template now and use them. This slide represents the factors to be kept in mind by marketers at the time of choosing data analytics tool to optimize enterprises marketing strategy. It includes factors such as accounts for customer experience and outside trends etc.

Business Data Analysis Inventory And Accounts Payable Days Ppt PowerPoint Presentation Layouts Professional
This is a business data analysis inventory and accounts payable days ppt powerpoint presentation layouts professional. This is a three stage process. The stages in this process are business analytics, ba, organizations data.
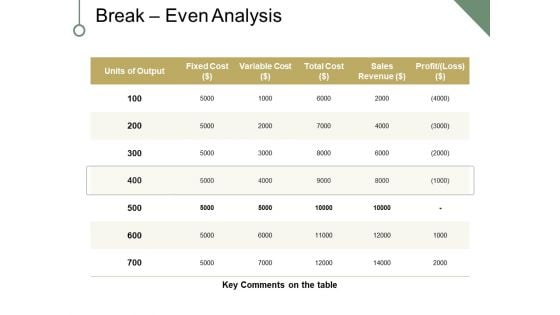
Break Even Analysis Ppt PowerPoint Presentation Portfolio Clipart
This is a break even analysis ppt powerpoint presentation portfolio clipart. This is a five stage process. The stages in this process are fixed cost, variable cost, sales revenue, profit, key comments on the table, units of output.
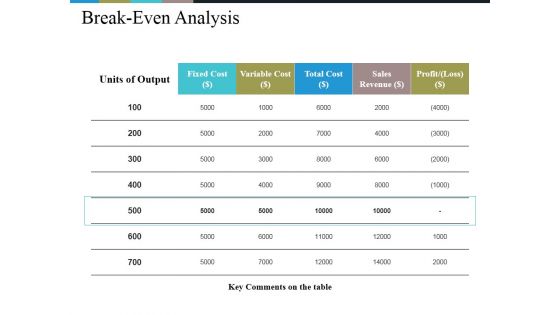
Break Even Analysis Ppt PowerPoint Presentation Styles Template
This is a break even analysis ppt powerpoint presentation styles template. This is a five stage process. The stages in this process are fixed cost, variable cost, key comments on the table, units of output, business.
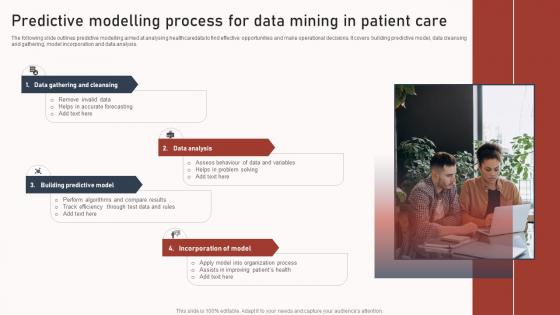
Predictive Modelling Process For Data Mining In Patient Care Slides Pdf
The following slide outlines predictive modelling aimed at analysing healthcaredata to find effective opportunities and make operational decisions. It covers building predictive model, data cleansing and gathering, model incorporation and data analysis. Showcasing this set of slides titled Predictive Modelling Process For Data Mining In Patient Care Slides Pdf. The topics addressed in these templates are Data Gathering Cleansing, Data Analysis, Incorporation Model. All the content presented in this PPT design is completely editable. Download it and make adjustments in color, background, font etc. as per your unique business setting. The following slide outlines predictive modelling aimed at analysing healthcaredata to find effective opportunities and make operational decisions. It covers building predictive model, data cleansing and gathering, model incorporation and data analysis.
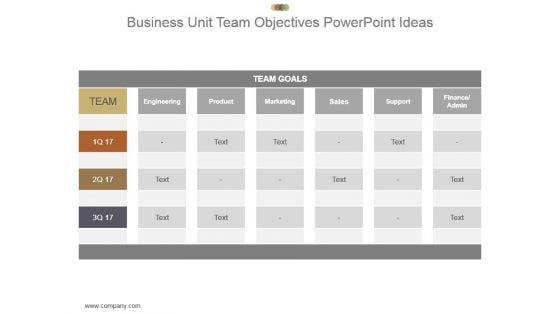
Business Unit Team Objectives Powerpoint Ideas
This is a business unit team objectives powerpoint ideas. This is a four stage process. The stages in this process are team, team goals, engineering, product, marketing, sales, support, finance admin.
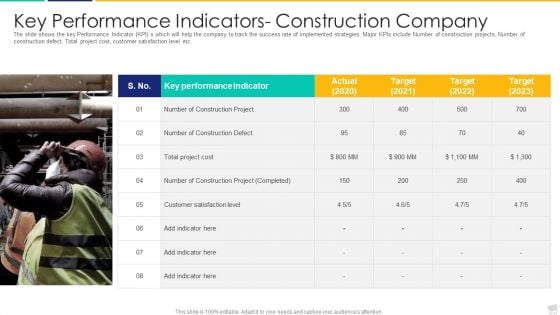
Key Performance Indicators- Construction Company Formats PDF
The slide shows the key Performance Indicator KPI s which will help the company to track the success rate of implemented strategies. Major KPIs include Number of construction projects, Number of construction defect, Total project cost, customer satisfaction level etc.Deliver an awe inspiring pitch with this creative key performance indicators construction company formats pdf bundle. Topics like construction project, customer satisfaction, performance indicator can be discussed with this completely editable template. It is available for immediate download depending on the needs and requirements of the user.
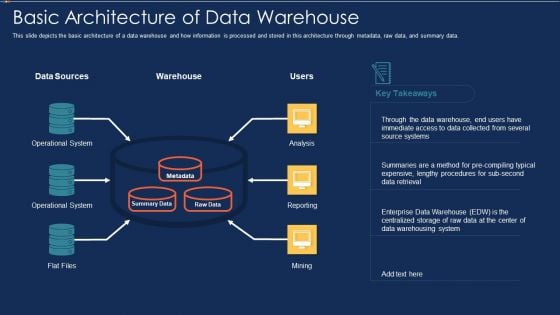
Data Warehousing IT Basic Architecture Of Data Warehouse Ppt Show Example PDF
This slide depicts the basic architecture of a data warehouse and how information is processed and stored in this architecture through metadata, raw data, and summary data. This is a data warehousing it basic architecture of data warehouse ppt show example pdf template with various stages. Focus and dispense information on six stages using this creative set, that comes with editable features. It contains large content boxes to add your information on topics like operational system, analysis, reporting, mining, flat files. You can also showcase facts, figures, and other relevant content using this PPT layout. Grab it now.
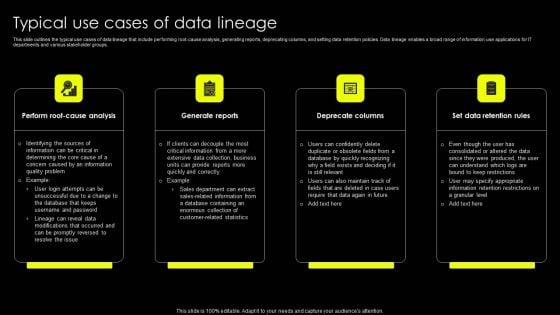
Data Lineage Implementation Typical Use Cases Of Data Lineage Pictures PDF
This slide outlines the typical use cases of data lineage that include performing root-cause analysis, generating reports, deprecating columns, and setting data retention policies. Data lineage enables a broad range of information use applications for IT departments and various stakeholder groups. Make sure to capture your audiences attention in your business displays with our gratis customizable Data Lineage Implementation Typical Use Cases Of Data Lineage Pictures PDF. These are great for business strategies, office conferences, capital raising or task suggestions. If you desire to acquire more customers for your tech business and ensure they stay satisfied, create your own sales presentation with these plain slides.
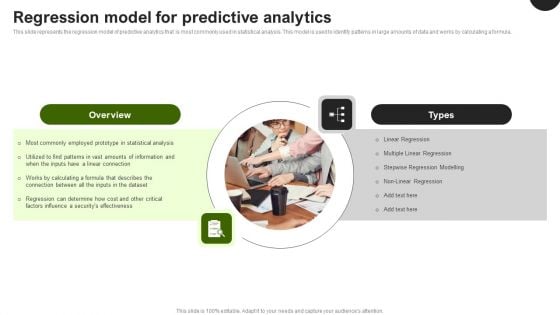
Predictive Analytics In The Age Of Big Data Regression Model For Predictive Analytics Elements PDF
This slide represents the regression model of predictive analytics that is most commonly used in statistical analysis. This model is used to identify patterns in large amounts of data and works by calculating a formula. Do you know about Slidesgeeks Predictive Analytics In The Age Of Big Data Regression Model For Predictive Analytics Elements PDF, These are perfect for delivering any kind od presentation. Using it, create PowerPoint presentations that communicate your ideas and engage audiences. Save time and effort by using our pre designed presentation templates that are perfect for a wide range of topic. Our vast selection of designs covers a range of styles, from creative to business, and are all highly customizable and easy to edit. Download as a PowerPoint template or use them as Google Slides themes.

Performing Basket Analysis In Ecommerce Using Data Mining Tools To Optimize Processes AI SS V
This slide showcases basket analysis, a data mining technique which can guide ecommerce websites to identify customer insights properly. It provides details about product affinities, shopper profile, planograms, product combos, etc. Presenting this PowerPoint presentation, titled Performing Basket Analysis In Ecommerce Using Data Mining Tools To Optimize Processes AI SS V, with topics curated by our researchers after extensive research. This editable presentation is available for immediate download and provides attractive features when used. Download now and captivate your audience. Presenting this Performing Basket Analysis In Ecommerce Using Data Mining Tools To Optimize Processes AI SS V. Our researchers have carefully researched and created these slides with all aspects taken into consideration. This is a completely customizable Performing Basket Analysis In Ecommerce Using Data Mining Tools To Optimize Processes AI SS V that is available for immediate downloading. Download now and make an impact on your audience. Highlight the attractive features available with our PPTs. This slide showcases basket analysis, a data mining technique which can guide ecommerce websites to identify customer insights properly. It provides details about product affinities, shopper profile, planograms, product combos, etc.
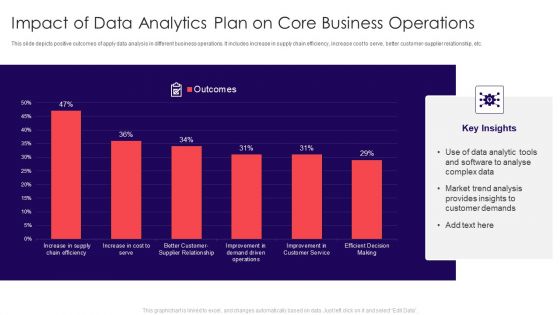
Impact Of Data Analytics Plan On Core Business Operations Summary PDF
This slide depicts positive outcomes of apply data analysis in different business operations. It includes increase in supply chain efficiency, increase cost to serve, better customer-supplier relationship, etc. Showcasing this set of slides titled Impact Of Data Analytics Plan On Core Business Operations Summary PDF. The topics addressed in these templates are Customer Demands, Market Trend Analysis, Complex Data. All the content presented in this PPT design is completely editable. Download it and make adjustments in color, background, font etc. as per your unique business setting.
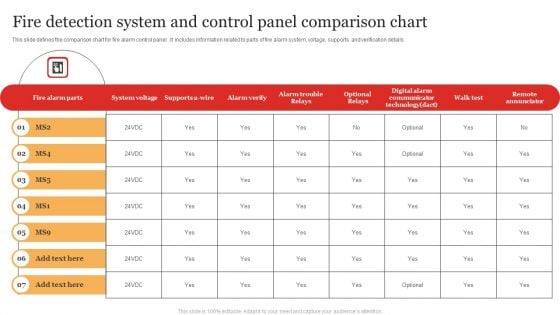
Fire Detection System And Control Panel Comparison Chart Information PDF
Pitch your topic with ease and precision using this Fire Detection System And Control Panel Comparison Chart Information PDF. This layout presents information on Digital Communicator, System Voltage, Remote Annunciator. It is also available for immediate download and adjustment. So, changes can be made in the color, design, graphics or any other component to create a unique layout.
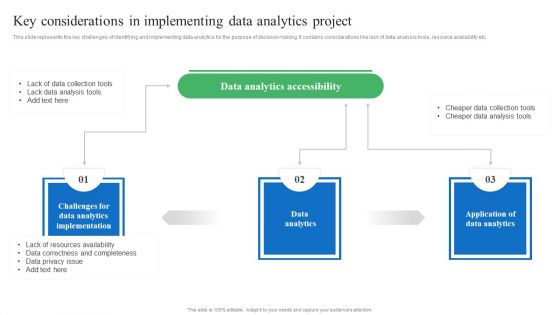
Toolkit For Data Science And Analytics Transition Key Considerations In Implementing Data Analytics Project Download PDF
This slide represents the key challenges of identifying and implementing data analytics for the purpose of decision making. It contains considerations like lack of data analysis tools, resource availability etc. From laying roadmaps to briefing everything in detail, our templates are perfect for you. You can set the stage with your presentation slides. All you have to do is download these easy to edit and customizable templates. Toolkit For Data Science And Analytics Transition Key Considerations In Implementing Data Analytics Project Download PDF will help you deliver an outstanding performance that everyone would remember and praise you for. Do download this presentation today.
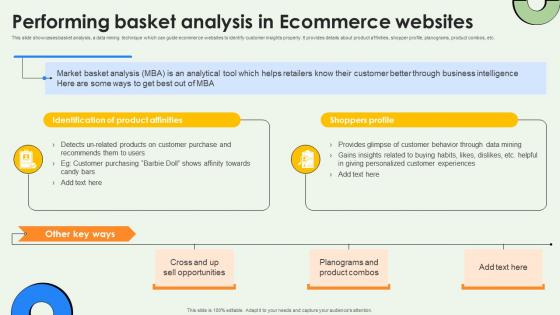
Data Warehousing And Performing Basket Analysis In Ecommerce Websites AI SS V
This slide showcases basket analysis, a data mining technique which can guide ecommerce websites to identify customer insights properly. It provides details about product affinities, shopper profile, planograms, product combos, etc. If you are looking for a format to display your unique thoughts, then the professionally designed Data Warehousing And Performing Basket Analysis In Ecommerce Websites AI SS V is the one for you. You can use it as a Google Slides template or a PowerPoint template. Incorporate impressive visuals, symbols, images, and other charts. Modify or reorganize the text boxes as you desire. Experiment with shade schemes and font pairings. Alter, share or cooperate with other people on your work. Download Data Warehousing And Performing Basket Analysis In Ecommerce Websites AI SS V and find out how to give a successful presentation. Present a perfect display to your team and make your presentation unforgettable. This slide showcases basket analysis, a data mining technique which can guide ecommerce websites to identify customer insights properly. It provides details about product affinities, shopper profile, planograms, product combos, etc.


 Continue with Email

 Home
Home


