Dashboards
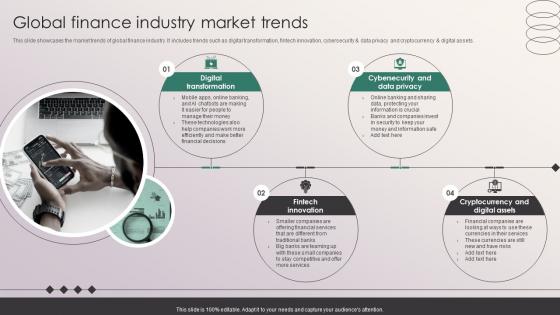
Global Finance Industry Market Trends Penetrating Markets With Financial Strategy SS V
This slide showcases the market trends of global finance industry. It includes trends such as digital transformation, fintech innovation, cybersecurity and data privacy and cryptocurrency and digital assets. If your project calls for a presentation, then Slidegeeks is your go to partner because we have professionally designed, easy to edit templates that are perfect for any presentation. After downloading, you can easily edit Global Finance Industry Market Trends Penetrating Markets With Financial Strategy SS V and make the changes accordingly. You can rearrange slides or fill them with different images. Check out all the handy templates This slide showcases the market trends of global finance industry. It includes trends such as digital transformation, fintech innovation, cybersecurity and data privacy and cryptocurrency and digital assets.
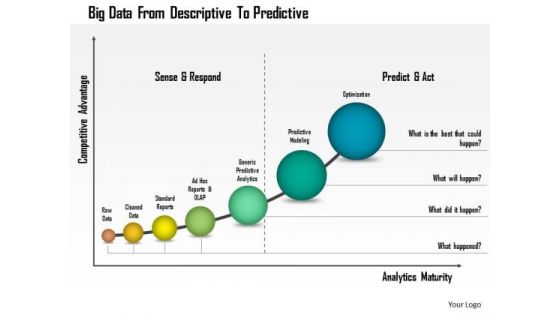
Business Diagram Big Data From Descriptive To Predictive Presentation Template
This business diagram has been designed with graphic of linear bar graph. This growing bar graph depicts the concept of big data analysis. Use this professional diagram for your financial and business analysis.
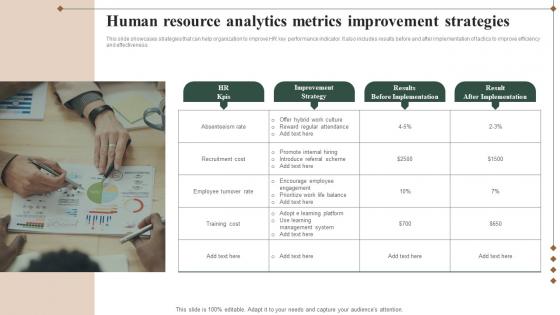
Human Resource Analytics Metrics Improvement Strategies Professional Pdf
This slide showcases strategies that can help organization to improve HR key performance indicator. It also includes results before and after implementation of tactics to improve efficiency and effectiveness.Showcasing this set of slides titled Human Resource Analytics Metrics Improvement Strategies Professional Pdf The topics addressed in these templates are Absenteeism Rate, Employee Turnover, Training Cost All the content presented in this PPT design is completely editable. Download it and make adjustments in color, background, font etc. as per your unique business setting. This slide showcases strategies that can help organization to improve HR key performance indicator. It also includes results before and after implementation of tactics to improve efficiency and effectiveness.
Digital Marketing Data Expansion Trends Icon Sample PDF
Presenting Digital Marketing Data Expansion Trends Icon Sample PDF to dispense important information. This template comprises three stages. It also presents valuable insights into the topics including Digital Marketing, Data Expansion, Trends Icon. This is a completely customizable PowerPoint theme that can be put to use immediately. So, download it and address the topic impactfully.
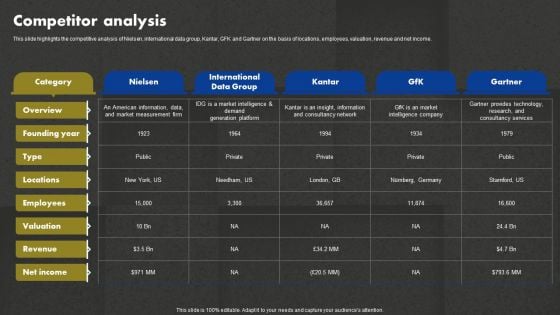
Data And Customer Analysis Company Outline Competitor Analysis Topics PDF
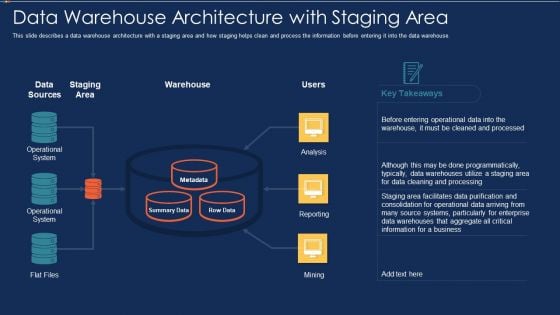
Data Warehousing IT Data Warehouse Architecture With Staging Area Ppt Styles Objects PDF
This slide describes a data warehouse architecture with a staging area and how staging helps clean and process the information before entering it into the data warehouse. Presenting data warehousing it data warehouse architecture with staging area ppt styles objects pdf to provide visual cues and insights. Share and navigate important information on three stages that need your due attention. This template can be used to pitch topics like operational system, analysis, reporting, mining, flat files. In addtion, this PPT design contains high resolution images, graphics, etc, that are easily editable and available for immediate download.
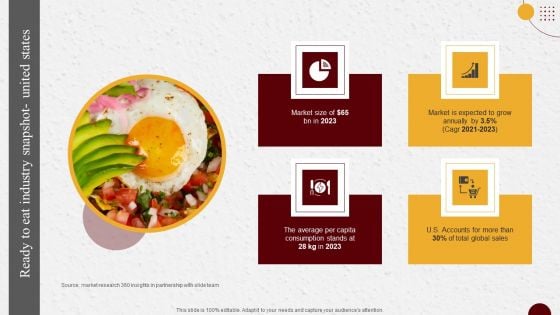
Industry Report Of Packaged Food Products Part 1 Ready To Eat Industry Snapshot United States Elements PDF
Are you searching for a Industry Report Of Packaged Food Products Part 1 Ready To Eat Industry Snapshot United States Elements PDF that is uncluttered, straightforward, and original Its easy to edit, and you can change the colors to suit your personal or business branding. For a presentation that expresses how much effort you have put in, this template is ideal. With all of its features, including tables, diagrams, statistics, and lists, its perfect for a business plan presentation. Make your ideas more appealing with these professional slides. Download Industry Report Of Packaged Food Products Part 1 Ready To Eat Industry Snapshot United States Elements PDF from Slidegeeks today.
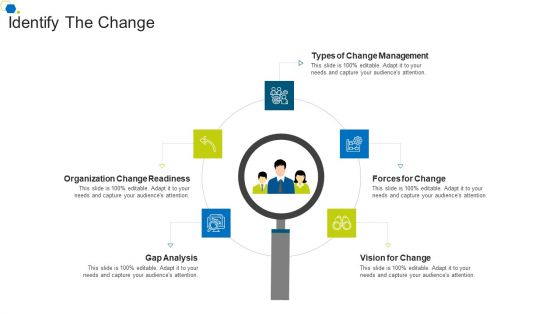
Identify The Change Corporate Transformation Strategic Outline Slides PDF
Presenting identify the change corporate transformation strategic outline slides pdf to provide visual cues and insights. Share and navigate important information on five stages that need your due attention. This template can be used to pitch topics like gap analysis, organization change readiness, types of change management, forces for change, vision for change. In addtion, this PPT design contains high resolution images, graphics, etc, that are easily editable and available for immediate download.

Before Vs After Data Integration Implementation Data Integration Strategies For Business
This slide showcases the comparative analysis of the before versus after data integration implementation. The purpose of this slide is to discuss the different performance aspects and how data management has proved beneficial for these aspects. Get a simple yet stunning designed Before Vs After Data Integration Implementation Data Integration Strategies For Business. It is the best one to establish the tone in your meetings. It is an excellent way to make your presentations highly effective. So, download this PPT today from Slidegeeks and see the positive impacts. Our easy-to-edit Before Vs After Data Integration Implementation Data Integration Strategies For Business can be your go-to option for all upcoming conferences and meetings. So, what are you waiting for Grab this template today. This slide showcases the comparative analysis of the before versus after data integration implementation. The purpose of this slide is to discuss the different performance aspects and how data management has proved beneficial for these aspects.
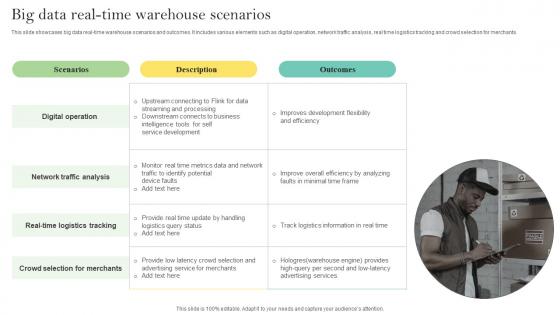
Big Data Real Time Warehouse Scenarios Ppt Slides Background Designs Pdf
This slide showcases big data real-time warehouse scenarios and outcomes. It includes various elements such as digital operation, network traffic analysis, real time logistics tracking and crowd selection for merchants. Pitch your topic with ease and precision using this Big Data Real Time Warehouse Scenarios Ppt Slides Background Designs Pdf. This layout presents information on Digital Operation, Network Traffic Analysis, Real Time Logistics. It is also available for immediate download and adjustment. So, changes can be made in the color, design, graphics or any other component to create a unique layout. This slide showcases big data real-time warehouse scenarios and outcomes. It includes various elements such as digital operation, network traffic analysis, real time logistics tracking and crowd selection for merchants.
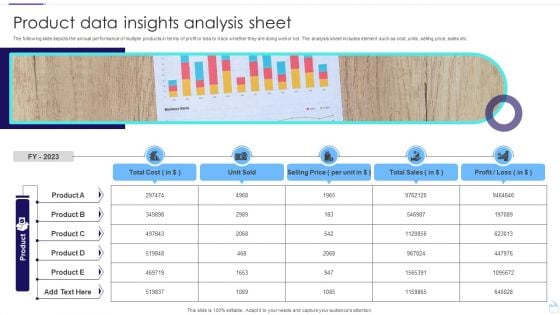
Product Data Insights Analysis Sheet Infographics PDF
The following slide depicts the annual performance of multiple products in terms of profit or loss to track whether they are doing well or not. The analysis sheet includes element such as cost, units, selling price, sales etc. Pitch your topic with ease and precision using this Product Data Insights Analysis Sheet Infographics PDF. This layout presents information on Unit Sold, Selling Price, Total Sales. It is also available for immediate download and adjustment. So, changes can be made in the color, design, graphics or any other component to create a unique layout.
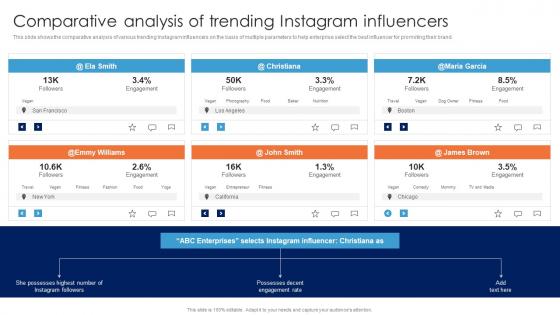
Comparative Analysis Of Trending Instagram Guide For Data Driven Advertising Themes Pdf
This slide shows the comparative analysis of various trending Instagram influencers on the basis of multiple parameters to help enterprise select the best influencer for promoting their brand.This modern and well-arranged Comparative Analysis Of Trending Instagram Guide For Data Driven Advertising Themes Pdf provides lots of creative possibilities. It is very simple to customize and edit with the Powerpoint Software. Just drag and drop your pictures into the shapes. All facets of this template can be edited with Powerpoint no extra software is necessary. Add your own material, put your images in the places assigned for them, adjust the colors, and then you can show your slides to the world, with an animated slide included. This slide shows the comparative analysis of various trending Instagram influencers on the basis of multiple parameters to help enterprise select the best influencer for promoting their brand.
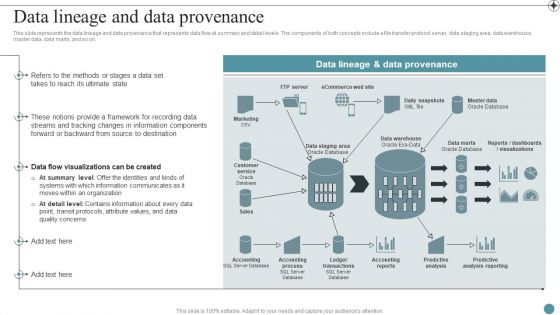
Data Lineage And Data Provenance Deploying Data Lineage IT Demonstration PDF
This slide represents the data lineage and data provenance that represents data flow at summary and detail levels. The components of both concepts include a file transfer protocol server, data staging area, data warehouse, master data, data marts, and so on.Do you have to make sure that everyone on your team knows about any specific topic I yes, then you should give Data Lineage And Data Provenance Deploying Data Lineage IT Demonstration PDF a try. Our experts have put a lot of knowledge and effort into creating this impeccable Data Lineage And Data Provenance Deploying Data Lineage IT Demonstration PDF. You can use this template for your upcoming presentations, as the slides are perfect to represent even the tiniest detail. You can download these templates from the Slidegeeks website and these are easy to edit. So grab these today.
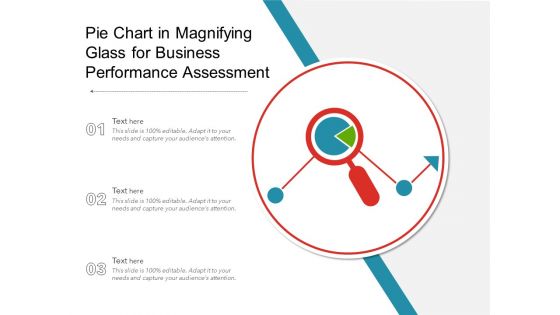
Pie Chart In Magnifying Glass For Business Performance Assessment Ppt PowerPoint Presentation Gallery Infographics PDF
Presenting this set of slides with name pie chart in magnifying glass for business performance assessment ppt powerpoint presentation gallery infographics pdf. This is a three stage process. The stages in this process are pie chart in magnifying glass for business performance assessment. This is a completely editable PowerPoint presentation and is available for immediate download. Download now and impress your audience.
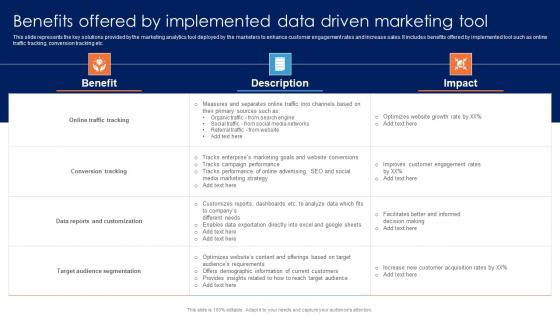
Benefits Offered By Implemented Data Guide For Data Driven Advertising Infographics Pdf
This slide represents the key solutions provided by the marketing analytics tool deployed by the marketers to enhance customer engagement rates and increase sales. It includes benefits offered by implemented tool such as online traffic tracking, conversion tracking etc.Crafting an eye-catching presentation has never been more straightforward. Let your presentation shine with this tasteful yet straightforward Benefits Offered By Implemented Data Guide For Data Driven Advertising Infographics Pdf template. It offers a minimalistic and classy look that is great for making a statement. The colors have been employed intelligently to add a bit of playfulness while still remaining professional. Construct the ideal Benefits Offered By Implemented Data Guide For Data Driven Advertising Infographics Pdf that effortlessly grabs the attention of your audience. Begin now and be certain to wow your customers. This slide represents the key solutions provided by the marketing analytics tool deployed by the marketers to enhance customer engagement rates and increase sales. It includes benefits offered by implemented tool such as online traffic tracking, conversion tracking etc.
Environmental Scanning Icon For Data Analysis Graphics PDF
Persuade your audience using this Environmental Scanning Icon For Data Analysis Graphics PDF. This PPT design covers four stages, thus making it a great tool to use. It also caters to a variety of topics including Environmental Scanning Icon For Data Analysis. Download this PPT design now to present a convincing pitch that not only emphasizes the topic but also showcases your presentation skills.
Data Analysis And Capture Structure Icon Professional PDF
Presenting Data Analysis And Capture Structure Icon Professional PDF to dispense important information. This template comprises three stages. It also presents valuable insights into the topics including Data Analysis, Capture Structure Icon. This is a completely customizable PowerPoint theme that can be put to use immediately. So, download it and address the topic impactfully.

Big Data Analytics Ppt PowerPoint Presentation Complete With Slides
Induce strategic thinking by presenting this complete deck. Enthrall your audience by deploying this thought provoking PPT deck. It can be downloaded in both standard and widescreen aspect ratios, thus making it a complete package to use and deploy. Convey your thoughts and actions using the sixty five slides presented in this complete deck. Additionally, feel free to alter its components like color, graphics, design, etc, to create a great first impression. Grab it now by clicking on the download button below.
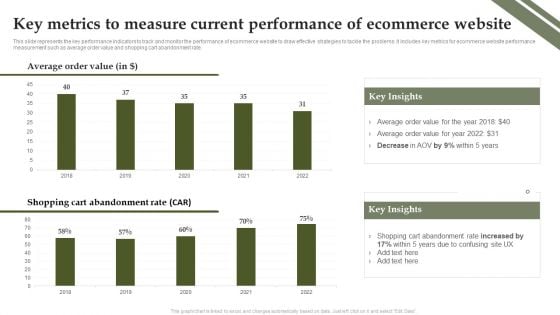
Analyzing And Deploying Effective CMS Key Metrics To Measure Current Performance Of Ecommerce Website Infographics PDF
This slide represents the key performance indicators to track and monitor the performance of ecommerce website to draw effective strategies to tackle the problems. It includes key metrics for ecommerce website performance measurement such as average order value and shopping cart abandonment rate. Do you know about Slidesgeeks Analyzing And Deploying Effective CMS Key Metrics To Measure Current Performance Of Ecommerce Website Infographics PDF These are perfect for delivering any kind od presentation. Using it, create PowerPoint presentations that communicate your ideas and engage audiences. Save time and effort by using our pre designed presentation templates that are perfect for a wide range of topic. Our vast selection of designs covers a range of styles, from creative to business, and are all highly customizable and easy to edit. Download as a PowerPoint template or use them as Google Slides themes.
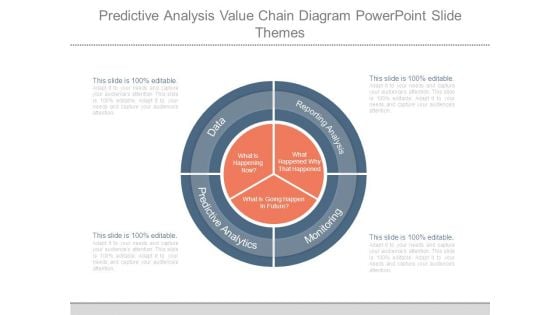
Predictive Analysis Value Chain Diagram Powerpoint Slide Themes
This is a predictive analysis value chain diagram powerpoint slide themes. This is a four stage process. The stages in this process are what is happening now, what is going happen in future, what happened why that happened, data, predictive analytics, reporting analysis, monitoring.
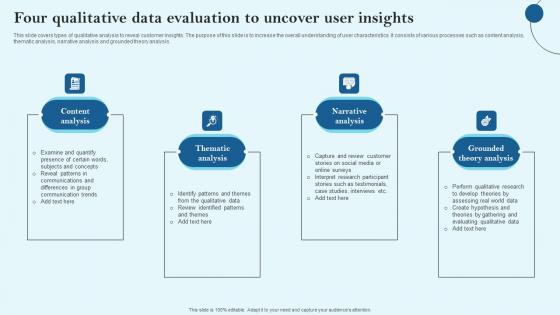
Four Qualitative Data Evaluation To Uncover User Insights Infographics Pdf
This slide covers types of qualitative analysis to reveal customer insights. The purpose of this slide is to increase the overall understanding of user characteristics. It consists of various processes such as content analysis, thematic analysis, narrative analysis and grounded theory analysis. Pitch your topic with ease and precision using this Four Qualitative Data Evaluation To Uncover User Insights Infographics Pdf This layout presents information on Content Analysis, Thematic Analysis, Narrative Analysis It is also available for immediate download and adjustment. So, changes can be made in the color, design, graphics or any other component to create a unique layout. This slide covers types of qualitative analysis to reveal customer insights. The purpose of this slide is to increase the overall understanding of user characteristics. It consists of various processes such as content analysis, thematic analysis, narrative analysis and grounded theory analysis.
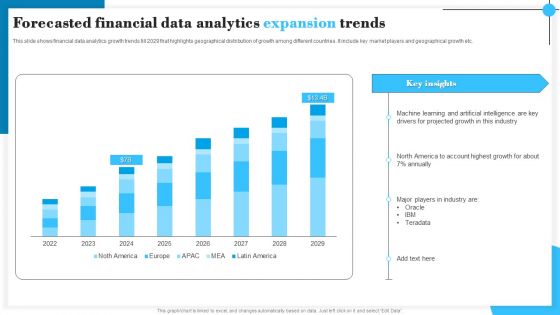
Forecasted Financial Data Analytics Expansion Trends Slides PDF
This slide shows financial data analytics growth trends till 2029 that highlights geographical distribution of growth among different countries. It include key market players and geographical growth etc. Showcasing this set of slides titled Forecasted Financial Data Analytics Expansion Trends Slides PDF. The topics addressed in these templates are Machine Learning, Projected Growth, Industry. All the content presented in this PPT design is completely editable. Download it and make adjustments in color, background, font etc. as per your unique business setting.
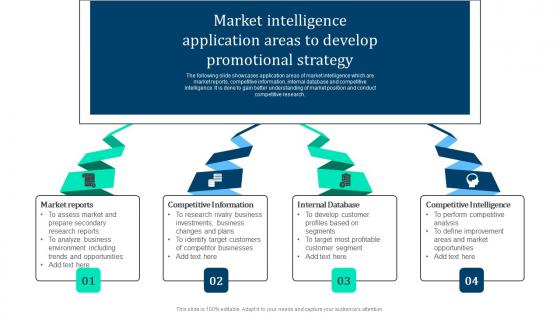
Market Intelligence Application Marketing Intelligence Guide Data Gathering Inspiration Pdf
The following slide showcases application areas of market intelligence which are market reports, competitive information, internal database and competitive intelligence. It is done to gain better understanding of market position and conduct competitive research. Explore a selection of the finest Market Intelligence Application Marketing Intelligence Guide Data Gathering Inspiration Pdf here. With a plethora of professionally designed and pre made slide templates, you can quickly and easily find the right one for your upcoming presentation. You can use our Market Intelligence Application Marketing Intelligence Guide Data Gathering Inspiration Pdf to effectively convey your message to a wider audience. Slidegeeks has done a lot of research before preparing these presentation templates. The content can be personalized and the slides are highly editable. Grab templates today from Slidegeeks. The following slide showcases application areas of market intelligence which are market reports, competitive information, internal database and competitive intelligence. It is done to gain better understanding of market position and conduct competitive research.

Before And After Data Management Technology Implementation PPT Presentation SS
The slide showcases before and after implementation comparative analysis of various aspects with data management solution. It includes aspects like syncing, data duplication and queries, underutilization of data and incorrect data. Slidegeeks is one of the best resources for PowerPoint templates. You can download easily and regulate Before And After Data Management Technology Implementation PPT Presentation SS for your personal presentations from our wonderful collection. A few clicks is all it takes to discover and get the most relevant and appropriate templates. Use our Templates to add a unique zing and appeal to your presentation and meetings. All the slides are easy to edit and you can use them even for advertisement purposes. The slide showcases before and after implementation comparative analysis of various aspects with data management solution. It includes aspects like syncing, data duplication and queries, underutilization of data and incorrect data.

Shaping The Future With AI Pdf Word Document
This Shaping The Future With AI Pdf Word Document is designed to help you retain your audiences attention. This content-ready PowerPoint Template enables you to take your audience on a journey and share information in a way that is easier to recall. It helps you highlight the crucial parts of your work so that the audience does not get saddled with information download. This seventy three slide PPT Deck comes prepared with the graphs and charts you could need to showcase your information through visuals. You only need to enter your own data in them. Download this editable PowerPoint Theme and walk into that meeting with confidence. Our Shaping The Future With AI Pdf Word Document are topically designed to provide an attractive backdrop to any subject. Use them to look like a presentation pro.

Medical Equipments Industry Outlook Pdf Word Document
This Medical Equipments Industry Outlook Pdf Word Document is designed to help you retain your audiences attention. This content-ready PowerPoint Template enables you to take your audience on a journey and share information in a way that is easier to recall. It helps you highlight the crucial parts of your work so that the audience does not get saddled with information download. This eighty seven slide PPT Deck comes prepared with the graphs and charts you could need to showcase your information through visuals. You only need to enter your own data in them. Download this editable PowerPoint Theme and walk into that meeting with confidence. Our Medical Equipments Industry Outlook Pdf Word Document are topically designed to provide an attractive backdrop to any subject. Use them to look like a presentation pro.
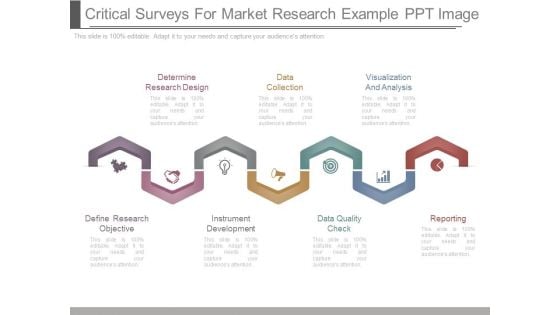
Critical Surveys For Market Research Example Ppt Image
This is a critical surveys for market research example ppt image. This is a seven stage process. The stages in this process are determine research design, data collection, visualization and analysis, define research objective, instrument development, data quality check, reporting.
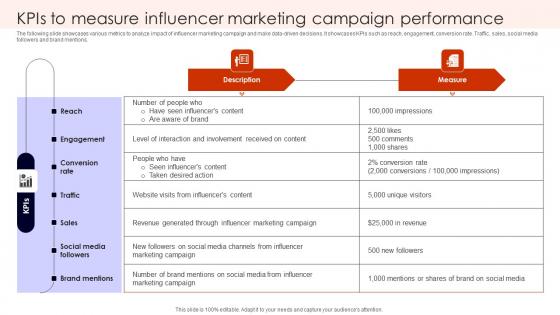
KPIs To Measure Influencer Building Spa Business Brand Presence Marketing Demonstration Pdf
The following slide showcases various metrics to analyze impact of influencer marketing campaign and make data driven decisions. It showcases KPIs such as reach, engagement, conversion rate. Traffic, sales, social media followers and brand mentions. This modern and well arranged KPIs To Measure Influencer Building Spa Business Brand Presence Marketing Demonstration Pdf provides lots of creative possibilities. It is very simple to customize and edit with the Powerpoint Software. Just drag and drop your pictures into the shapes. All facets of this template can be edited with Powerpoint, no extra software is necessary. Add your own material, put your images in the places assigned for them, adjust the colors, and then you can show your slides to the world, with an animated slide included. The following slide showcases various metrics to analyze impact of influencer marketing campaign and make data driven decisions. It showcases KPIs such as reach, engagement, conversion rate. Traffic, sales, social media followers and brand mentions.
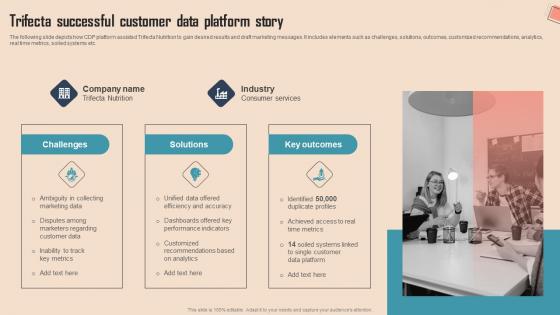
Trifecta Successful Customer Data Platform Comprehensive CDP Guide For Promoters Background Pdf
The following slide depicts how CDP platform assisted Trifecta Nutrition to gain desired results and draft marketing messages. It includes elements such as challenges, solutions, outcomes, customized recommendations, analytics, real time metrics, soiled systems etc.Do you know about Slidesgeeks Trifecta Successful Customer Data Platform Comprehensive CDP Guide For Promoters Background Pdf These are perfect for delivering any kind od presentation. Using it, create PowerPoint presentations that communicate your ideas and engage audiences. Save time and effort by using our pre-designed presentation templates that are perfect for a wide range of topic. Our vast selection of designs covers a range of styles, from creative to business, and are all highly customizable and easy to edit. Download as a PowerPoint template or use them as Google Slides themes. The following slide depicts how CDP platform assisted Trifecta Nutrition to gain desired results and draft marketing messages. It includes elements such as challenges, solutions, outcomes, customized recommendations, analytics, real time metrics, soiled systems etc.
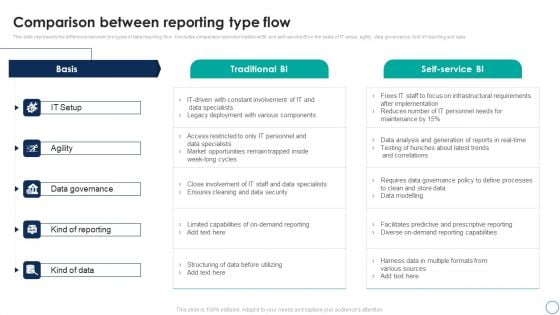
Business Analytics Application Comparison Between Reporting Type Flow Ideas PDF
This slide represents the difference between the types of data reporting flow. It includes comparison between traditional BI and self-service BI on the basis of IT setup, agility, data governance, kind of reporting and data. Are you in need of a template that can accommodate all of your creative concepts This one is crafted professionally and can be altered to fit any style. Use it with Google Slides or PowerPoint. Include striking photographs, symbols, depictions, and other visuals. Fill, move around, or remove text boxes as desired. Test out color palettes and font mixtures. Edit and save your work, or work with colleagues. Download Business Analytics Application Comparison Between Reporting Type Flow Ideas PDF and observe how to make your presentation outstanding. Give an impeccable presentation to your group and make your presentation unforgettable.
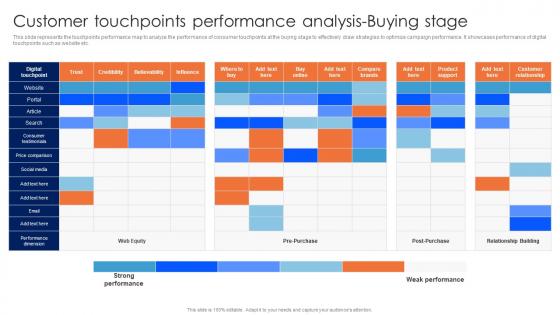
Customer Touchpoints Performance Analysis Guide For Data Driven Advertising Formats Pdf
This slide represents the touchpoints performance map to analyze the performance of consumer touchpoints at the buying stage to effectively draw strategies to optimize campaign performance. It showcases performance of digital touchpoints such as website etc.Welcome to our selection of the Customer Touchpoints Performance Analysis Guide For Data Driven Advertising Formats Pdf. These are designed to help you showcase your creativity and bring your sphere to life. Planning and Innovation are essential for any business that is just starting out. This collection contains the designs that you need for your everyday presentations. All of our PowerPoints are 100Precent editable, so you can customize them to suit your needs. This multi-purpose template can be used in various situations. Grab these presentation templates today. This slide represents the touchpoints performance map to analyze the performance of consumer touchpoints at the buying stage to effectively draw strategies to optimize campaign performance. It showcases performance of digital touchpoints such as website etc.
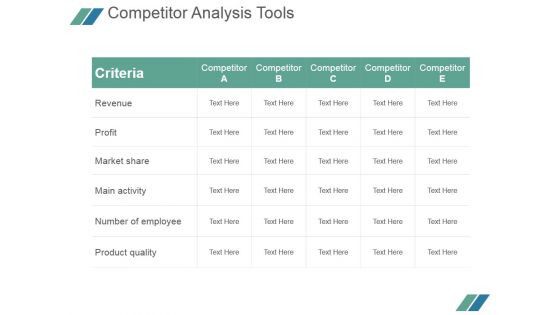
Competitor Analysis Tools Ppt PowerPoint Presentation Example File
This is a competitor analysis tools ppt powerpoint presentation example file. This is a five stage process. The stages in this process are criteria, revenue, profit, market share, main activity, number of employee, product quality.
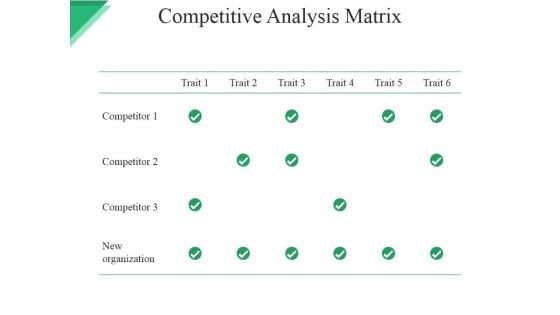
Competitive Analysis Matrix Ppt PowerPoint Presentation Model Deck
This is a competitive analysis matrix ppt powerpoint presentation model deck. This is a six stage process. The stages in this process are new organization, table, business, marketing, strategy.
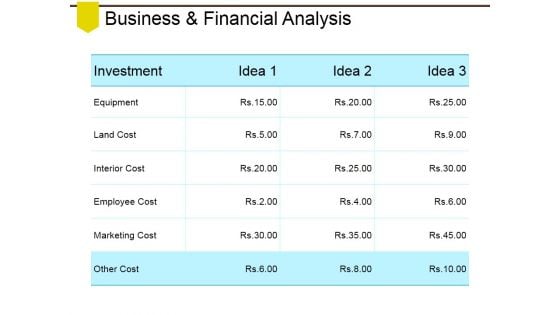
Business And Financial Analysis Ppt PowerPoint Presentation Layouts Portrait
This is a business and financial analysis ppt powerpoint presentation layouts portrait. This is a three stage process. The stages in this process are equipment, land cost, interior cost, employee cost, marketing cost.
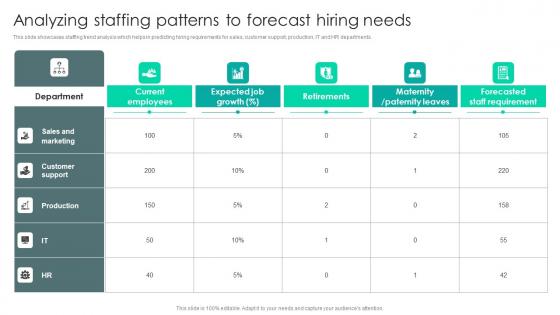
Strategic Staffing Using Data Analyzing Staffing Patterns To Forecast Hiring Needs CRP DK SS V
This slide showcases staffing trend analysis which helps in predicting hiring requirements for sales, customer support, production, IT and HR departments. From laying roadmaps to briefing everything in detail, our templates are perfect for you. You can set the stage with your presentation slides. All you have to do is download these easy-to-edit and customizable templates. Strategic Staffing Using Data Analyzing Staffing Patterns To Forecast Hiring Needs CRP DK SS V will help you deliver an outstanding performance that everyone would remember and praise you for. Do download this presentation today. This slide showcases staffing trend analysis which helps in predicting hiring requirements for sales, customer support, production, IT and HR departments.
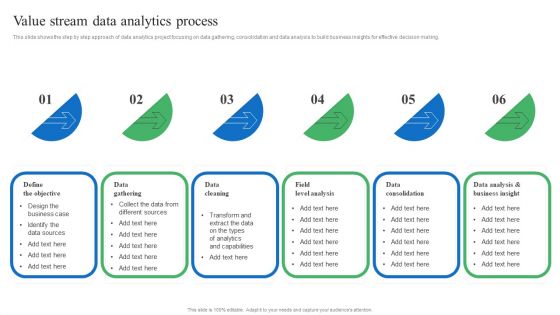
Toolkit For Data Science And Analytics Transition Value Stream Data Analytics Process Background PDF
This slide shows the step by step approach of data analytics project focusing on data gathering, consolidation and data analysis to build business insights for effective decision making. Find highly impressive Toolkit For Data Science And Analytics Transition Value Stream Data Analytics Process Background PDF on Slidegeeks to deliver a meaningful presentation. You can save an ample amount of time using these presentation templates. No need to worry to prepare everything from scratch because Slidegeeks experts have already done a huge research and work for you. You need to download Toolkit For Data Science And Analytics Transition Value Stream Data Analytics Process Background PDF for your upcoming presentation. All the presentation templates are 100 percent editable and you can change the color and personalize the content accordingly. Download now.
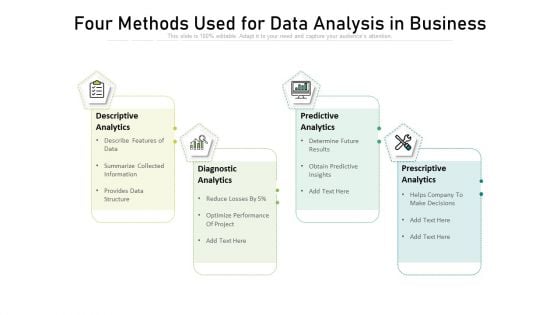
Four Methods Used For Data Analysis In Business Portrait PDF
Persuade your audience using this four methods used for data analysis in business portrait pdf.This PPT design covers four stages, thus making it a great tool to use. It also caters to a variety of topics including descriptive analytics, diagnostic analytics, predictive analytics, prescriptive analytics. Download this PPT design now to present a convincing pitch that not only emphasizes the topic but also showcases your presentation skills.
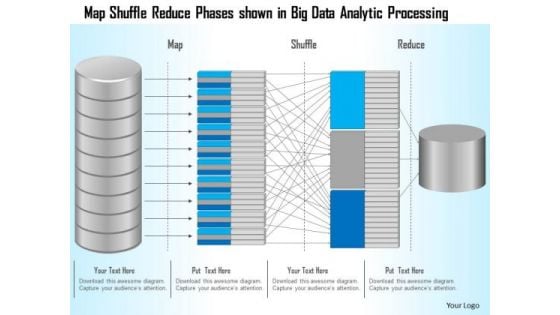
Business Diagram Map Shuffle Reduce Phases Shown In Big Data Analytic Processing Ppt Slide
This technology slide has been designed with graphic of map and data text. This diagram helps to depict concept of data analysis and processing. Use this diagram slide for computer technology related presentations.

Cloud Computing Project Analysis Diagram Powerpoint Template
Our above PPT slide contains graphics of cloud with technology icons. This PowerPoint template may be used for project related to cloud computing. Use this diagram to impart more clarity to data and to create more sound impact on viewers.
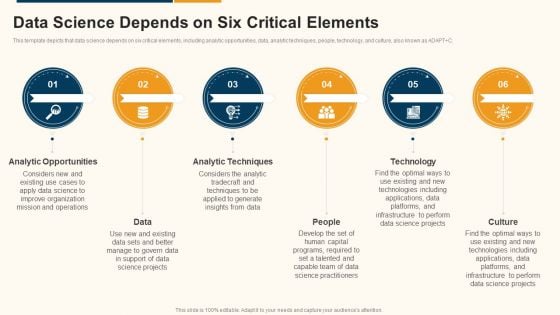
Data Interpretation And Analysis Playbook Data Science Depends On Six Critical Elements Diagrams PDF
This template depicts that data science depends on six critical elements, including analytic opportunities, data, analytic techniques, people, technology, and culture, also known as ADAPT pluse C. Presenting data interpretation and analysis playbook data science depends on six critical elements diagrams pdf to provide visual cues and insights. Share and navigate important information on six stages that need your due attention. This template can be used to pitch topics like analytic opportunities, data, analytic techniques, people, technology, culture. In addtion, this PPT design contains high resolution images, graphics, etc, that are easily editable and available for immediate download.
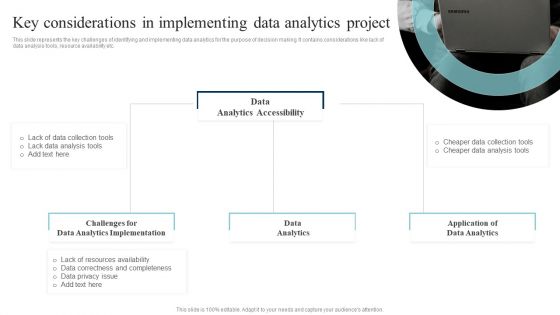
Data Evaluation And Processing Toolkit Key Considerations In Implementing Data Summary PDF
This slide represents the key challenges of identifying and implementing data analytics for the purpose of decision making. It contains considerations like lack of data analysis tools, resource availability etc. Presenting this PowerPoint presentation, titled Data Evaluation And Processing Toolkit Key Considerations In Implementing Data Summary PDF, with topics curated by our researchers after extensive research. This editable presentation is available for immediate download and provides attractive features when used. Download now and captivate your audience. Presenting this Data Evaluation And Processing Toolkit Key Considerations In Implementing Data Summary PDF. Our researchers have carefully researched and created these slides with all aspects taken into consideration. This is a completely customizable Data Evaluation And Processing Toolkit Key Considerations In Implementing Data Summary PDF that is available for immediate downloading. Download now and make an impact on your audience. Highlight the attractive features available with our PPTs.

Toolkit For Data Science And Analytics Transition Data Analytics Value Stream Chain Pictures PDF
This slide illustrates the series of activities required for analyzing the data. It contains information such as data preparation, exploratory analysis, and predictive analytics etc. If you are looking for a format to display your unique thoughts, then the professionally designed Toolkit For Data Science And Analytics Transition Data Analytics Value Stream Chain Pictures PDF is the one for you. You can use it as a Google Slides template or a PowerPoint template. Incorporate impressive visuals, symbols, images, and other charts. Modify or reorganize the text boxes as you desire. Experiment with shade schemes and font pairings. Alter, share or cooperate with other people on your work. Download Toolkit For Data Science And Analytics Transition Data Analytics Value Stream Chain Pictures PDF and find out how to give a successful presentation. Present a perfect display to your team and make your presentation unforgettable.
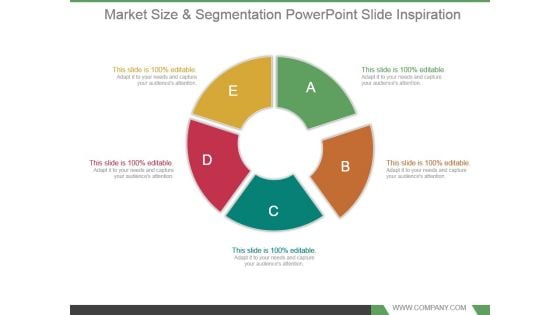
Market Size And Segmentation Powerpoint Slide Inspiration
This is a market size and segmentation powerpoint slide inspiration. This is a five stage process. The stages in this process are market, process, flow, circle, size.
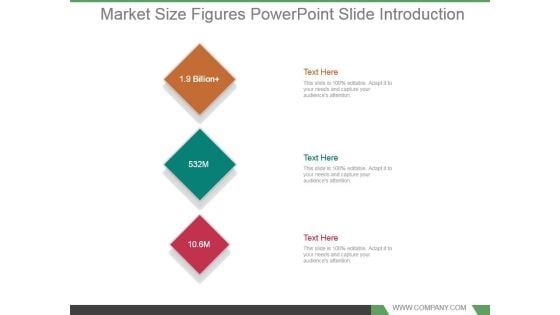
Market Size Figures Powerpoint Slide Introduction
This is a market size figures powerpoint slide introduction. This is a three stage process. The stages in this process are business, marketing, strategy, figure, size.
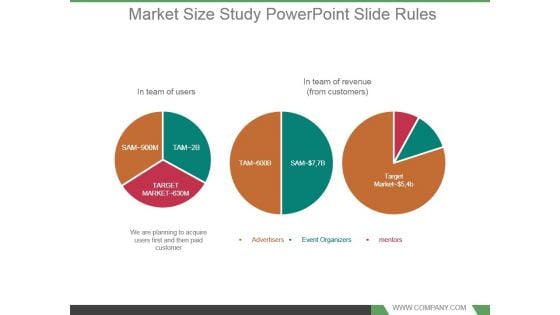
Market Size Study Powerpoint Slide Rules
This is a market size study powerpoint slide rules. This is a three stage process. The stages in this process are target market, in team of users, in team of revenue, advertisers, event organizers, mentors.
Ways Manufacturing Data Analysis Increases Productivity And Profitability Template PDF
Persuade your audience using this Ways Manufacturing Data Analysis Increases Productivity And Profitability Template PDF. This PPT design covers four stages, thus making it a great tool to use. It also caters to a variety of topics including Increases Productivity, Manufacturing Data, Profitability. Download this PPT design now to present a convincing pitch that not only emphasizes the topic but also showcases your presentation skills.
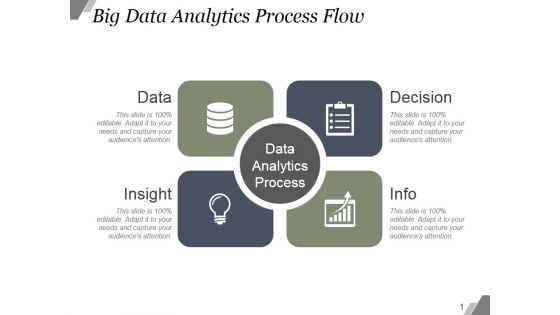
Big Data Analytics Process Flow Ppt PowerPoint Presentation Diagrams
This is a big data analytics process flow ppt powerpoint presentation diagrams. This is a four stage process. The stages in this process are data, decision, insight, info.
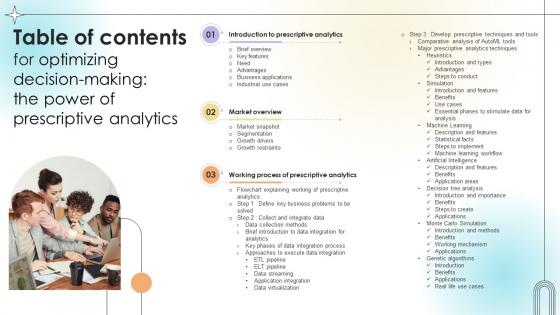
Table Of Contents For Optimizing Decision Making The Power Of Prescriptive Analytics Data Analytics SS V
Explore a selection of the finest Table Of Contents For Optimizing Decision Making The Power Of Prescriptive Analytics Data Analytics SS V here. With a plethora of professionally designed and pre-made slide templates, you can quickly and easily find the right one for your upcoming presentation. You can use our Table Of Contents For Optimizing Decision Making The Power Of Prescriptive Analytics Data Analytics SS V to effectively convey your message to a wider audience. Slidegeeks has done a lot of research before preparing these presentation templates. The content can be personalized and the slides are highly editable. Grab templates today from Slidegeeks. Our Table Of Contents For Optimizing Decision Making The Power Of Prescriptive Analytics Data Analytics SS V are topically designed to provide an attractive backdrop to any subject. Use them to look like a presentation pro.

Data Interpretation And Analysis Playbook Business Intelligence And Predictive Analytics Challenges Template PDF
This template covers the problems while implementing BI and predictive analytics in the organization. The challenges are undefined KPIs and metrics, and unable to hire right data science talent. Presenting data interpretation and analysis playbook business intelligence and predictive analytics challenges template pdf to provide visual cues and insights. Share and navigate important information on two stages that need your due attention. This template can be used to pitch topics like security vulnerabilities, operationalizing, perform analysis, deployed. In addtion, this PPT design contains high resolution images, graphics, etc, that are easily editable and available for immediate download.
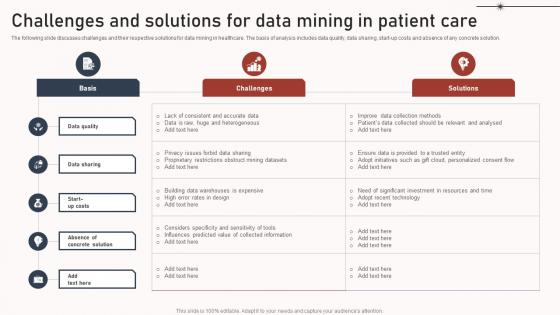
Challenges And Solutions For Data Mining In Patient Care Microsoft Pdf
The following slide discusses challenges and their respective solutions for data mining in healthcare. The basis of analysis includes data quality, data sharing, start up costs and absence of any concrete solution. Pitch your topic with ease and precision using this Challenges And Solutions For Data Mining In Patient Care Microsoft Pdf. This layout presents information on Data Quality, Data Sharing, Start Up Costs. It is also available for immediate download and adjustment. So, changes can be made in the color, design, graphics or any other component to create a unique layout. The following slide discusses challenges and their respective solutions for data mining in healthcare. The basis of analysis includes data quality, data sharing, start up costs and absence of any concrete solution.
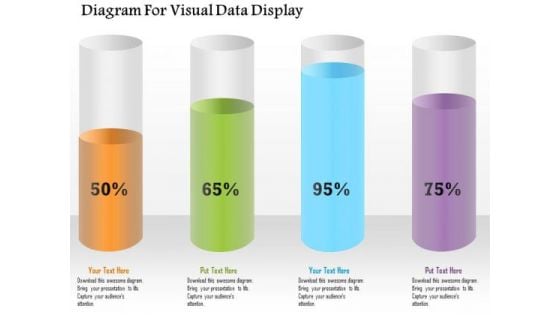
Business Diagram Diagram For Visual Data Display Presentation Template
Four colored cylindrical bars with percentage values are used to design this power point template. This diagram slide helps to display financial data analysis. Use this diagram for your business and finance related presentations.
Table Of Contents Optimizing Decision Making The Power Of Prescriptive Analytics Data Analytics SS V
The best PPT templates are a great way to save time, energy, and resources. Slidegeeks have 100 percent editable powerpoint slides making them incredibly versatile. With these quality presentation templates, you can create a captivating and memorable presentation by combining visually appealing slides and effectively communicating your message. Download Table Of Contents Optimizing Decision Making The Power Of Prescriptive Analytics Data Analytics SS V from Slidegeeks and deliver a wonderful presentation. Our Table Of Contents Optimizing Decision Making The Power Of Prescriptive Analytics Data Analytics SS V are topically designed to provide an attractive backdrop to any subject. Use them to look like a presentation pro.
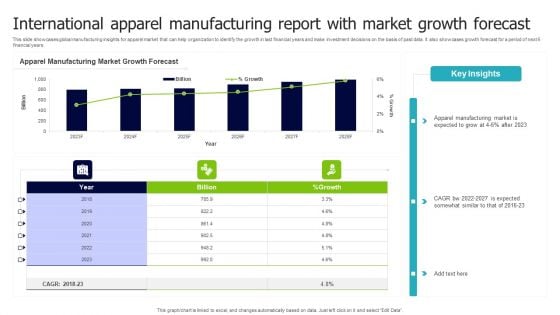
International Apparel Manufacturing Report With Market Growth Forecast Inspiration PDF
This slide showcases global manufacturing insights for apparel market that can help organization to identify the growth in last financial years and make investment decisions on the basis of past data. It also showcases growth forecast for a period of next 6 financial years. Pitch your topic with ease and precision using this International Apparel Manufacturing Report With Market Growth Forecast Inspiration PDF. This layout presents information on Apparel Manufacturing, Market Growth Forecast, Billion. It is also available for immediate download and adjustment. So, changes can be made in the color, design, graphics or any other component to create a unique layout.
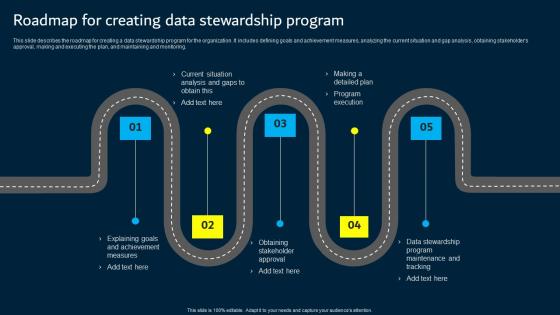
Roadmap For Creating Data Stewardship Program Data Custodianship Introduction Pdf
This slide describes the roadmap for creating a data stewardship program for the organization. It includes defining goals and achievement measures, analyzing the current situation and gap analysis, obtaining stakeholder s approval, making and executing the plan, and maintaining and monitoring. Are you searching for a Roadmap For Creating Data Stewardship Program Data Custodianship Introduction Pdf that is uncluttered, straightforward, and original Its easy to edit, and you can change the colors to suit your personal or business branding. For a presentation that expresses how much effort you have put in, this template is ideal With all of its features, including tables, diagrams, statistics, and lists, its perfect for a business plan presentation. Make your ideas more appealing with these professional slides. Download Roadmap For Creating Data Stewardship Program Data Custodianship Introduction Pdf from Slidegeeks today. This slide describes the roadmap for creating a data stewardship program for the organization. It includes defining goals and achievement measures, analyzing the current situation and gap analysis, obtaining stakeholder s approval, making and executing the plan, and maintaining and monitoring.
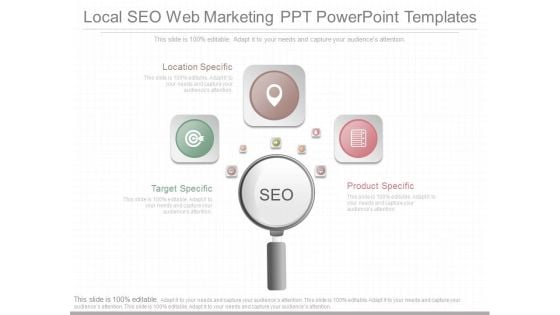
Local Seo Web Marketing Ppt Powerpoint Templates
This is a local seo web marketing ppt powerpoint templates. This is a three stage process. The stages in this process are location specific, target specific, product specific.
Product Wise Pipeline Analysis Ppt PowerPoint Presentation Professional Files
This is a our goal ppt powerpoint presentation slides files. This is a four stage process. The stages in this process are business, marketing, strategy, planning, icons.
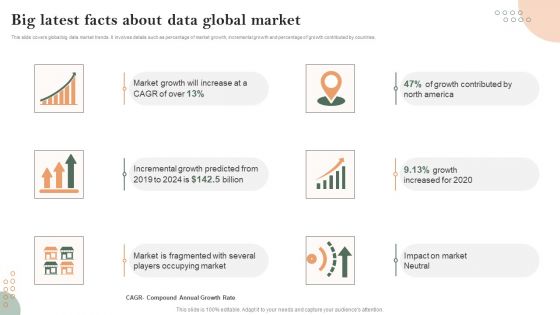
Big Latest Facts About Data Global Market Microsoft PDF
This slide covers global big data market trends. It involves details such as percentage of market growth, incremental growth and percentage of growth contributed by countries. Pitch your topic with ease and precision using this Big Latest Facts About Data Global Market Microsoft PDF. This layout presents information on Big Latest Facts, About Data Global Market. It is also available for immediate download and adjustment. So, changes can be made in the color, design, graphics or any other component to create a unique layout.
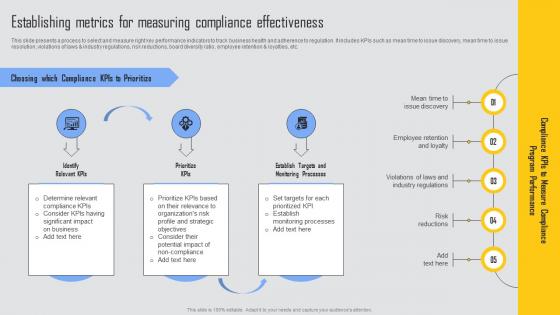
Establishing Metrics Measuring Managing Risks And Establishing Trust Through Efficient Ideas Pdf
This slide presents a process to select and measure right key performance indicators to track business health and adherence to regulation. It includes KPIs such as mean time to issue discovery, mean time to issue resolution, violations of laws and industry regulations, risk reductions, board diversity ratio, employee retention and loyalties, etc. Do you have to make sure that everyone on your team knows about any specific topic I yes, then you should give Establishing Metrics Measuring Managing Risks And Establishing Trust Through Efficient Ideas Pdf a try. Our experts have put a lot of knowledge and effort into creating this impeccable Establishing Metrics Measuring Managing Risks And Establishing Trust Through Efficient Ideas Pdf. You can use this template for your upcoming presentations, as the slides are perfect to represent even the tiniest detail. You can download these templates from the Slidegeeks website and these are easy to edit. So grab these today This slide presents a process to select and measure right key performance indicators to track business health and adherence to regulation. It includes KPIs such as mean time to issue discovery, mean time to issue resolution, violations of laws and industry regulations, risk reductions, board diversity ratio, employee retention and loyalties, etc.
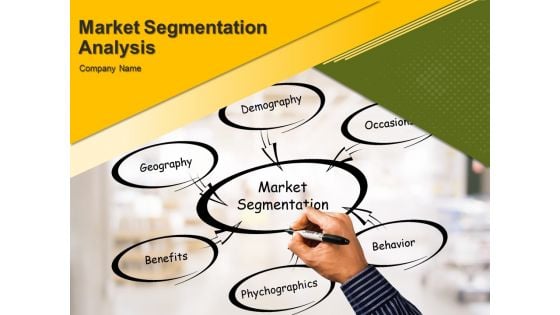
Market Segmentation Analysis Example Ppt PowerPoint Presentation Complete Deck With Slides
This is a market segmentation analysis example ppt powerpoint presentation complete deck with slides. This is a one stage process. The stages in this process are market, segmentation, business, analysis, business, management.
Job Application Status Report Ppt PowerPoint Presentation Icon Model PDF
Presenting this set of slides with name job application status report ppt powerpoint presentation icon model pdf. The topics discussed in these slides are agenda, planned data, action items. This is a completely editable PowerPoint presentation and is available for immediate download. Download now and impress your audience.


 Continue with Email

 Home
Home


