Dashboards
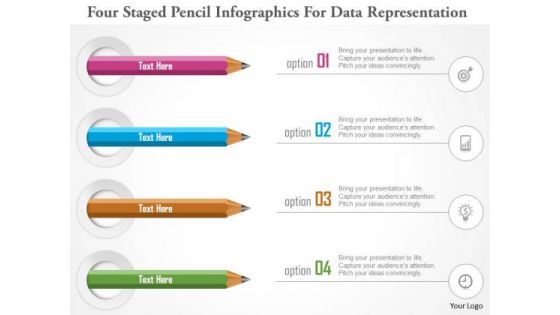
Business Diagram Four Staged Pencil Infographics For Data Representation PowerPoint Template
Four staged pencil info graphics has been used to design this power point template. This diagram template contains the concept of data representations. Use this PPT for your business and marketing presentations.
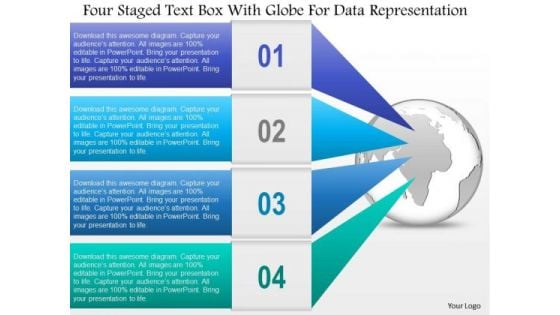
Business Diagram Four Staged Text Box With Globe For Data Representation Ppt Template
Four staged text boxes with globe has been used to craft this power point template. This PPT diagram contains the concept of global business agenda and data representation. Use this PPT for business and marketing related presentations.
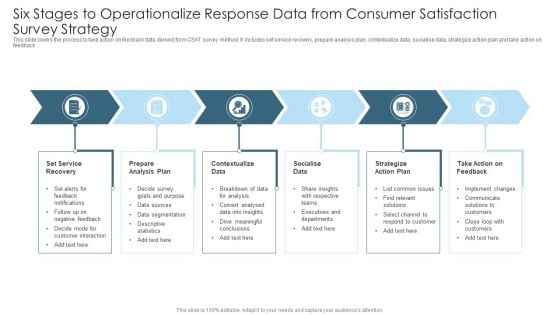
Six Stages To Operationalize Response Data From Consumer Satisfaction Survey Strategy Information PDF
This slide covers the process to take action on feedback data derived from CSAT survey method. It includes set service recovery, prepare analysis plan, contextualize data, socialise data, strategize action plan and take action on feedback. Presenting Six Stages To Operationalize Response Data From Consumer Satisfaction Survey Strategy Information PDF to dispense important information. This template comprises six stages. It also presents valuable insights into the topics including Prepare Analysis Plan, Set Service Recovery, Contextualize Data. This is a completely customizable PowerPoint theme that can be put to use immediately. So, download it and address the topic impactfully.
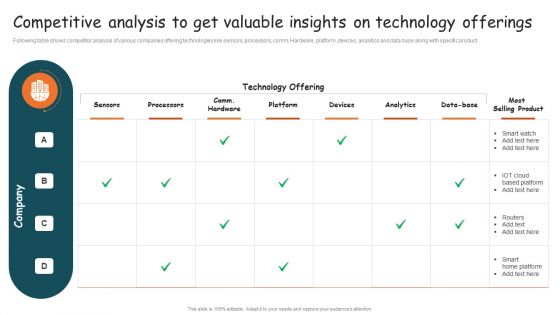
Guide For Brand Competitive Analysis To Get Valuable Insights On Technology Download PDF
Following table shows competitor analysis of various companies offering technologies like sensors, processors, comm. Hardware, platform, devices, analytics and data base along with specific product. Presenting this PowerPoint presentation, titled Guide For Brand Competitive Analysis To Get Valuable Insights On Technology Download PDF, with topics curated by our researchers after extensive research. This editable presentation is available for immediate download and provides attractive features when used. Download now and captivate your audience. Presenting this Guide For Brand Competitive Analysis To Get Valuable Insights On Technology Download PDF. Our researchers have carefully researched and created these slides with all aspects taken into consideration. This is a completely customizableGuide For Brand Competitive Analysis To Get Valuable Insights On Technology Download PDF that is available for immediate downloading. Download now and make an impact on your audience. Highlight the attractive features available with our PPTs.
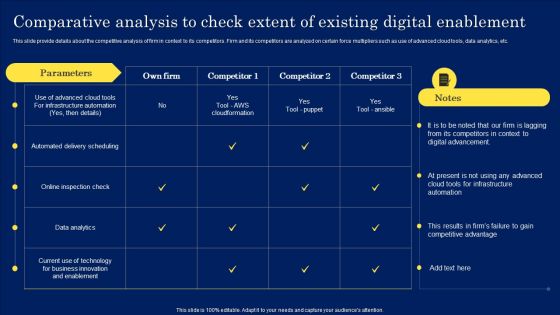
Comparative Analysis To Check Extent Of Existing Digital Enablement Guidelines PDF
This slide provide details about the competitive analysis of firm in context to its competitors. Firm and its competitors are analyzed on certain force multipliers such as use of advanced cloud tools, data analytics, etc. Presenting this PowerPoint presentation, titled Comparative Analysis To Check Extent Of Existing Digital Enablement Guidelines PDF, with topics curated by our researchers after extensive research. This editable presentation is available for immediate download and provides attractive features when used. Download now and captivate your audience. Presenting this Comparative Analysis To Check Extent Of Existing Digital Enablement Guidelines PDF. Our researchers have carefully researched and created these slides with all aspects taken into consideration. This is a completely customizable Comparative Analysis To Check Extent Of Existing Digital Enablement Guidelines PDF that is available for immediate downloading. Download now and make an impact on your audience. Highlight the attractive features available with our PPTs.
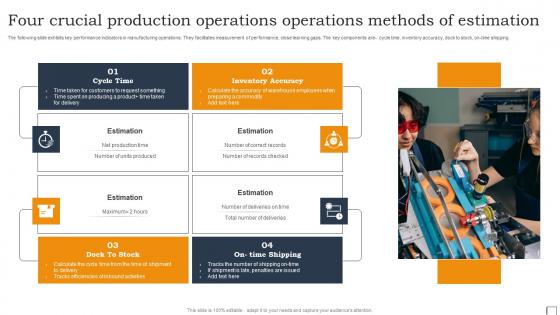
Four Crucial Production Operations Operations Methods Of Estimation Infographics Pdf
The following slide exhibits key performance indicators in manufacturing operations. They facilitates measurement of performance, close learning gaps. The key components are- cycle time, inventory accuracy, dock to stock, on-time shipping. Showcasing this set of slides titled Four Crucial Production Operations Operations Methods Of Estimation Infographics Pdf. The topics addressed in these templates are Cycle Time, Inventory Accuracy. All the content presented in this PPT design is completely editable. Download it and make adjustments in color, background, font etc. as per your unique business setting. The following slide exhibits key performance indicators in manufacturing operations. They facilitates measurement of performance, close learning gaps. The key components are- cycle time, inventory accuracy, dock to stock, on-time shipping.
Business Marketing Strategic Reporting Icon Graphics PDF
Persuade your audience using this Business Marketing Strategic Reporting Icon Graphics PDF. This PPT design covers three stages, thus making it a great tool to use. It also caters to a variety of topics Business Marketing, Strategic, Reporting. Download this PPT design now to present a convincing pitch that not only emphasizes the topic but also showcases your presentation skills.
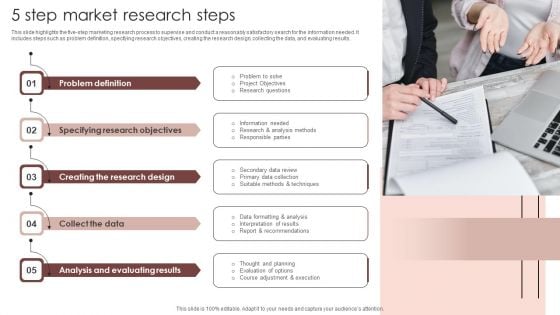
5 Step Market Research Steps Download PDF
This slide highlights the five-step marketing research process to supervise and conduct a reasonably satisfactory search for the information needed. It includes steps such as problem definition, specifying research objectives, creating the research design, collecting the data, and evaluating results. Showcasing this set of slides titled 5 Step Market Research Steps Download PDF. The topics addressed in these templates are Problem Definition, Data, Design. All the content presented in this PPT design is completely editable. Download it and make adjustments in color, background, font etc. as per your unique business setting.
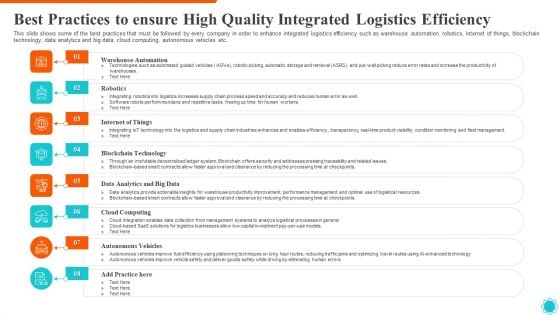
Best Practices To Ensure High Quality Integrated Logistics Efficiency Download PDF
This slide shows some of the best practices that must be followed by every company in order to enhance integrated logistics efficiency such as warehouse automation, robotics, internet of things, blockchain technology, data analytics and big data, cloud computing, autonomous vehicles etc. This is a best practices to ensure high quality integrated logistics efficiency download pdf template with various stages. Focus and dispense information on eight stages using this creative set, that comes with editable features. It contains large content boxes to add your information on topics like warehouse automation, robotics, internet of things, blockchain technology, data analytics and big data. You can also showcase facts, figures, and other relevant content using this PPT layout. Grab it now.
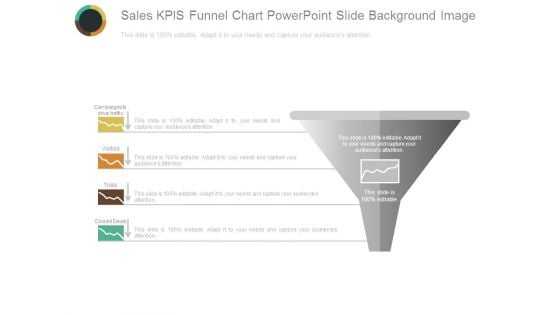
Sales Kpis Funnel Chart Powerpoint Slide Background Image
This is a sales kpis funnel chart powerpoint slide background image. This is a one stage process. The stages in this process are campaigns to drive traffic, visitors, trials, closed deals, sales.
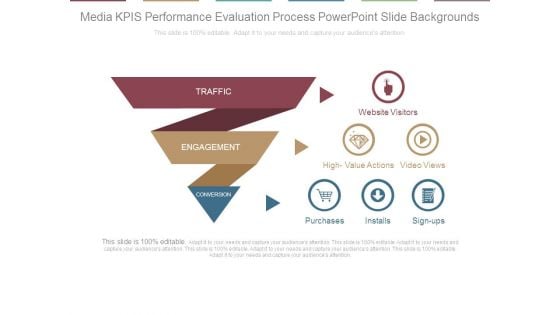
Media Kpis Performance Evaluation Process Powerpoint Slide Backgrounds
This is a media kpis performance evaluation process powerpoint slide backgrounds. This is a three stage process. The stages in this process are traffic, engagement, conversion, purchases, installs, sign ups, video views, high value actions, website visitors.

Kpis For Media Campaigns Evaluation Ppt PowerPoint Presentation Deck
This is a kpis for media campaigns evaluation ppt powerpoint presentation deck. This is a three stage process. The stages in this process are traffic, engagement, conversion, website visitors.

Media Kpis Performance Evaluation Ppt PowerPoint Presentation Tips
This is a media kpis performance evaluation ppt powerpoint presentation tips. This is a three stage process. The stages in this process are traffic, engagement, conversion, purchases, installs, sign ups, high value actions, video views, website visitors.
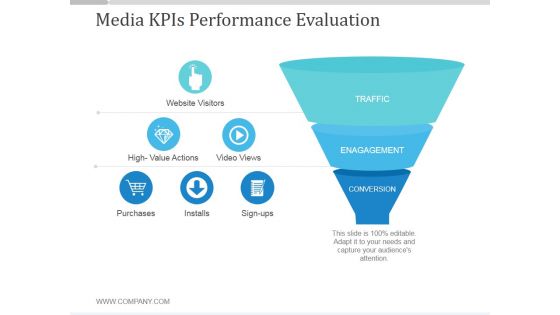
Media Kpis Performance Evaluation Ppt PowerPoint Presentation Topics
This is a media kpis performance evaluation ppt powerpoint presentation topics. This is a three stage process. The stages in this process are traffic, engagement, conversion, website, visitors, high value actions, video views, purchases, installs, sign ups.
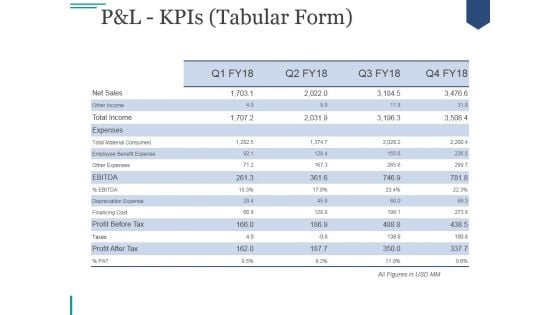
Pandl Kpis Tabular Form Ppt PowerPoint Presentation Visual Aids
This is a pandl kpis tabular form ppt powerpoint presentation visual aids. This is a four stage process. The stages in this process are revenue, cogs, operating profit, net profit.
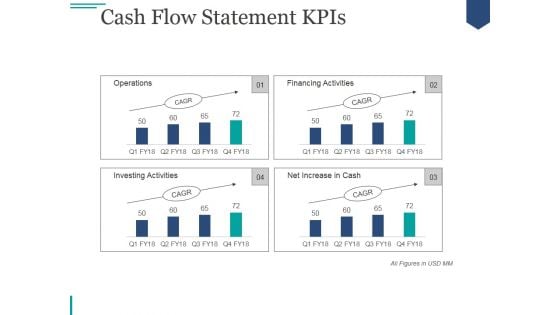
Cash Flow Statement Kpis Ppt PowerPoint Presentation Deck
This is a cash flow statement kpis ppt powerpoint presentation deck. This is a four stage process. The stages in this process are operations, financing activities, investing activities, net increase in cash.
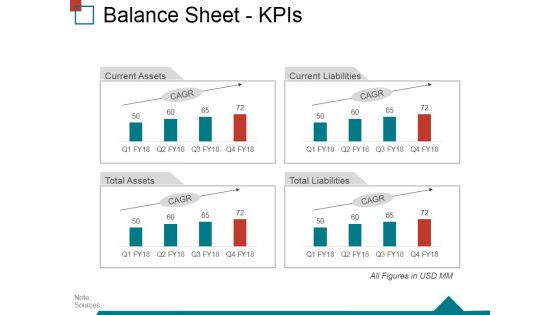
Balance Sheet Kpis Ppt PowerPoint Presentation Model Example Topics
This is a balance sheet kpis ppt powerpoint presentation model example topics. This is a four stage process. The stages in this process are shareholders equity, trade payables, other current liabilities, short term provisions, current liabilities, total liabilities.
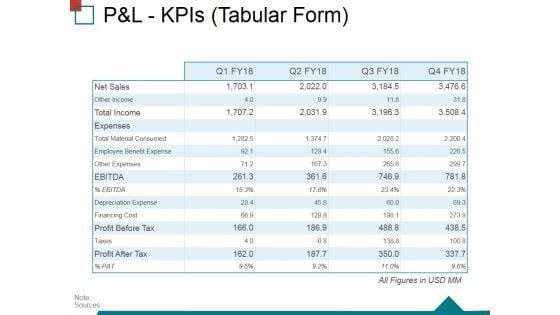
Pandl Kpis Tabular Form Ppt PowerPoint Presentation Ideas Structure
This is a pandl kpis tabular form ppt powerpoint presentation ideas structure. This is a four stage process. The stages in this process are operating profit, revenue, cogs, net profit.

Customer Service Kpis Template 1 Ppt PowerPoint Presentation Gallery Mockup
This is a customer service kpis template 1 ppt powerpoint presentation gallery mockup. This is a ten stage process. The stages in this process are brand description, employee productivity measurement, comparison with business rival.

Customer Service Kpis Template 2 Ppt PowerPoint Presentation Show Structure
This is a customer service kpis template 2 ppt powerpoint presentation show structure. This is a four stage process. The stages in this process are tickets by week, tickets by group, tickets by time of the day, tickets by medium.
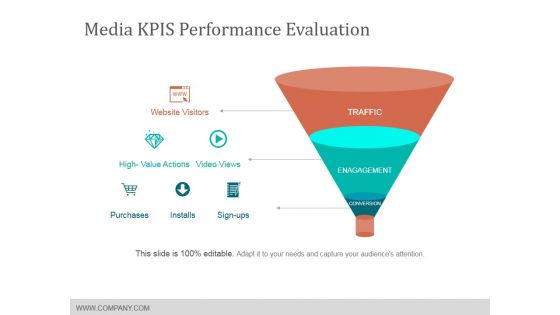
Media Kpis Performance Evaluation Ppt PowerPoint Presentation File Templates
This is a media kpis performance evaluation ppt powerpoint presentation file templates. This is a three stage process. The stages in this process are website visitors, purchases, installs, sign ups.
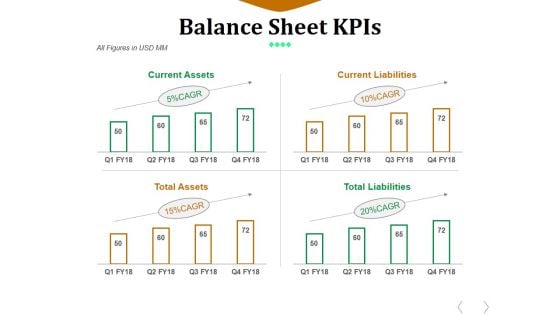
Balance Sheet Kpis Template 2 Ppt PowerPoint Presentation Ideas Graphics
This is a balance sheet kpis template 2 ppt powerpoint presentation ideas graphics. This is a four stage process. The stages in this process are current assets, current liabilities, total assets, total liabilities.
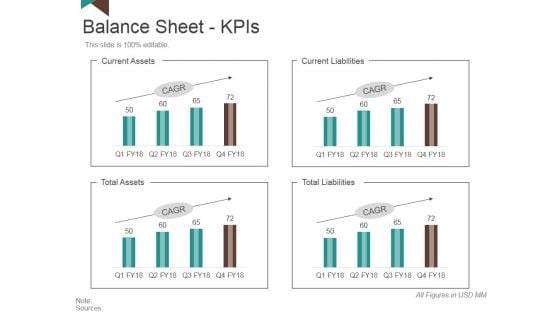
Balance Sheet Kpis Template 3 Ppt PowerPoint Presentation Slides Brochure
This is a balance sheet kpis template 3 ppt powerpoint presentation slides brochure. This is a four stage process. The stages in this process are current assets, current liabilities, total liabilities, total assets.
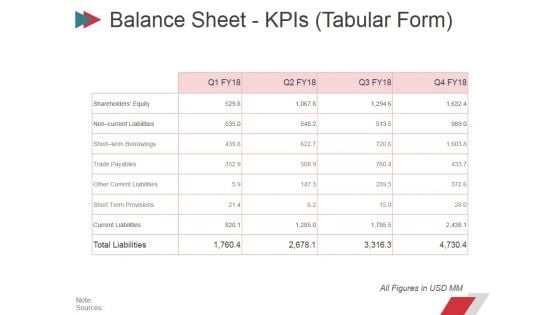
Balance Sheet Kpis Tabular Form Ppt PowerPoint Presentation Professional Display
This is a balance sheet kpis tabular form ppt powerpoint presentation professional display. This is a four stage process. The stages in this process are current assets, current liabilities, total assets, total liabilities.
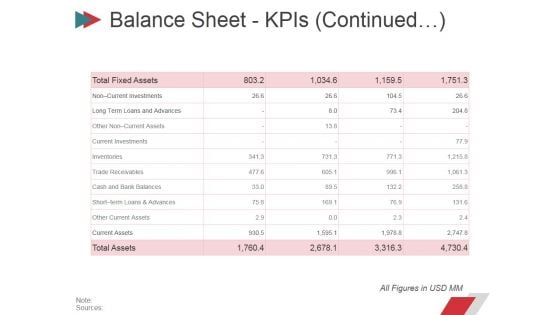
Balance Sheet Kpis Template Ppt PowerPoint Presentation Slides Inspiration
This is a balance sheet kpis template ppt powerpoint presentation slides inspiration. This is a four stage process. The stages in this process are shareholders equity, short term borrowings, trade payables, other current liabilities.
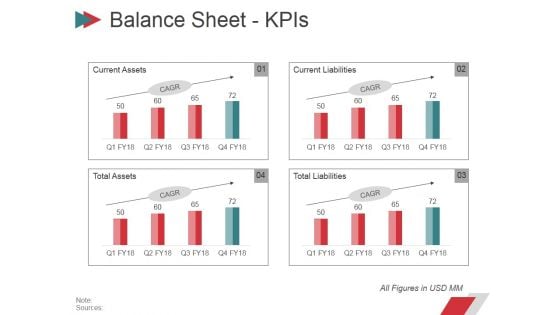
Balance Sheet Kpis Ppt PowerPoint Presentation Infographics Example File
This is a balance sheet kpis ppt powerpoint presentation infographics example file. This is a four stage process. The stages in this process are current investments, inventories, trade receivables, cash and bank balances, current assets.
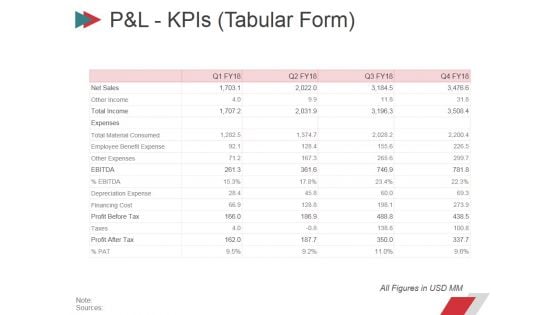
Pandl Kpis Tabular Form Ppt PowerPoint Presentation Summary Layout
This is a pandl kpis tabular form ppt powerpoint presentation summary layout. This is a four stage process. The stages in this process are revenue, cogs, operating profit, net profit.
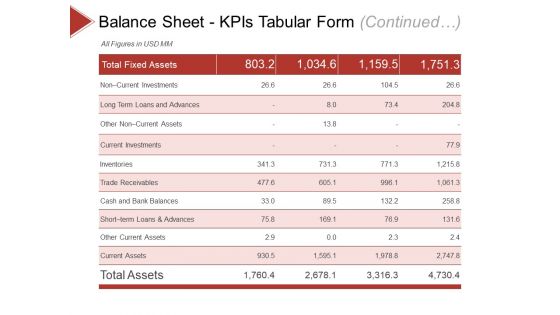
Balance Sheet Kpis Template 1 Ppt PowerPoint Presentation Diagram Ppt
This is a balance sheet kpis template 1 ppt powerpoint presentation diagram ppt. This is a four stage process. The stages in this process are non current investments, current investments, inventories, trade receivables, trade receivables.
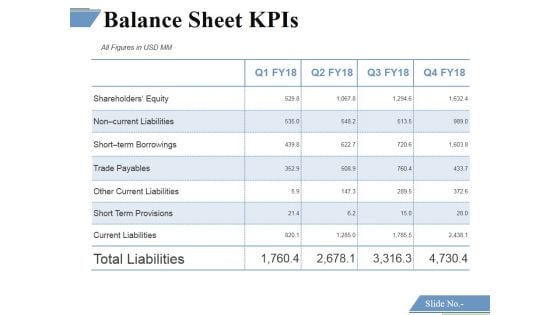
Balance Sheet Kpis Template 2 Ppt PowerPoint Presentation Portfolio Portrait
This is a balance sheet kpis template 2 ppt powerpoint presentation portfolio portrait. This is a four stage process. The stages in this process are shareholders equity, non current liabilities, short term borrowings, trade payables, other current liabilities.
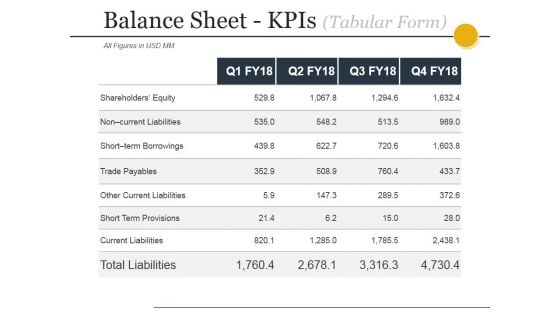
Balance Sheet Kpis Tabular Form Ppt PowerPoint Presentation Infographics Good
This is a balance sheet kpis tabular form ppt powerpoint presentation infographics good. This is a four stage process. The stages in this process are current assets, current liabilities, total assets, total liabilities.
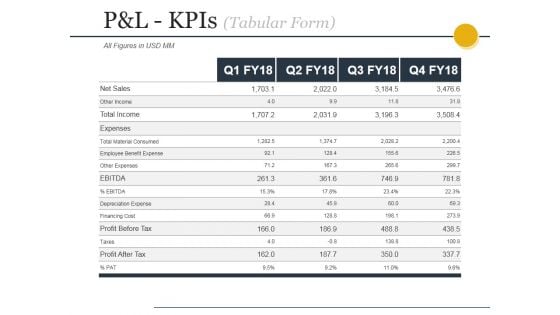
Pandl Kpis Tabular Form Ppt PowerPoint Presentation File Design Templates
This is a pandl kpis tabular form ppt powerpoint presentation file design templates. This is a four stage process. The stages in this process are revenue, cogs, operating profit, net profit.
Pandl Kpis Tabular Form Ppt PowerPoint Presentation Gallery Icon
This is a pandl kpis tabular form ppt powerpoint presentation gallery icon. This is a four stage process. The stages in this process are revenue, cogs, operating profit, net profit.

P And L Kpis Ppt PowerPoint Presentation Portfolio Slide
This is a p and l kpis ppt powerpoint presentation portfolio slide. This is a four stage process. The stages in this process are ebitda, profit before tax, profit after tax, expenses, net sales.
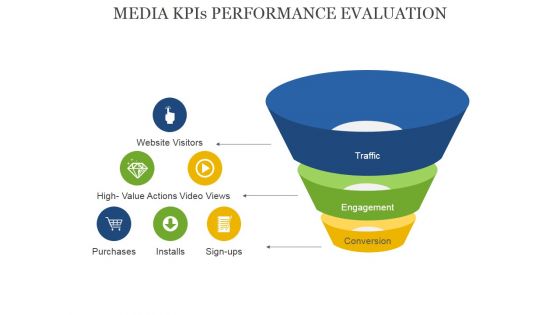
Media Kpis Performance Evaluation Ppt PowerPoint Presentation Professional Demonstration
This is a media kpis performance evaluation ppt powerpoint presentation professional demonstration. This is a three stage process. The stages in this process are website visitors, high value actions, purchases, installs, sign ups, conversion.
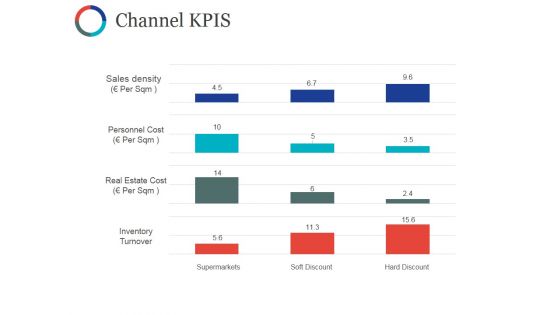
Channel Kpis Template Ppt PowerPoint Presentation Show Portfolio
This is a channel kpis template ppt powerpoint presentation show portfolio. This is a four stage process. The stages in this process are sales density, personnel cost, real estate cost, inventory turnover.
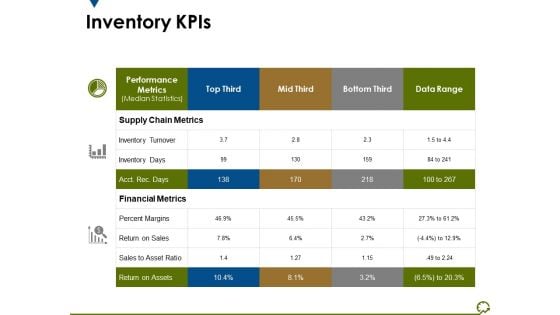
Inventory Kpis Ppt PowerPoint Presentation Infographic Template Display
This is a inventory kpis ppt powerpoint presentation infographic template display. This is a three stage process. The stages in this process are supply chain metrics, financial metrics, percent margins, return on assets, inventory turnover.
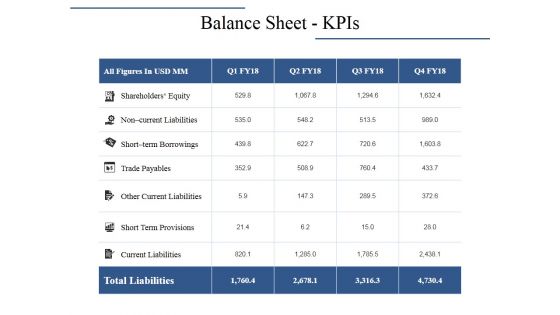
Balance Sheet Kpis Ppt PowerPoint Presentation Infographics Inspiration
This is a balance sheet kpis ppt powerpoint presentation infographics inspiration. This is a four stage process. The stages in this process are shareholders equity, trade payables, other current liabilities, current liabilities.
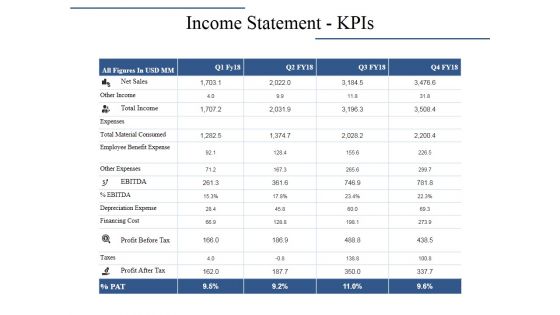
Income Statement Kpis Ppt PowerPoint Presentation Layouts Graphics Pictures
This is a income statement kpis ppt powerpoint presentation layouts graphics pictures. This is a four stage process. The stages in this process are net sales, total income, other income, profit before tax, expenses.
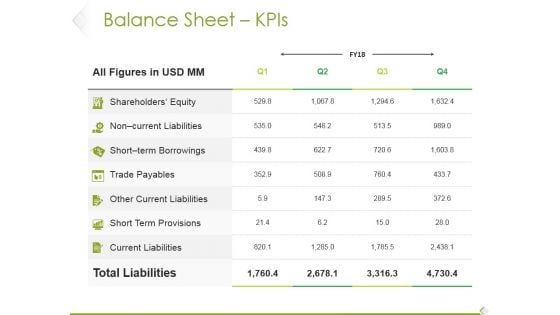
Balance Sheet Kpis Ppt PowerPoint Presentation Show Designs
This is a balance sheet kpis ppt powerpoint presentation show designs. This is a four stage process. The stages in this process are shareholders equity, non current liabilities, trade payables, total liabilities.
Income Statement Kpis Ppt PowerPoint Presentation Icon Background Images
This is a income statement kpis ppt powerpoint presentation icon background images. This is a four stage process. The stages in this process are net sales, other income, expenses, other expenses, total material consumed.
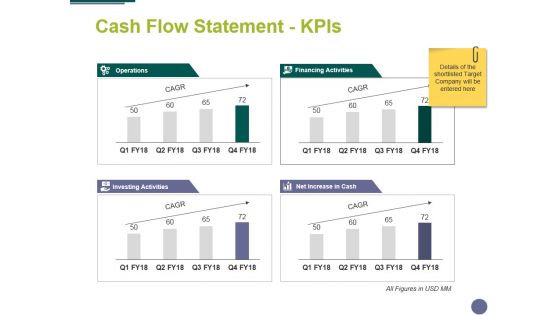
Cash Flow Statement Kpis Ppt PowerPoint Presentation File Styles
This is a cash flow statement kpis ppt powerpoint presentation file styles. This is a four stage process. The stages in this process are management, business, marketing, compere, strategy.
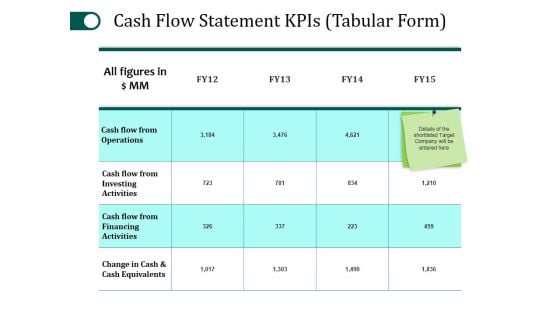
Cash Flow Statement Kpis Template 1 Ppt PowerPoint Presentation Templates
This is a cash flow statement kpis template 1 ppt powerpoint presentation templates. This is a four stage process. The stages in this process are cash flow from operations, cash flow from investing activities, cash flow from financing activities.
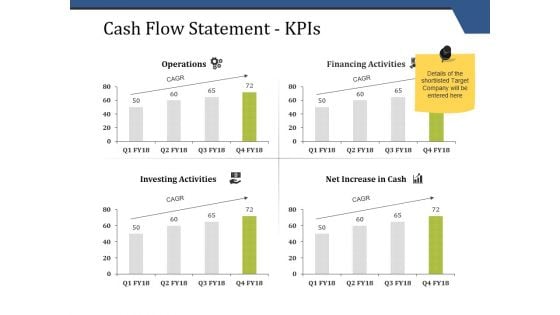
Cash Flow Statement Kpis Ppt PowerPoint Presentation Summary Graphics
This is a cash flow statement kpis ppt powerpoint presentation summary graphics. This is a four stage process. The stages in this process are business, compare sheet, management, analysis, strategy.
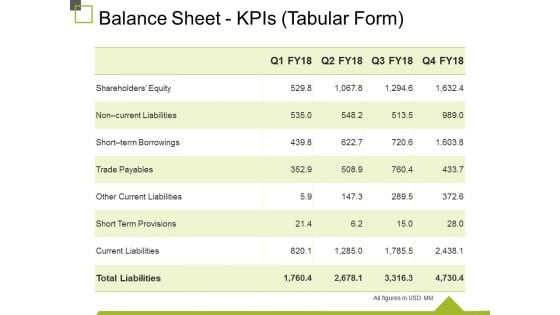
Balance Sheet Kpis Tabular Form Ppt PowerPoint Presentation Gallery Example
This is a balance sheet kpis tabular form ppt powerpoint presentation gallery example. This is a four stage process. The stages in this process are trade payables, other current liabilities, short term provisions, current liabilities, total liabilities.
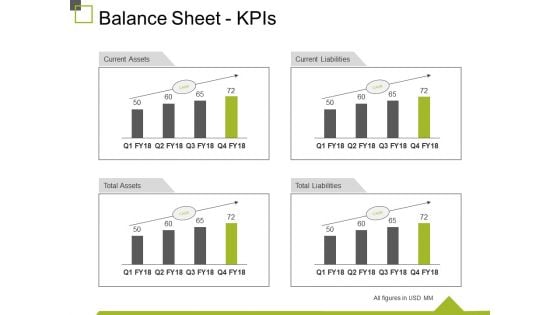
Balance Sheet Kpis Ppt PowerPoint Presentation Visual Aids Inspiration
This is a balance sheet kpis ppt powerpoint presentation visual aids inspiration. This is a four stage process. The stages in this process are current assets, current liabilities, total liabilities, total assets, business.
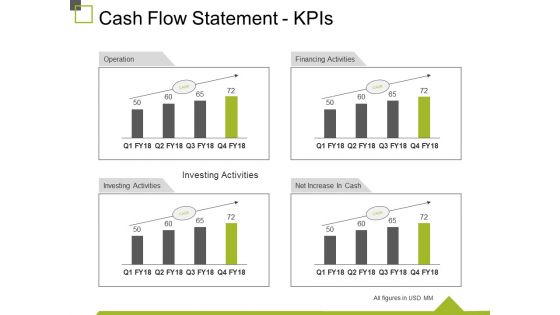
Cash Flow Statement Kpis Ppt PowerPoint Presentation Ideas Graphics
This is a cash flow statement kpis ppt powerpoint presentation ideas graphics. This is a four stage process. The stages in this process are operation, financing activities, net increase in cash, investing activities, business.
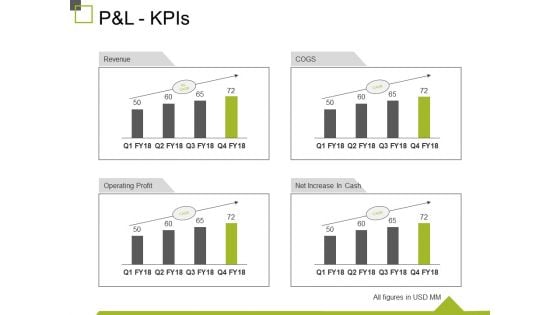
P And L Kpis Ppt PowerPoint Presentation Show Design Inspiration
This is a p and l kpis ppt powerpoint presentation show design inspiration. This is a four stage process. The stages in this process are revenue, operating profit, cogs, net increase in cash, business.
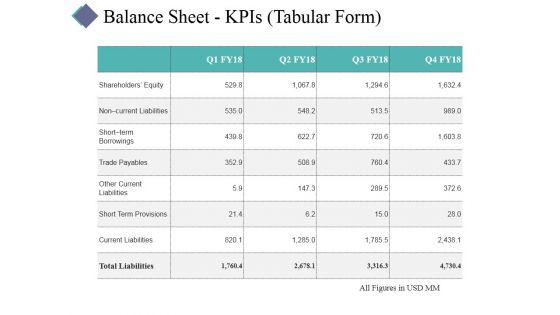
Balance Sheet Kpis Template 1 Ppt PowerPoint Presentation Gallery Visuals
This is a balance sheet kpis template 1 ppt powerpoint presentation gallery visuals. This is a four stage process. The stages in this process are business, table, management, analysis, success.
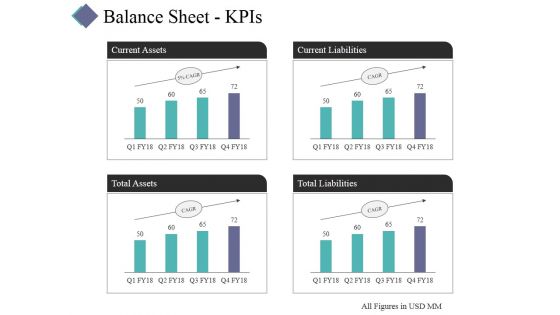
Balance Sheet Kpis Template 2 Ppt PowerPoint Presentation Ideas Show
This is a balance sheet kpis template 2 ppt powerpoint presentation ideas show. This is a four stage process. The stages in this process are current assets, total assets, total liabilities, current liabilities.
Balance Sheet Kpis Tabular Form Ppt PowerPoint Presentation Show Icons
This is a balance sheet kpis tabular form ppt powerpoint presentation show icons. This is a four stage process. The stages in this process are current assets, total assets, total liabilities, current liabilities.
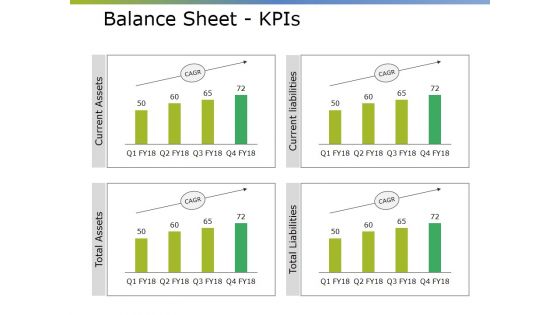
Balance Sheet Kpis Ppt PowerPoint Presentation Styles Clipart
This is a balance sheet kpis ppt powerpoint presentation styles clipart. This is a four stage process. The stages in this process are current liabilities, short term provisions, other current liabilities, trade payables, shareholders equity.
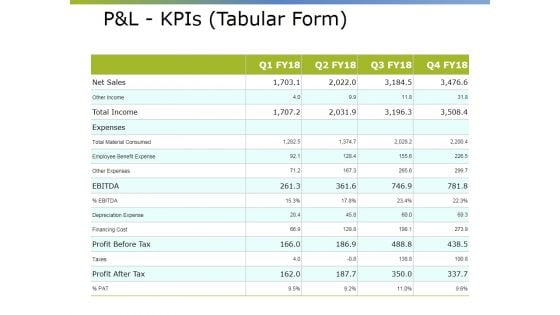
Pandl Kpis Tabular Form Ppt PowerPoint Presentation Pictures Visual Aids
This is a pandl kpis tabular form ppt powerpoint presentation pictures visual aids. This is a four stage process. The stages in this process are revenue, operating profit, cogs, net profit.
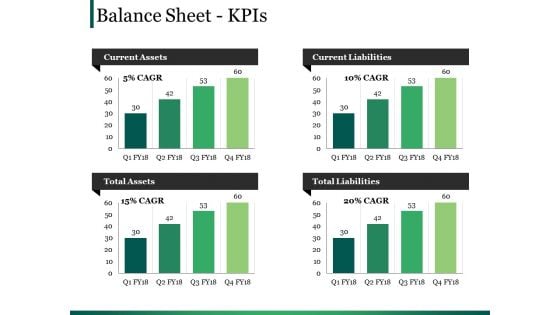
Balance Sheet Kpis Ppt PowerPoint Presentation Layouts Design Ideas
This is a balance sheet kpis ppt powerpoint presentation layouts design ideas. This is a four stage process. The stages in this process are current assets, current liabilities, total assets, total liabilities.
Pandl Kpis Template Ppt PowerPoint Presentation Model Icon
This is a pandl kpis template ppt powerpoint presentation model icon. This is a four stage process. The stages in this process are revenue, cogs, operating profit, net profit.
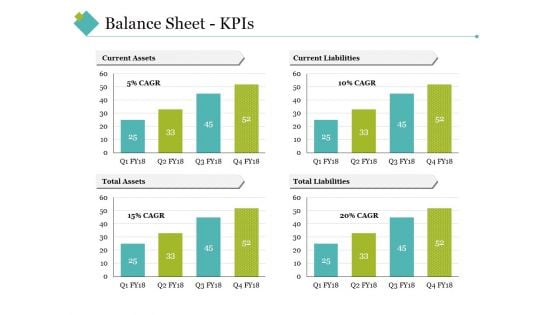
Balance Sheet Kpis Ppt PowerPoint Presentation Infographics Good
This is a balance sheet kpis ppt powerpoint presentation infographics good. This is a four stage process. The stages in this process are current assets, current liabilities, total assets, total liabilities.
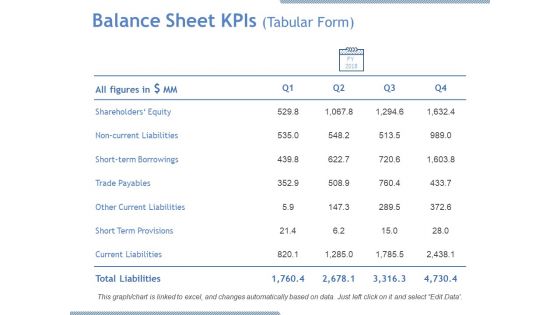
Balance Sheet Kpis Tabular Form Ppt PowerPoint Presentation Gallery Examples
This is a balance sheet kpis tabular form ppt powerpoint presentation gallery examples. This is a four stage process. The stages in this process are shareholders equity, trade payables, short term provisions, current liabilities, total liabilities.
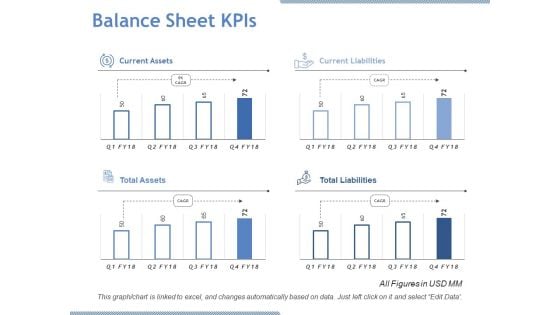
Balance Sheet Kpis Ppt PowerPoint Presentation Infographic Template Inspiration
This is a balance sheet kpis ppt powerpoint presentation infographic template inspiration. This is a four stage process. The stages in this process are current assets, current liabilities, total assets, total liabilities.
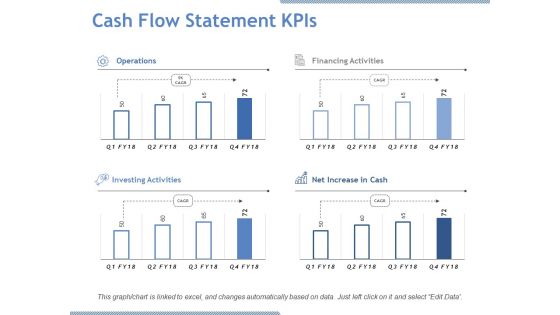
Cash Flow Statement Kpis Ppt PowerPoint Presentation Model Samples
This is a cash flow statement kpis ppt powerpoint presentation model samples. This is a four stage process. The stages in this process are operations, financing activities, investing activities, increase in cash.
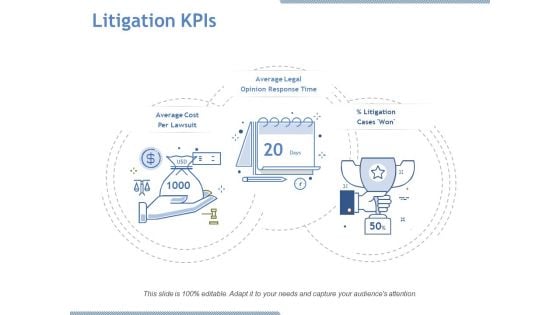
Litigation Kpis Ppt PowerPoint Presentation Layouts Clipart Images
This is a litigation kpis ppt powerpoint presentation layouts clipart images. This is a three stage process. The stages in this process are average cost per lawsuit, litigation cases won, average legal opinion response time.
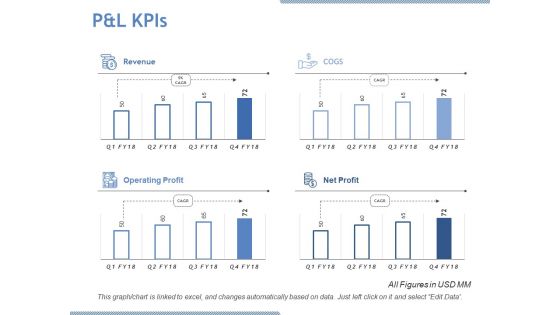
P And L Kpis Ppt PowerPoint Presentation Designs Download
This is a p and l kpis ppt powerpoint presentation designs download. This is a four stage process. The stages in this process are revenue, cogs, operating profit, net profit.


 Continue with Email

 Home
Home


