Dashboards
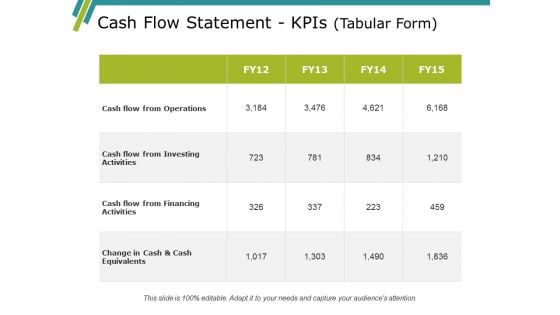
Cash Flow Statement Kpis Template Ppt PowerPoint Presentation Pictures Diagrams
This is a cash flow statement kpis template ppt powerpoint presentation pictures diagrams. This is a four stage process. The stages in this process are operations, financing activities, investing activities, net increase in cash.
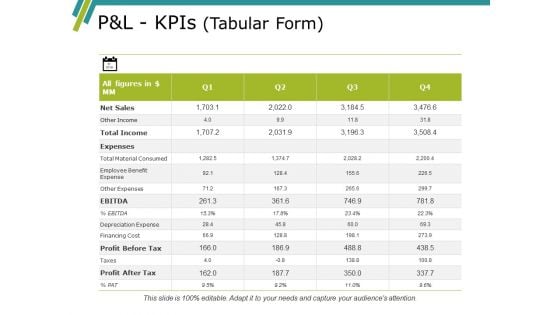
Pandl Kpis Template Ppt PowerPoint Presentation Gallery Summary
This is a pandl kpis template ppt powerpoint presentation gallery summary. This is a four stage process. The stages in this process are revenue, cogs, operating profit, net profit.
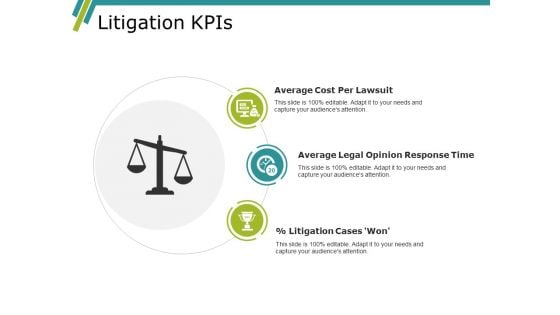
Litigation Kpis Ppt PowerPoint Presentation Layouts Graphics Template
This is a litigation kpis ppt powerpoint presentation layouts graphics template. This is a three stage process. The stages in this process are average cost per lawsuit, average legal opinion response time, litigation cases.
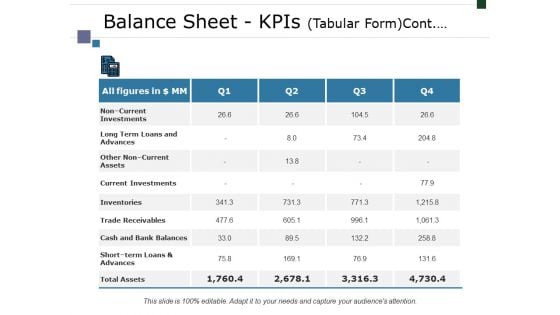
Balance Sheet Kpis Tabular Formcont Ppt PowerPoint Presentation Infographics Visuals
This is a balance sheet kpis tabular formcont ppt powerpoint presentation infographics visuals. This is a four stage process. The stages in this process are noncurrent, investments, long term loans and advances, current investments, inventories.
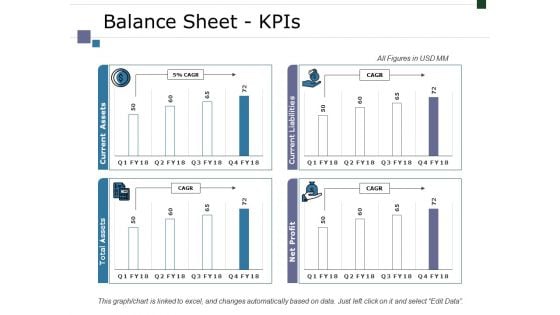
Balance Sheet Kpis Ppt PowerPoint Presentation Infographic Template Designs
This is a balance sheet kpis ppt powerpoint presentation infographic template designs. This is a four stage process. The stages in this process are business, marketing, finance, graph, strategy.
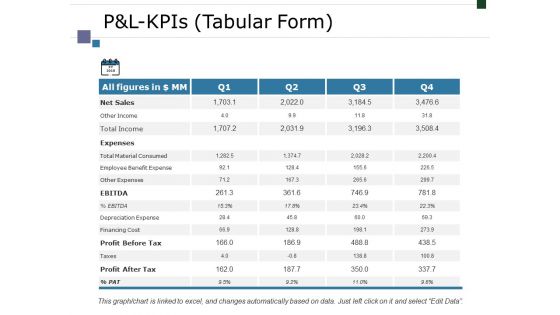
Pandl Kpis Tabular Form Ppt PowerPoint Presentation Outline Background
This is a pandl kpis tabular form ppt powerpoint presentation outline background. This is a four stage process. The stages in this process are net sales, expenses, ebitda, profit before tax, profit after tax.
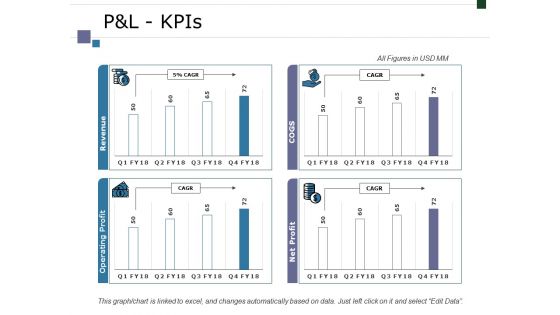
Pandl Kpis Ppt PowerPoint Presentation Infographic Template Graphics Tutorials
This is a pandl kpis ppt powerpoint presentation infographic template graphics tutorials. This is a four stage process. The stages in this process are business, marketing, finance, graph, strategy.
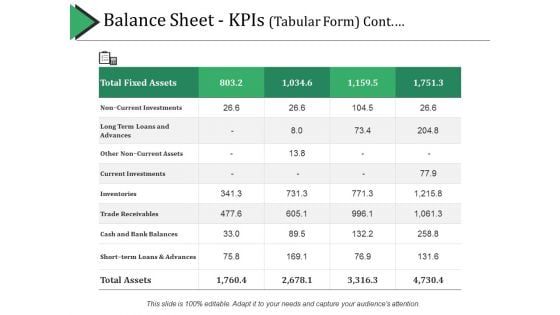
Balance Sheet Kpis Continue Ppt PowerPoint Presentation Slides File Formats
This is a balance sheet kpis continue ppt powerpoint presentation slides file formats. This is a four stage process. The stages in this process are balance sheet, finance, marketing, strategy, business.
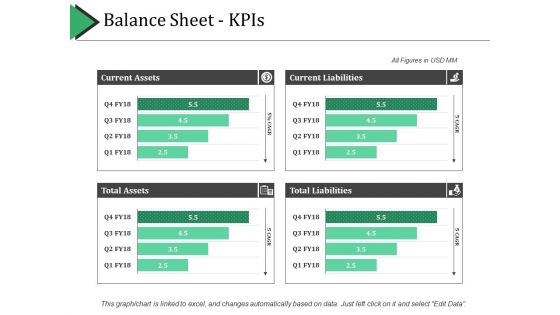
Balance Sheet Kpis Template 1 Ppt PowerPoint Presentation Pictures Grid
This is a balance sheet kpis template 1 ppt powerpoint presentation pictures grid. This is a four stage process. The stages in this process are current assets, current liabilities, total assets, total liabilities.
Balance Sheet Kpis Template 2 Ppt PowerPoint Presentation Portfolio Icons
This is a balance sheet kpis template 2 ppt powerpoint presentation portfolio icons. This is a four stage process. The stages in this process are balance sheet, finance, marketing, strategy, business.
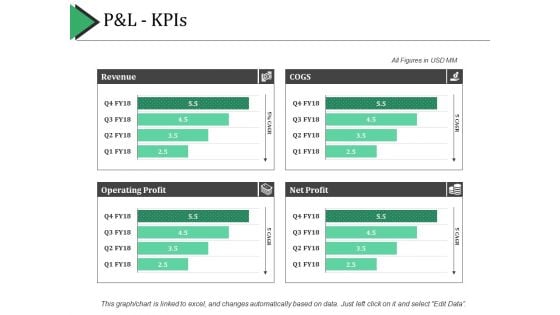
P And L Kpis Ppt PowerPoint Presentation Show Example Introduction
This is a p and l kpis ppt powerpoint presentation show example introduction. This is a four stage process. The stages in this process are revenue, cogs, net profit, operating profit.
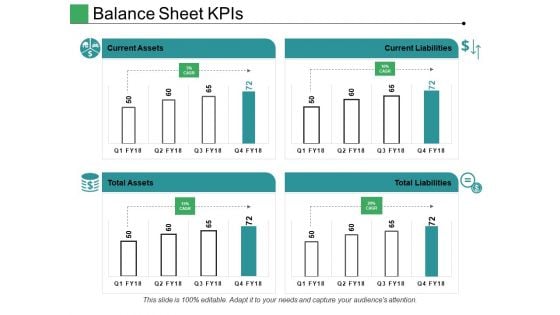
Balance Sheet Kpis Ppt PowerPoint Presentation Model Layout Ideas
This is a balance sheet kpis ppt powerpoint presentation model layout ideas. This is a four stage process. The stages in this process are current assets, current liabilities, total assets, total liabilities.
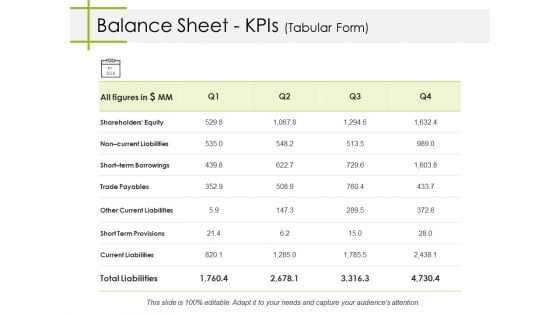
Balance Sheet Kpis Tabular Form Ppt PowerPoint Presentation Pictures Gridlines
This is a balance sheet kpis tabular form ppt powerpoint presentation pictures gridlines. This is a four stage process. The stages in this process are trade payables, other current liabilities, short term provisions, current liabilities, short term borrowings.
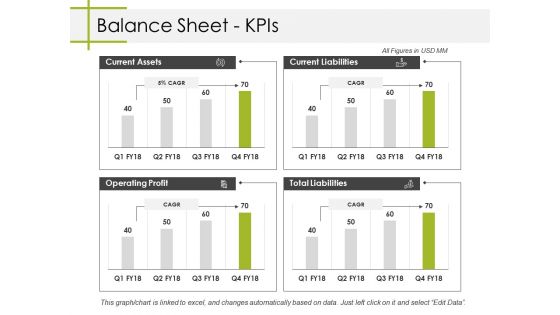
Balance Sheet Kpis Ppt PowerPoint Presentation Summary Designs Download
This is a balance sheet kpis ppt powerpoint presentation summary designs download. This is a four stage process. The stages in this process are current assets, current liabilities, total liabilities, operating profit, business.
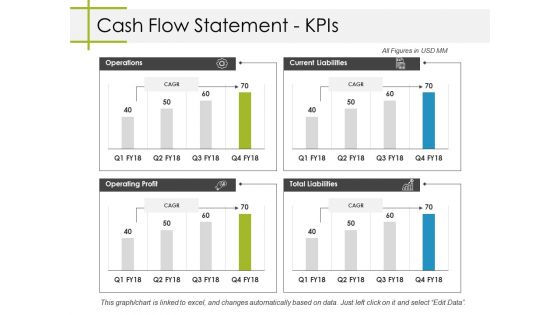
Cash Flow Statement Kpis Ppt PowerPoint Presentation Styles Themes
This is a cash flow statement kpis ppt powerpoint presentation styles themes. This is a four stage process. The stages in this process are business, operations, operating profit, total liabilities, current liabilities.
Pandl Kpis Tabular Form Ppt PowerPoint Presentation Icon
This is a pandl kpis tabular form ppt powerpoint presentation icon. This is a four stage process. The stages in this process are business, net sales, total income, expenses, profit before tax, profit after tax.
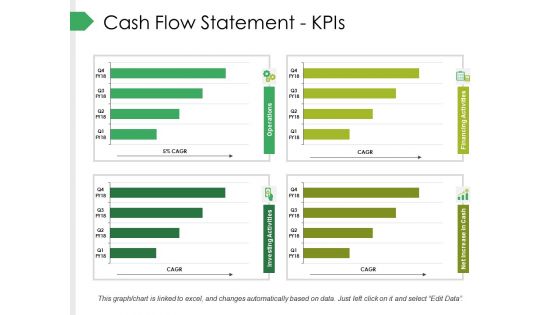
Cash Flow Statement Kpis Ppt PowerPoint Presentation Pictures Graphics
This is a cash flow statement kpis ppt powerpoint presentation pictures graphics. This is a four stage process. The stages in this process are business, marketing, graph, finance, strategy.
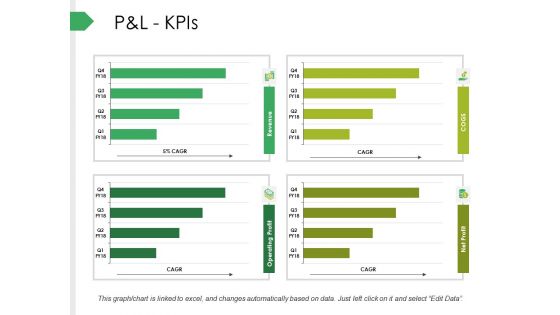
P And L Kpis Ppt PowerPoint Presentation Infographics Background
This is a p and l kpis ppt powerpoint presentation infographics background. This is a four stage process. The stages in this process are net sales, expenses, ebitda, profit before tax, profit after tax.
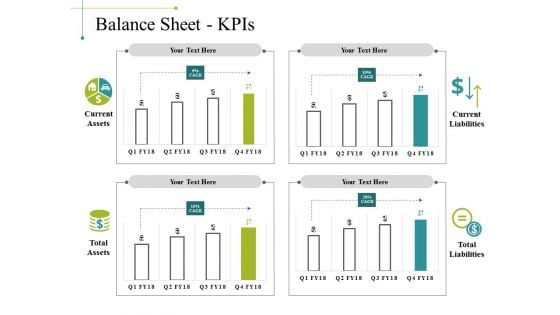
Balance Sheet Kpis Template 1 Ppt PowerPoint Presentation Show Inspiration
This is a balance sheet kpis template 1 ppt powerpoint presentation show inspiration. This is a four stage process. The stages in this process are business, marketing, graph, current liabilities, total liabilities.
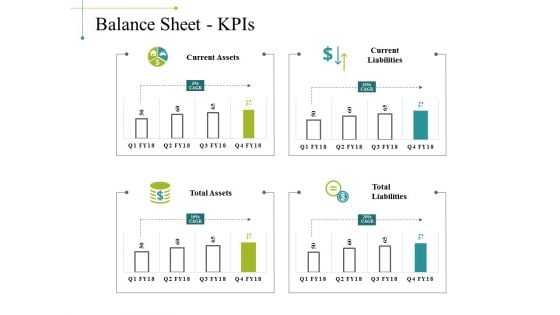
Balance Sheet Kpis Template 2 Ppt PowerPoint Presentation Gallery Example
This is a balance sheet kpis template 2 ppt powerpoint presentation gallery example. This is a four stage process. The stages in this process are business, marketing, graph, current liabilities, total liabilities.
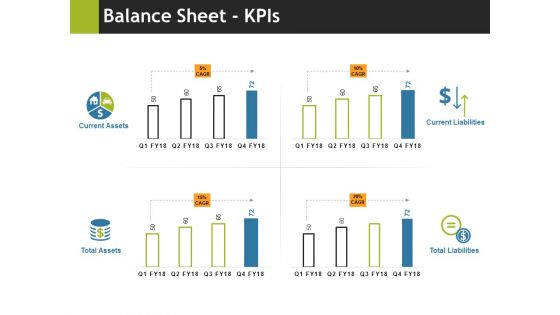
Balance Sheet Kpis Ppt PowerPoint Presentation Slides Download
This is a balance sheet kpis ppt powerpoint presentation slides download. This is a four stage process. The stages in this process are current assets, total assets, current liabilities, total liabilities, business.
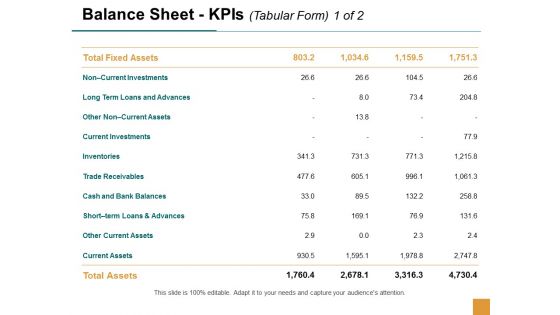
Balance Sheet Kpis Current Investments Ppt Powerpoint Presentation Professional Deck
This is a balance sheet kpis current investments ppt powerpoint presentation professional deck. This is a four stage process. The stages in this process are business, management, planning, strategy, marketing.
Balance Sheet Kpis Trade Payables Ppt Powerpoint Presentation Gallery Icon
This is a balance sheet kpis trade payables ppt powerpoint presentation gallery icon. This is a four stage process. The stages in this process are finance, marketing, management, investment, analysis.
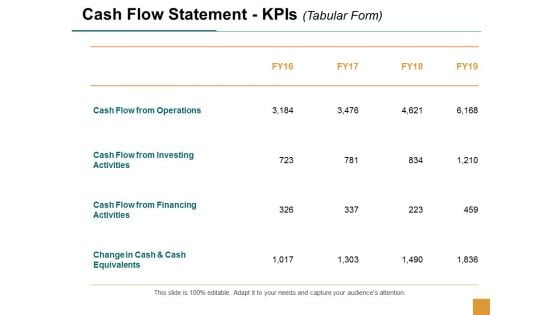
Cash Flow Statement Kpis Business Ppt Powerpoint Presentation Infographics Demonstration
This is a cash flow statement kpis business ppt powerpoint presentation infographics demonstration. This is a four stage process. The stages in this process are business, management, planning, strategy, marketing.
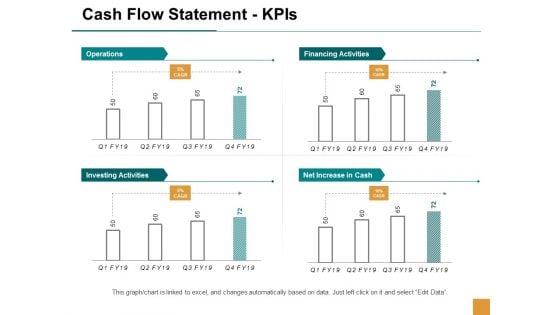
Cash Flow Statement Kpis Ppt Powerpoint Presentation Styles Graphics Tutorials
This is a cash flow statement kpis ppt powerpoint presentation styles graphics tutorials. This is a four stage process. The stages in this process are finance, marketing, management, investment, analysis.
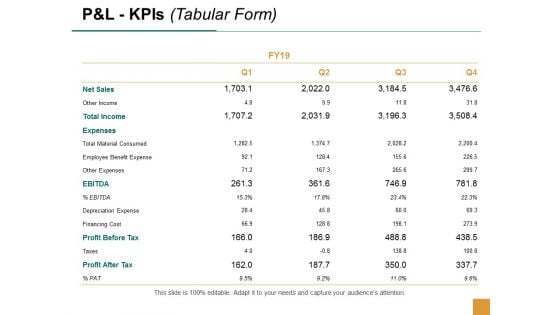
P And L Kpis Expenses Ppt Powerpoint Presentation Gallery Layouts
This is a p and l kpis expenses ppt powerpoint presentation gallery layouts. This is a four stage process. The stages in this process are business, management, planning, strategy, marketing.
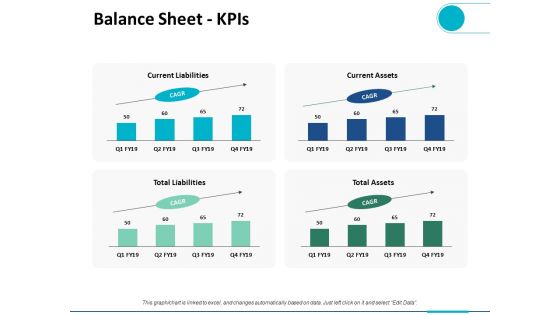
Balance Sheet Kpis Ppt PowerPoint Presentation Summary Gridlines
This is a balance sheet kpis ppt powerpoint presentation summary gridlines. This is a four stage process. The stages in this process are current liabilities, trade payables, marketing, planning, strategy.

Cash Flow Statement Kpis Ppt PowerPoint Presentation Gallery Vector
This is a cash flow statement kpis ppt powerpoint presentation gallery vector. This is a four stage process. The stages in this process are business, planning, strategy, marketing, management.
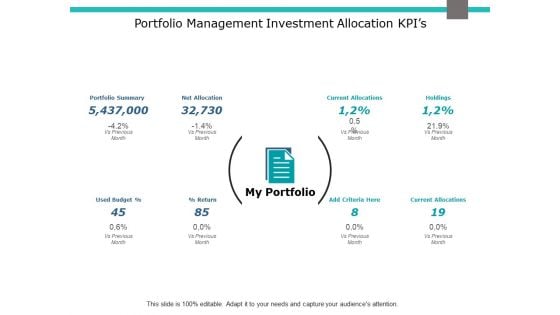
Portfolio Management Investment Allocation Kpis Ppt PowerPoint Presentation Gallery Slide
This is a portfolio management investment allocation kpis ppt powerpoint presentation gallery slide. This is a eight stage process. The stages in this process are business, management, marketing, agenda.
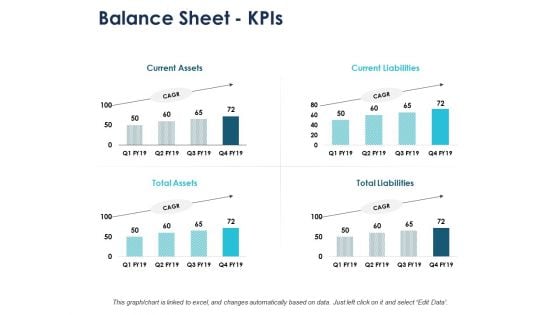
Balance Sheet Kpis Marketing Ppt PowerPoint Presentation File Pictures
This is a balance sheet kpis marketing ppt powerpoint presentation file pictures. This is a four stage process. The stages in this process are finance, marketing, management, investment, analysis.
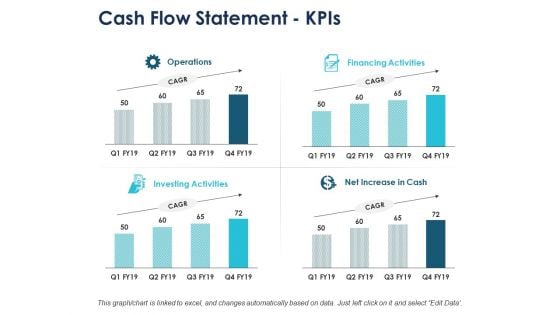
Cash Flow Statement Kpis Business Ppt PowerPoint Presentation Gallery Introduction
This is a cash flow statement kpis business ppt powerpoint presentation gallery introduction. This is a four stage process. The stages in this process are compare, marketing, business, management, planning.
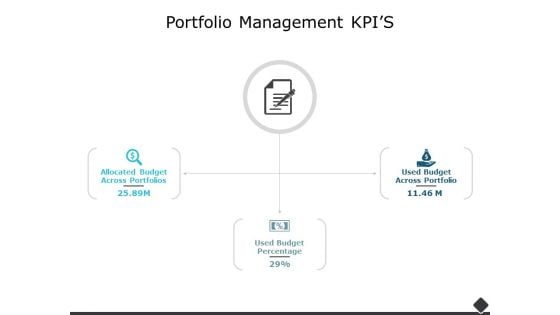
Portfolio Management Kpis Ppt PowerPoint Presentation Summary Portfolio
This is a portfolio management kpis ppt powerpoint presentation summary portfolio. The topics discussed in this diagram are business, marketing, management. This is a completely editable PowerPoint presentation, and is available for immediate download.
Portfolio Management Investment Allocation Kpis Ppt PowerPoint Presentation Icon Show
This is a portfolio management investment allocation kpis ppt powerpoint presentation icon show. The topics discussed in this diagram are management, marketing, business, strategy, planning. This is a completely editable PowerPoint presentation, and is available for immediate download.
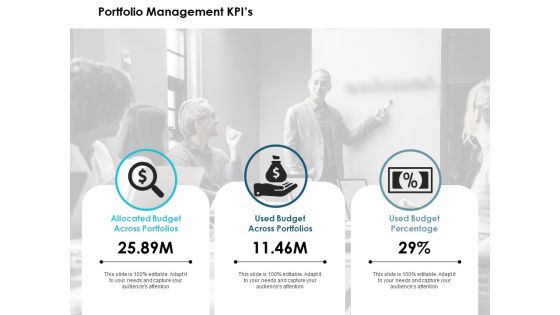
Portfolio Management Kpis Ppt PowerPoint Presentation Pictures Design Inspiration
This is a portfolio management kpis ppt powerpoint presentation pictures design inspiration. This is a three stage process. The stages in this process are management, marketing, business, strategy, planning.
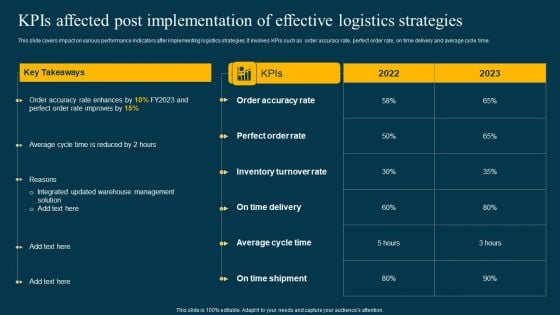
Kpis Affected Post Implementation Of Effective Logistics Strategies Rules PDF
This slide covers impact on various performance indicators after implementing logistics strategies. It involves KPIs such as order accuracy rate, perfect order rate, on time delivery and average cycle time. Presenting this PowerPoint presentation, titled Kpis Affected Post Implementation Of Effective Logistics Strategies Rules PDF, with topics curated by our researchers after extensive research. This editable presentation is available for immediate download and provides attractive features when used. Download now and captivate your audience. Presenting this Kpis Affected Post Implementation Of Effective Logistics Strategies Rules PDF. Our researchers have carefully researched and created these slides with all aspects taken into consideration. This is a completely customizable Kpis Affected Post Implementation Of Effective Logistics Strategies Rules PDF that is available for immediate downloading. Download now and make an impact on your audience. Highlight the attractive features available with our PPTs.
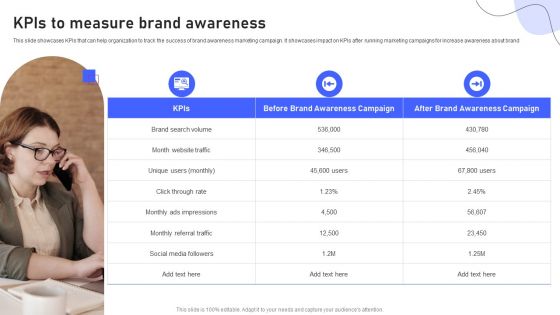
Strategies For Marketing Kpis To Measure Brand Awareness Background PDF
This slide showcases KPIs that can help organization to track the success of brand awareness marketing campaign. It showcases impact on KPIs after running marketing campaigns for increase awareness about brand. Formulating a presentation can take up a lot of effort and time, so the content and message should always be the primary focus. The visuals of the PowerPoint can enhance the presenters message, so our Strategies For Marketing Kpis To Measure Brand Awareness Background PDF was created to help save time. Instead of worrying about the design, the presenter can concentrate on the message while our designers work on creating the ideal templates for whatever situation is needed. Slidegeeks has experts for everything from amazing designs to valuable content, we have put everything into Strategies For Marketing Kpis To Measure Brand Awareness Background PDF.
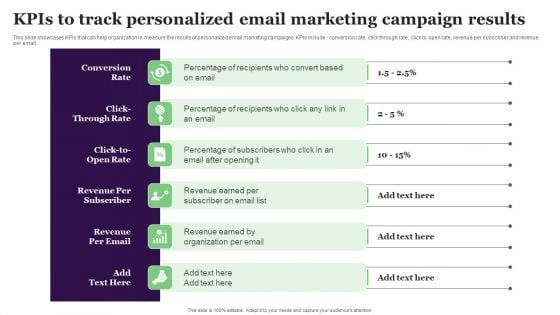
Kpis To Track Personalized Email Marketing Campaign Results Slides PDF
This slide showcases KPIs that can help organization in measure the results of personalized email marketing campaigns. KPIs include - conversion rate, click through rate, click to open rate, revenue per subscriber and revenue per email. Get a simple yet stunning designed Kpis To Track Personalized Email Marketing Campaign Results Slides PDF. It is the best one to establish the tone in your meetings. It is an excellent way to make your presentations highly effective. So, download this PPT today from Slidegeeks and see the positive impacts. Our easy-to-edit Kpis To Track Personalized Email Marketing Campaign Results Slides PDF can be your go-to option for all upcoming conferences and meetings. So, what are you waiting for Grab this template today.
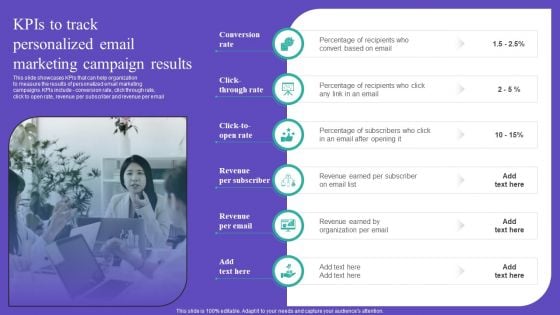
Kpis To Track Personalized Email Marketing Campaign Results Guidelines PDF
This slide showcases KPIs that can help organization to measure the results of personalized email marketing campaigns. KPIs include - conversion rate, click through rate, click to open rate, revenue per subscriber and revenue per email Do you have to make sure that everyone on your team knows about any specific topic I yes, then you should give Kpis To Track Personalized Email Marketing Campaign Results Guidelines PDF a try. Our experts have put a lot of knowledge and effort into creating this impeccable Kpis To Track Personalized Email Marketing Campaign Results Guidelines PDF. You can use this template for your upcoming presentations, as the slides are perfect to represent even the tiniest detail. You can download these templates from the Slidegeeks website and these are easy to edit. So grab these today
Operational KPIS Ppt PowerPoint Presentation Ideas Clipart Images Cpb
Presenting this set of slides with name operational kpis ppt powerpoint presentation ideas clipart images cpb. This is an editable Powerpoint five stages graphic that deals with topics like operational kpis to help convey your message better graphically. This product is a premium product available for immediate download and is 100 percent editable in Powerpoint. Download this now and use it in your presentations to impress your audience.
Supplier Scorecard Kpis Ppt PowerPoint Presentation Professional Slide Cpb
Presenting this set of slides with name supplier scorecard kpis ppt powerpoint presentation professional slide cpb. This is an editable Powerpoint three stages graphic that deals with topics like supplier scorecard kpis to help convey your message better graphically. This product is a premium product available for immediate download and is 100 percent editable in Powerpoint. Download this now and use it in your presentations to impress your audience.
High Performance KPIS Ppt PowerPoint Presentation Show Examples Cpb
Presenting this set of slides with name high performance kpis ppt powerpoint presentation show examples cpb. This is an editable Powerpoint four stages graphic that deals with topics like high performance kpis to help convey your message better graphically. This product is a premium product available for immediate download and is 100 percent editable in Powerpoint. Download this now and use it in your presentations to impress your audience.
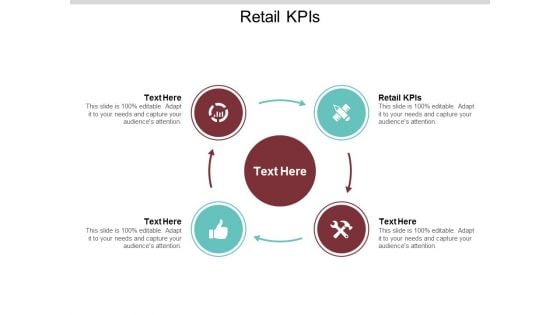
Retail KPIS Ppt PowerPoint Presentation Layouts File Formats Cpb
Presenting this set of slides with name retail kpis ppt powerpoint presentation layouts file formats cpb. This is an editable Powerpoint three stages graphic that deals with topics like retail kpis to help convey your message better graphically. This product is a premium product available for immediate download and is 100 percent editable in Powerpoint. Download this now and use it in your presentations to impress your audience.

Sales Management KPIS Ppt PowerPoint Presentation Model Visuals Cpb
Presenting this set of slides with name sales management kpis ppt powerpoint presentation model visuals cpb. This is an editable Powerpoint four stages graphic that deals with topics like sales management kpis to help convey your message better graphically. This product is a premium product available for immediate download and is 100 percent editable in Powerpoint. Download this now and use it in your presentations to impress your audience.
Security Awareness Tracking Kpis Ppt Slides Shapes PDF
This slide covers the key performance for security awareness training including compliance, security culture and incident reduction. Deliver and pitch your topic in the best possible manner with this security awareness tracking kpis ppt slides shapes pdf. Use them to share invaluable insights on security awareness tracking kpis and impress your audience. This template can be altered and modified as per your expectations. So, grab it now.
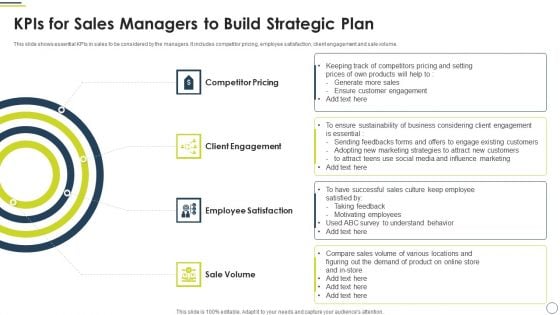
Kpis For Sales Managers To Build Strategic Plan Inspiration PDF
This slide shows essential KPIs in sales to be considered by the managers. It includes competitor pricing, employee satisfaction, client engagement and sale volume. Presenting Kpis For Sales Managers To Build Strategic Plan Inspiration PDF to dispense important information. This template comprises four stages. It also presents valuable insights into the topics including Competitor Pricing, Client Engagement, Employee Satisfaction. This is a completely customizable PowerPoint theme that can be put to use immediately. So, download it and address the topic impactfully.
Kpis Icon To Measure Organizational Efficiency Gains Pictures PDF
Persuade your audience using this Kpis Icon To Measure Organizational Efficiency Gains Pictures PDF. This PPT design covers three stages, thus making it a great tool to use. It also caters to a variety of topics including Kpis Icon, Measure Organizational, Efficiency Gains. Download this PPT design now to present a convincing pitch that not only emphasizes the topic but also showcases your presentation skills.
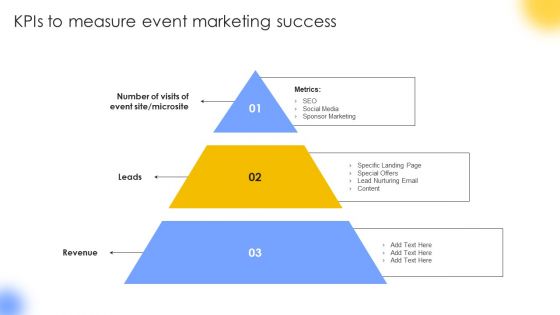
Kpis To Measure Event Marketing Success Portrait PDF
Get a simple yet stunning designed Kpis To Measure Event Marketing Success Portrait PDF. It is the best one to establish the tone in your meetings. It is an excellent way to make your presentations highly effective. So, download this PPT today from Slidegeeks and see the positive impacts. Our easy-to-edit Kpis To Measure Event Marketing Success Portrait PDF can be your go-to option for all upcoming conferences and meetings. So, what are you waiting for Grab this template today.

Kpis To Measure Personalized Marketing Results Inspiration PDF
Get a simple yet stunning designed Kpis To Measure Personalized Marketing Results Inspiration PDF. It is the best one to establish the tone in your meetings. It is an excellent way to make your presentations highly effective. So, download this PPT today from Slidegeeks and see the positive impacts. Our easy-to-edit Kpis To Measure Personalized Marketing Results Inspiration PDF can be your go-to option for all upcoming conferences and meetings. So, what are you waiting for Grab this template today.
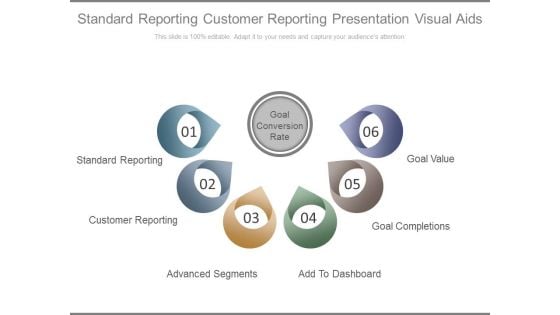
Standard Reporting Customer Reporting Presentation Visual Aids Ppt Slides
This is a standard reporting customer reporting presentation visual aids ppt slide. This is a six stage process. The stages in this process are business, marketing.
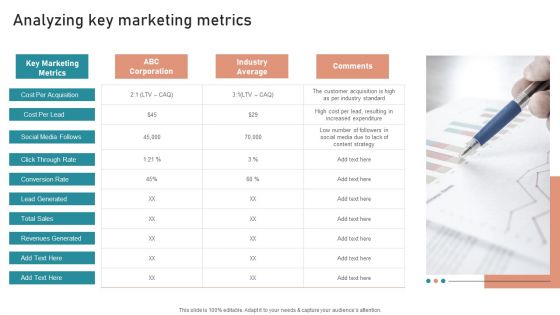
B2B And B2C Startups Marketing Mix Strategies Analyzing Key Marketing Metrics Download PDF
Boost your pitch with our creative B2B And B2C Startups Marketing Mix Strategies Analyzing Key Marketing Metrics Download PDF. Deliver an awe inspiring pitch that will mesmerize everyone. Using these presentation templates you will surely catch everyones attention. You can browse the ppts collection on our website. We have researchers who are experts at creating the right content for the templates. So you do not have to invest time in any additional work. Just grab the template now and use them.
8 Stages Concentric Data Flow Diagram Marketing Business Plan Template PowerPoint Templates
We present our 8 stages concentric data flow diagram marketing business plan template PowerPoint templates.Download and present our Business PowerPoint Templates because They will Put the wind in your sails. Skim smoothly over the choppy waters of the market. Use our Flow Charts PowerPoint Templates because It will let you Set new benchmarks with our PowerPoint Templates and Slides. They will keep your prospects well above par. Use our Marketing PowerPoint Templates because You have gained great respect for your brilliant ideas. Use our PowerPoint Templates and Slides to strengthen and enhance your reputation. Download and present our Process and Flows PowerPoint Templates because You can Hit the nail on the head with our PowerPoint Templates and Slides. Embed your ideas in the minds of your audience. Download and present our Circle Charts PowerPoint Templates because Our PowerPoint Templates and Slides will Embellish your thoughts. They will help you illustrate the brilliance of your ideas.Use these PowerPoint slides for presentations relating to Blue, swirl, abstract, background, design, motion, shape, vector, round, graphic, business, pattern, liquid, blank, flowing, effect, wallpaper, decoration, white, concept, bright, curve, circle, clean, technology, illustration, energy, creativity, color, art, style, space, image, simplicity, textured. The prominent colors used in the PowerPoint template are Black, Blue light, Blue. Capture emerging international markets with our 8 Stages Concentric Data Flow Diagram Marketing Business Plan Template PowerPoint Templates. They will make you look good.
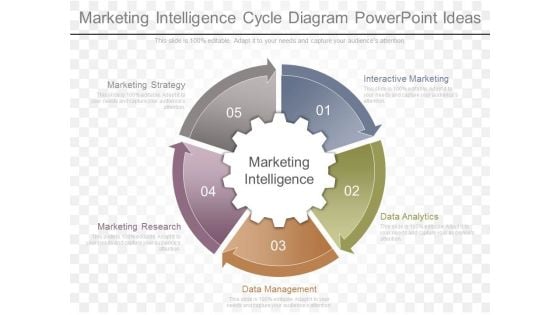
Marketing Intelligence Cycle Diagram Powerpoint Ideas
This is a marketing intelligence cycle diagram powerpoint ideas. This is a five stage process. The stages in this process are marketing strategy, marketing research, interactive marketing, data analytics, data management.
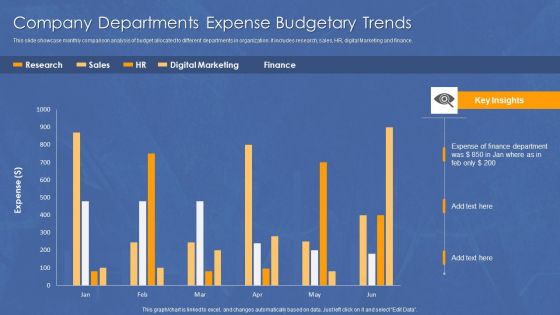
Company Departments Expense Budgetary Trends Diagrams PDF
This slide showcase monthly comparison analysis of budget allocated to different departments in organization. It includes research, sales, HR, digital Marketing and finance. Pitch your topic with ease and precision using this Company Departments Expense Budgetary Trends Diagrams PDF. This layout presents information on Expense, Finance, Department. It is also available for immediate download and adjustment. So, changes can be made in the color, design, graphics or any other component to create a unique layout.
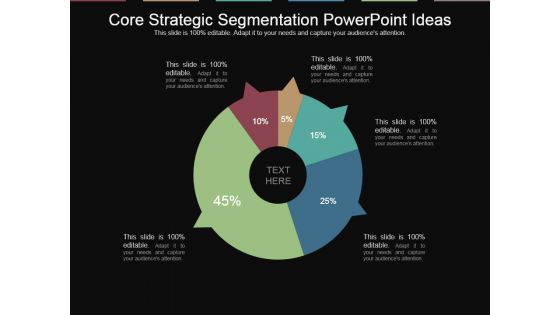
Core Strategic Segmentation Powerpoint Ideas
This is a core strategic segmentation powerpoint ideas. This is a five stage process. The stages in this process are data, diagram, business, marketing, analysis.
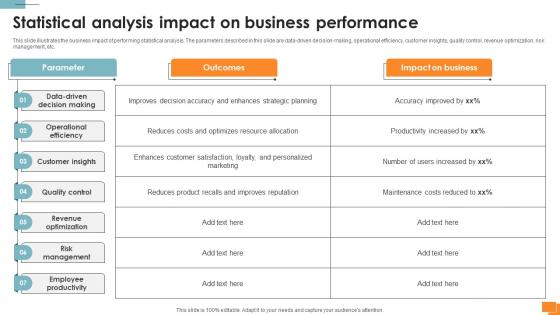
Statistical Tools For Evidence Statistical Analysis Impact On Business Performance
This slide illustrates the business impact of performing statistical analysis. The parameters described in this slide are data-driven decision-making, operational efficiency, customer insights, quality control, revenue optimization, risk management, etc. Do you know about Slidesgeeks Statistical Tools For Evidence Statistical Analysis Impact On Business Performance These are perfect for delivering any kind od presentation. Using it, create PowerPoint presentations that communicate your ideas and engage audiences. Save time and effort by using our pre-designed presentation templates that are perfect for a wide range of topic. Our vast selection of designs covers a range of styles, from creative to business, and are all highly customizable and easy to edit. Download as a PowerPoint template or use them as Google Slides themes. This slide illustrates the business impact of performing statistical analysis. The parameters described in this slide are data-driven decision-making, operational efficiency, customer insights, quality control, revenue optimization, risk management, etc.
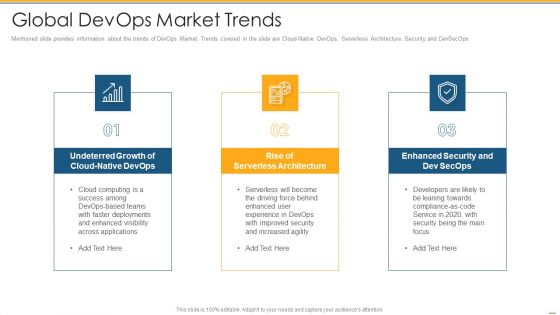
Global Devops Market Trends Ppt PowerPoint Presentation Pictures Show PDF
Deliver an awe inspiring pitch with this creative global devops market share forecasts ppt powerpoint presentation professional example pdf bundle.Topics like telecommunication, manufacturing, government can be discussed with this completely editable template. It is available for immediate download depending on the needs and requirements of the user.

Statistical Tools For Evidence Before Vs After Performing Statistical Analysis
This slide shows the before vs. after comparison of statistical analysis of business data. The different aspects compared in this slide are decision-making, operational efficiency, customer insights, product quality, revenue generation, supply chain efficiency, etc. Get a simple yet stunning designed Statistical Tools For Evidence Before Vs After Performing Statistical Analysis. It is the best one to establish the tone in your meetings. It is an excellent way to make your presentations highly effective. So, download this PPT today from Slidegeeks and see the positive impacts. Our easy-to-edit Statistical Tools For Evidence Before Vs After Performing Statistical Analysis can be your go-to option for all upcoming conferences and meetings. So, what are you waiting for Grab this template today. This slide shows the before vs. after comparison of statistical analysis of business data. The different aspects compared in this slide are decision-making, operational efficiency, customer insights, product quality, revenue generation, supply chain efficiency, etc.
Marketing Budget Gap Report Icon Summary PDF
Presenting Marketing Budget Gap Report Icon Summary PDF to dispense important information. This template comprises Three stages. It also presents valuable insights into the topics including Budget Gap, Report Icon. This is a completely customizable PowerPoint theme that can be put to use immediately. So, download it and address the topic impactfully.
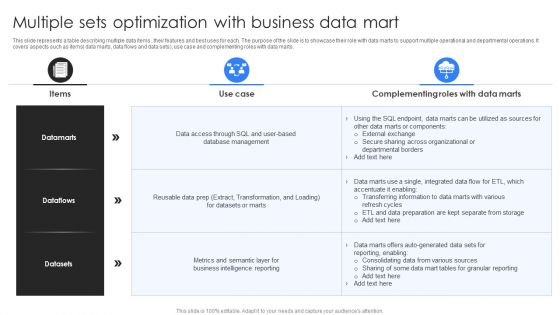
Multiple Sets Optimization With Business Data Mart Ppt Model Example Topics PDF
This slide represents a table describing multiple data items , their features and best uses for each. The purpose of the slide is to showcase their role with data marts to support multiple operational and departmental operations. It covers aspects such as items data marts, data flows and data sets, use case and complementing roles with data marts. Pitch your topic with ease and precision using this Multiple Sets Optimization With Business Data Mart Ppt Model Example Topics PDF. This layout presents information on Complementing Roles, Data Marts, Business Intelligence Reporting. It is also available for immediate download and adjustment. So, changes can be made in the color, design, graphics or any other component to create a unique layout.
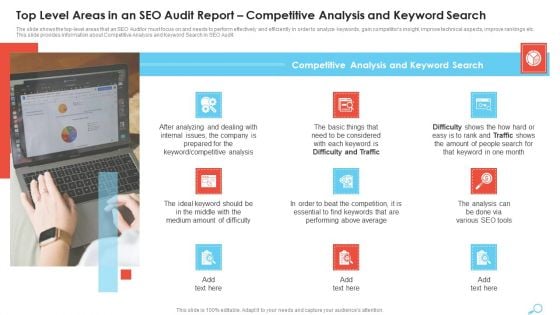
Top Level Areas In An SEO Audit Report Competitive Analysis And Keyword Search Infographics PDF
This is a Top Level Areas In An SEO Audit Report Competitive Analysis And Keyword Search Infographics PDF template with various stages. Focus and dispense information on nine stages using this creative set, that comes with editable features. It contains large content boxes to add your information on topics like Competitive Analysis, Difficulty Traffic, Performing Above. You can also showcase facts, figures, and other relevant content using this PPT layout. Grab it now.


 Continue with Email

 Home
Home


