Dashboards
Dashboard For Tracking Referral Techniques For Generating Brand Awareness Sample Pdf
This slide covers the KPI dashboard for brands to evaluate the performance of referral marketing campaigns. It includes metrics such as referral participation rate, referred customers, referral conversion rate, total revenue generated, etc Whether you have daily or monthly meetings, a brilliant presentation is necessary. Dashboard For Tracking Referral Techniques For Generating Brand Awareness Sample Pdf can be your best option for delivering a presentation. Represent everything in detail using Dashboard For Tracking Referral Techniques For Generating Brand Awareness Sample Pdf and make yourself stand out in meetings. The template is versatile and follows a structure that will cater to your requirements. All the templates prepared by Slidegeeks are easy to download and edit. Our research experts have taken care of the corporate themes as well. So, give it a try and see the results. This slide covers the KPI dashboard for brands to evaluate the performance of referral marketing campaigns. It includes metrics such as referral participation rate, referred customers, referral conversion rate, total revenue generated, etc.
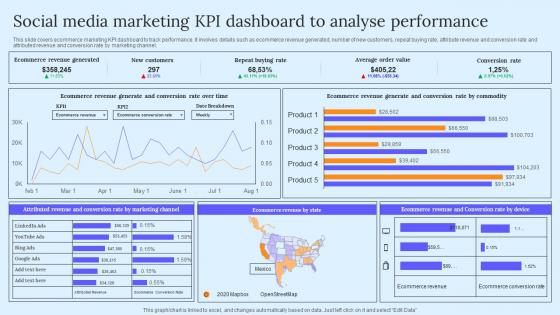
Social Media Marketing KPI Dashboard B2B Marketing Techniques To Attract Potential Pictures Pdf
This slide covers ecommerce marketing KPI dashboard to track performance. It involves details such as ecommerce revenue generated, number of new customers, repeat buying rate, attribute revenue and conversion rate and attributed revenue and conversion rate by marketing channel. Do you have an important presentation coming up Are you looking for something that will make your presentation stand out from the rest Look no further than Social Media Marketing KPI Dashboard B2B Marketing Techniques To Attract Potential Pictures Pdf. With our professional designs, you can trust that your presentation will pop and make delivering it a smooth process. And with Slidegeeks, you can trust that your presentation will be unique and memorable. So why wait Grab Social Media Marketing KPI Dashboard B2B Marketing Techniques To Attract Potential Pictures Pdf today and make your presentation stand out from the rest This slide covers ecommerce marketing KPI dashboard to track performance. It involves details such as ecommerce revenue generated, number of new customers, repeat buying rate, attribute revenue and conversion rate and attributed revenue and conversion rate by marketing channel.
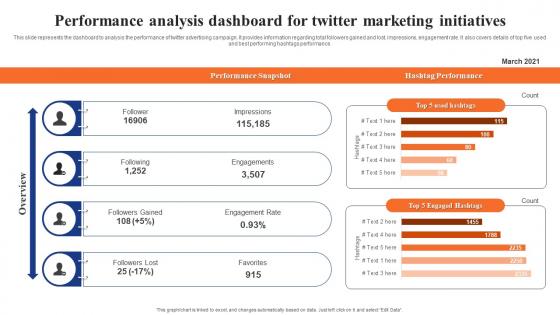
Digital Advertising Using Twitter Performance Analysis Dashboard For Twitter Marketing Topics Pdf
This slide represents the dashboard to analysis the performance of twitter advertising campaign. It provides information regarding total followers gained and lost, impressions, engagement rate. It also covers details of top five used and best performing hashtags performance. Crafting an eye catching presentation has never been more straightforward. Let your presentation shine with this tasteful yet straightforward Digital Advertising Using Twitter Performance Analysis Dashboard For Twitter Marketing Topics Pdf template. It offers a minimalistic and classy look that is great for making a statement. The colors have been employed intelligently to add a bit of playfulness while still remaining professional. Construct the ideal Digital Advertising Using Twitter Performance Analysis Dashboard For Twitter Marketing Topics Pdf that effortlessly grabs the attention of your audience Begin now and be certain to wow your customers This slide represents the dashboard to analysis the performance of twitter advertising campaign. It provides information regarding total followers gained and lost, impressions, engagement rate. It also covers details of top five used and best performing hashtags performance.
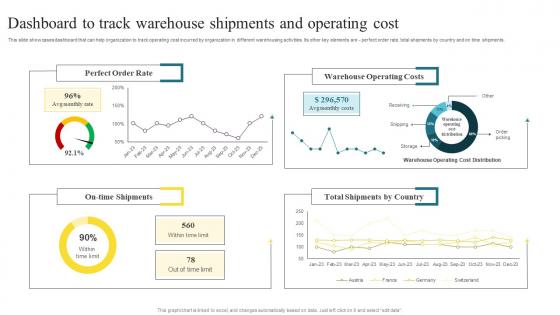
Dashboard To Track Warehouse Methods To Enhance Warehouse Space Utilization Topics Pdf
This slide showcases dashboard that can help organization to track operating cost incurred by organization in different warehousing activities. Its other key elements are perfect order rate, total shipments by country and on time shipments. Do you have to make sure that everyone on your team knows about any specific topic I yes, then you should give Dashboard To Track Warehouse Methods To Enhance Warehouse Space Utilization Topics Pdf a try. Our experts have put a lot of knowledge and effort into creating this impeccable Dashboard To Track Warehouse Methods To Enhance Warehouse Space Utilization Topics Pdf. You can use this template for your upcoming presentations, as the slides are perfect to represent even the tiniest detail. You can download these templates from the Slidegeeks website and these are easy to edit. So grab these today. This slide showcases dashboard that can help organization to track operating cost incurred by organization in different warehousing activities. Its other key elements are - perfect order rate, total shipments by country and on time shipments.
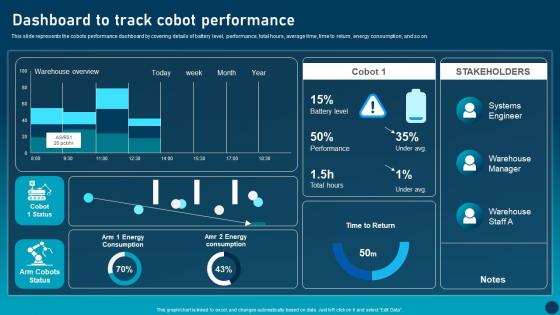
Dashboard To Track Cobot Transforming Industries With Collaborative Robotics Background Pdf
This slide represents the cobots performance dashboard by covering details of battery level, performance, total hours, average time, time to return, energy consumption, and so on. If you are looking for a format to display your unique thoughts, then the professionally designed Dashboard To Track Cobot Transforming Industries With Collaborative Robotics Background Pdf is the one for you. You can use it as a Google Slides template or a PowerPoint template. Incorporate impressive visuals, symbols, images, and other charts. Modify or reorganize the text boxes as you desire. Experiment with shade schemes and font pairings. Alter, share or cooperate with other people on your work. Download Dashboard To Track Cobot Transforming Industries With Collaborative Robotics Background Pdf and find out how to give a successful presentation. Present a perfect display to your team and make your presentation unforgettable. This slide represents the cobots performance dashboard by covering details of battery level, performance, total hours, average time, time to return, energy consumption, and so on.
KPI Dashboard Tracking Seo Major Promotional Analytics Future Trends Guidelines Pdf
This slide covers the KPI dashboard for analyzing SEO metrics such as authority score, organic traffic, organic keywords, paid keywords, ref. Domains, site audit, link building tool, organic traffic, on page SEO checker, backlink audit, etc. Are you searching for a KPI Dashboard Tracking Seo Major Promotional Analytics Future Trends Guidelines Pdf that is uncluttered, straightforward, and original Its easy to edit, and you can change the colors to suit your personal or business branding. For a presentation that expresses how much effort you have put in, this template is ideal With all of its features, including tables, diagrams, statistics, and lists, its perfect for a business plan presentation. Make your ideas more appealing with these professional slides. Download KPI Dashboard Tracking Seo Major Promotional Analytics Future Trends Guidelines Pdf from Slidegeeks today. This slide covers the KPI dashboard for analyzing SEO metrics such as authority score, organic traffic, organic keywords, paid keywords, ref. Domains, site audit, link building tool, organic traffic, on page SEO checker, backlink audit, etc.
Dashboard For Tracking Referral Marketing Tracking Word Mouth Marketing Slides PDF
This slide covers the KPI dashboard for brands to evaluate the performance of referral marketing campaigns. It includes metrics such as referral participation rate, referred customers, referral conversion rate, total revenue generated, etc. Whether you have daily or monthly meetings, a brilliant presentation is necessary. Dashboard For Tracking Referral Marketing Tracking Word Mouth Marketing Slides PDF can be your best option for delivering a presentation. Represent everything in detail using Dashboard For Tracking Referral Marketing Tracking Word Mouth Marketing Slides PDF and make yourself stand out in meetings. The template is versatile and follows a structure that will cater to your requirements. All the templates prepared by Slidegeeks are easy to download and edit. Our research experts have taken care of the corporate themes as well. So, give it a try and see the results. This slide covers the KPI dashboard for brands to evaluate the performance of referral marketing campaigns. It includes metrics such as referral participation rate, referred customers, referral conversion rate, total revenue generated, etc.
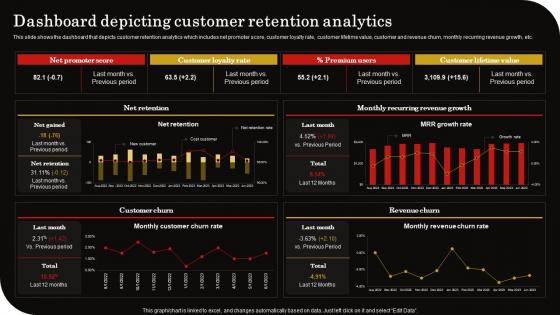
Dashboard Depicting Customer Retention Client Retention Strategy To Reduce Churn Rate Professional Pdf
This slide shows the dashboard that depicts customer retention analytics which includes net promoter score, customer loyalty rate, customer lifetime value, customer and revenue churn, monthly recurring revenue growth, etc. If you are looking for a format to display your unique thoughts, then the professionally designed Dashboard Depicting Customer Retention Client Retention Strategy To Reduce Churn Rate Professional Pdf is the one for you. You can use it as a Google Slides template or a PowerPoint template. Incorporate impressive visuals, symbols, images, and other charts. Modify or reorganize the text boxes as you desire. Experiment with shade schemes and font pairings. Alter, share or cooperate with other people on your work. Download Dashboard Depicting Customer Retention Client Retention Strategy To Reduce Churn Rate Professional Pdf and find out how to give a successful presentation. Present a perfect display to your team and make your presentation unforgettable. This slide shows the dashboard that depicts customer retention analytics which includes net promoter score, customer loyalty rate, customer lifetime value, customer and revenue churn, monthly recurring revenue growth, etc.
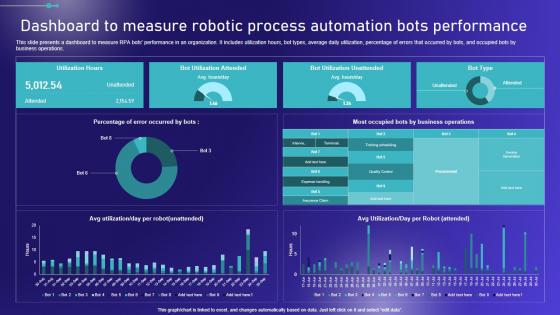
Dashboard To Measure Robotic Process Automation Embracing Robotic Process Diagrams PDF
This slide presents a dashboard to measure RPA bots performance in an organization. It includes utilization hours, bot types, average daily utilization, percentage of errors that occurred by bots, and occupied bots by business operations. If you are looking for a format to display your unique thoughts, then the professionally designed Dashboard To Measure Robotic Process Automation Embracing Robotic Process Diagrams PDF is the one for you. You can use it as a Google Slides template or a PowerPoint template. Incorporate impressive visuals, symbols, images, and other charts. Modify or reorganize the text boxes as you desire. Experiment with shade schemes and font pairings. Alter, share or cooperate with other people on your work. Download Dashboard To Measure Robotic Process Automation Embracing Robotic Process Diagrams PDF and find out how to give a successful presentation. Present a perfect display to your team and make your presentation unforgettable. This slide presents a dashboard to measure RPA bots performance in an organization. It includes utilization hours, bot types, average daily utilization, percentage of errors that occurred by bots, and occupied bots by business operations.
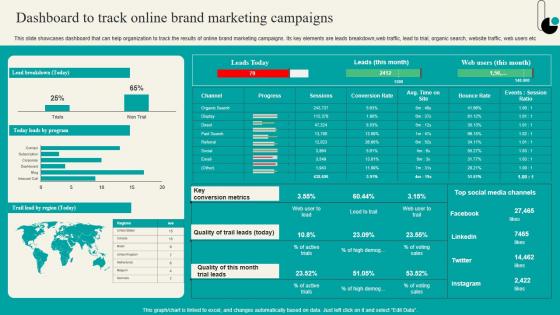
Dashboard To Track Online Brand Marketing Strategic Marketing Plan Themes PDF
This slide showcases dashboard that can help organization to track the results of online brand marketing campaigns. Its key elements are leads breakdown,web traffic, lead to trial, organic search, website traffic, web users etc. If you are looking for a format to display your unique thoughts, then the professionally designed Dashboard To Track Online Brand Marketing Strategic Marketing Plan Themes PDF is the one for you. You can use it as a Google Slides template or a PowerPoint template. Incorporate impressive visuals, symbols, images, and other charts. Modify or reorganize the text boxes as you desire. Experiment with shade schemes and font pairings. Alter, share or cooperate with other people on your work. Download Dashboard To Track Online Brand Marketing Strategic Marketing Plan Themes PDF and find out how to give a successful presentation. Present a perfect display to your team and make your presentation unforgettable. This slide showcases dashboard that can help organization to track the results of online brand marketing campaigns. Its key elements are leads breakdown,web traffic, lead to trial, organic search, website traffic, web users etc.
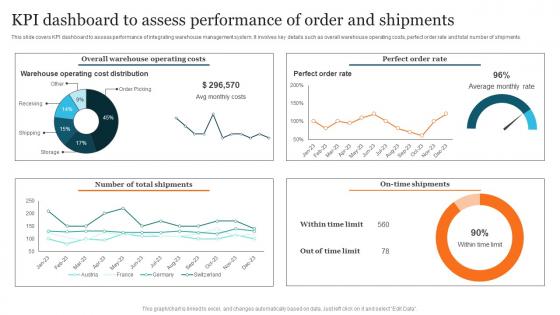
KPI Dashboard Assess Performance Advanced Supply Chain Improvement Strategies Brochure Pdf
This slide covers KPI dashboard to assess performance of integrating warehouse management system. It involves key details such as overall warehouse operating costs, perfect order rate and total number of shipments. If you are looking for a format to display your unique thoughts, then the professionally designed KPI Dashboard Assess Performance Advanced Supply Chain Improvement Strategies Brochure Pdf is the one for you. You can use it as a Google Slides template or a PowerPoint template. Incorporate impressive visuals, symbols, images, and other charts. Modify or reorganize the text boxes as you desire. Experiment with shade schemes and font pairings. Alter, share or cooperate with other people on your work. Download KPI Dashboard Assess Performance Advanced Supply Chain Improvement Strategies Brochure Pdf and find out how to give a successful presentation. Present a perfect display to your team and make your presentation unforgettable. This slide covers KPI dashboard to assess performance of integrating warehouse management system. It involves key details such as overall warehouse operating costs, perfect order rate and total number of shipments.
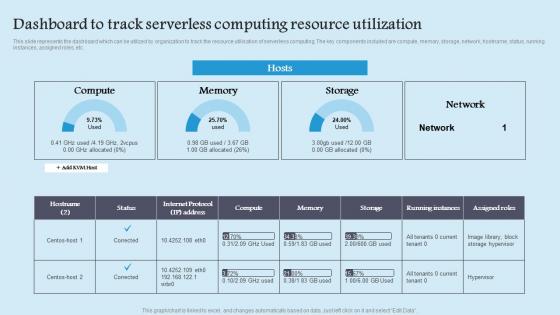
Dashboard To Track Serverless Role Serverless Computing Modern Technology Download Pdf
This slide represents the dashboard which can be utilized by organization to track the resource utilisation of serverless computing. The key components included are compute, memory, storage, network, hostname, status, running instances, assigned roles, etc. Here you can discover an assortment of the finest PowerPoint and Google Slides templates. With these templates, you can create presentations for a variety of purposes while simultaneously providing your audience with an eye catching visual experience. Download Dashboard To Track Serverless Role Serverless Computing Modern Technology Download Pdf to deliver an impeccable presentation. These templates will make your job of preparing presentations much quicker, yet still, maintain a high level of quality. Slidegeeks has experienced researchers who prepare these templates and write high quality content for you. Later on, you can personalize the content by editing the Dashboard To Track Serverless Role Serverless Computing Modern Technology Download Pdf. This slide represents the dashboard which can be utilized by organization to track the resource utilisation of serverless computing. The key components included are compute, memory, storage, network, hostname, status, running instances, assigned roles, etc.
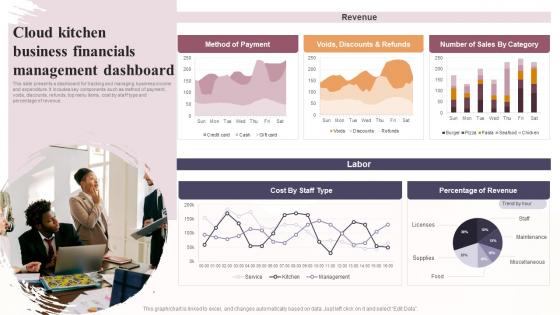
Cloud Kitchen Business Financials Management Dashboard Global Virtual Restaurant Mockup Pdf
This slide presents a dashboard for tracking and managing business income and expenditure. It includes key components such as method of payment, voids, discounts, refunds, top menu items, cost by staff type and percentage of revenue. If you are looking for a format to display your unique thoughts, then the professionally designed Cloud Kitchen Business Financials Management Dashboard Global Virtual Restaurant Mockup Pdf is the one for you. You can use it as a Google Slides template or a PowerPoint template. Incorporate impressive visuals, symbols, images, and other charts. Modify or reorganize the text boxes as you desire. Experiment with shade schemes and font pairings. Alter, share or cooperate with other people on your work. Download Cloud Kitchen Business Financials Management Dashboard Global Virtual Restaurant Mockup Pdf and find out how to give a successful presentation. Present a perfect display to your team and make your presentation unforgettable. This slide presents a dashboard for tracking and managing business income and expenditure. It includes key components such as method of payment, voids, discounts, refunds, top menu items, cost by staff type and percentage of revenue.
Dashboard For Tracking Referral Implementing Social Media Tactics For Boosting WOM Icons Pdf
This slide covers the KPI dashboard for brands to evaluate the performance of referral marketing campaigns. It includes metrics such as referral participation rate, referred customers, referral conversion rate, total revenue generated, etc.Do you have an important presentation coming up Are you looking for something that will make your presentation stand out from the rest Look no further than Dashboard For Tracking Referral Implementing Social Media Tactics For Boosting WOM Icons Pdf. With our professional designs, you can trust that your presentation will pop and make delivering it a smooth process. And with Slidegeeks, you can trust that your presentation will be unique and memorable. So why wait Grab Dashboard For Tracking Referral Implementing Social Media Tactics For Boosting WOM Icons Pdf today and make your presentation stand out from the rest This slide covers the KPI dashboard for brands to evaluate the performance of referral marketing campaigns. It includes metrics such as referral participation rate, referred customers, referral conversion rate, total revenue generated, etc.
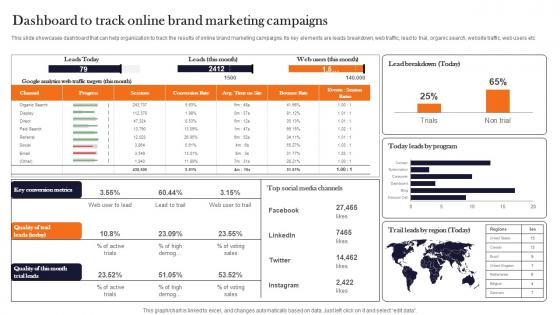
Dashboard To Track Online Brand Marketing Product Advertising And Positioning Graphics Pdf
This slide showcases dashboard that can help organization to track the results of online brand marketing campaigns. Its key elements are leads breakdown, web traffic, lead to trial, organic search, website traffic, web users etc. If you are looking for a format to display your unique thoughts, then the professionally designed Dashboard To Track Online Brand Marketing Product Advertising And Positioning Graphics Pdf is the one for you. You can use it as a Google Slides template or a PowerPoint template. Incorporate impressive visuals, symbols, images, and other charts. Modify or reorganize the text boxes as you desire. Experiment with shade schemes and font pairings. Alter, share or cooperate with other people on your work. Download Dashboard To Track Online Brand Marketing Product Advertising And Positioning Graphics Pdf and find out how to give a successful presentation. Present a perfect display to your team and make your presentation unforgettable. This slide showcases dashboard that can help organization to track the results of online brand marketing campaigns. Its key elements are leads breakdown, web traffic, lead to trial, organic search, website traffic, web users etc.
How To Create Cost Effective Dashboard For Tracking Facebook Post Strategy SS V
The following slide outlines dashboard through which advertisers can manage Facebook post performance and optimize their marketing strategy. Information covered in this slide is related to key metrics such as impressions per post, engagement rate, click-through rate CTR, likes, etc. Do you have an important presentation coming up Are you looking for something that will make your presentation stand out from the rest Look no further than How To Create Cost Effective Dashboard For Tracking Facebook Post Strategy SS V. With our professional designs, you can trust that your presentation will pop and make delivering it a smooth process. And with Slidegeeks, you can trust that your presentation will be unique and memorable. So why wait Grab How To Create Cost Effective Dashboard For Tracking Facebook Post Strategy SS V today and make your presentation stand out from the rest The following slide outlines dashboard through which advertisers can manage Facebook post performance and optimize their marketing strategy. Information covered in this slide is related to key metrics such as impressions per post, engagement rate, click-through rate CTR, likes, etc.
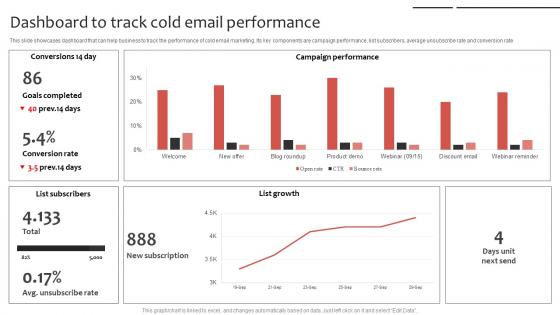
Phone Sales Strategy To Drive Dashboard To Track Cold Email Performance Strategy SS V
This slide showcases dashboard that can help business to track the performance of cold email marketing. Its key components are campaign performance, list subscribers, average unsubscribe rate and conversion rate. Whether you have daily or monthly meetings, a brilliant presentation is necessary. Phone Sales Strategy To Drive Dashboard To Track Cold Email Performance Strategy SS V can be your best option for delivering a presentation. Represent everything in detail using Phone Sales Strategy To Drive Dashboard To Track Cold Email Performance Strategy SS V and make yourself stand out in meetings. The template is versatile and follows a structure that will cater to your requirements. All the templates prepared by Slidegeeks are easy to download and edit. Our research experts have taken care of the corporate themes as well. So, give it a try and see the results. This slide showcases dashboard that can help business to track the performance of cold email marketing. Its key components are campaign performance, list subscribers, average unsubscribe rate and conversion rate
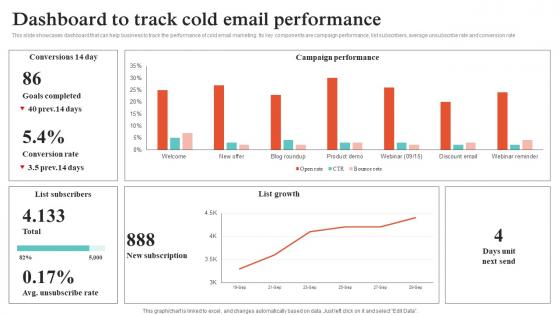
Virtual Sales Strategies Dashboard To Track Cold Email Performance Strategy SS V
This slide showcases dashboard that can help business to track the performance of cold email marketing. Its key components are campaign performance, list subscribers, average unsubscribe rate and conversion rate. Whether you have daily or monthly meetings, a brilliant presentation is necessary. Virtual Sales Strategies Dashboard To Track Cold Email Performance Strategy SS V can be your best option for delivering a presentation. Represent everything in detail using Virtual Sales Strategies Dashboard To Track Cold Email Performance Strategy SS V and make yourself stand out in meetings. The template is versatile and follows a structure that will cater to your requirements. All the templates prepared by Slidegeeks are easy to download and edit. Our research experts have taken care of the corporate themes as well. So, give it a try and see the results. This slide showcases dashboard that can help business to track the performance of cold email marketing. Its key components are campaign performance, list subscribers, average unsubscribe rate and conversion rate.
Facebook Marketing Plan Dashboard For Tracking Facebook Post Performance Strategy SS V
Facebook Marketing Techniques Dashboard For Tracking Facebook Post Strategy SS V
The following slide outlines dashboard through which advertisers can manage Facebook post performance and optimize their marketing strategy. Information covered in this slide is related to key metrics such as impressions per post, engagement rate, click-through rate CTR , likes, etc. If you are looking for a format to display your unique thoughts, then the professionally designed Facebook Marketing Techniques Dashboard For Tracking Facebook Post Strategy SS V is the one for you. You can use it as a Google Slides template or a PowerPoint template. Incorporate impressive visuals, symbols, images, and other charts. Modify or reorganize the text boxes as you desire. Experiment with shade schemes and font pairings. Alter, share or cooperate with other people on your work. Download Facebook Marketing Techniques Dashboard For Tracking Facebook Post Strategy SS V and find out how to give a successful presentation. Present a perfect display to your team and make your presentation unforgettable. The following slide outlines dashboard through which advertisers can manage Facebook post performance and optimize their marketing strategy. Information covered in this slide is related to key metrics such as impressions per post, engagement rate, click-through rate CTR , likes, etc.
Cyber Phishing Attacks Tracking Dashboard Man In The Middle Phishing IT
This slide represents the dashboard to track cyber phishing attacks. The purpose of this slide is to provide a graphical representation of cyber attacks occurred in a specific time span. It also depicts the organizations health risk. Formulating a presentation can take up a lot of effort and time, so the content and message should always be the primary focus. The visuals of the PowerPoint can enhance the presenters message, so our Cyber Phishing Attacks Tracking Dashboard Man In The Middle Phishing IT was created to help save time. Instead of worrying about the design, the presenter can concentrate on the message while our designers work on creating the ideal templates for whatever situation is needed. Slidegeeks has experts for everything from amazing designs to valuable content, we have put everything into Cyber Phishing Attacks Tracking Dashboard Man In The Middle Phishing IT This slide represents the dashboard to track cyber phishing attacks. The purpose of this slide is to provide a graphical representation of cyber attacks occurred in a specific time span. It also depicts the organizations health risk.
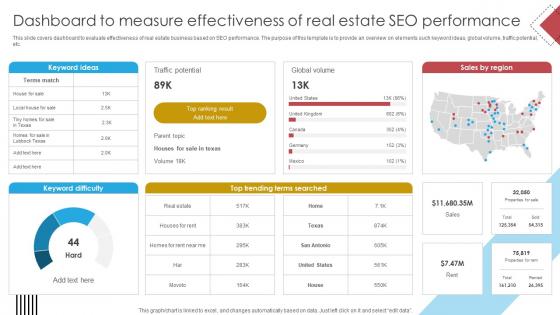
Blueprint For Effective Real Dashboard To Measure Effectiveness Of Real Estate Strategy SS V
This slide covers dashboard to evaluate effectiveness of real estate business based on SEO performance. The purpose of this template is to provide an overview on elements such keyword ideas, global volume, traffic potential, etc. If you are looking for a format to display your unique thoughts, then the professionally designed Blueprint For Effective Real Dashboard To Measure Effectiveness Of Real Estate Strategy SS V is the one for you. You can use it as a Google Slides template or a PowerPoint template. Incorporate impressive visuals, symbols, images, and other charts. Modify or reorganize the text boxes as you desire. Experiment with shade schemes and font pairings. Alter, share or cooperate with other people on your work. Download Blueprint For Effective Real Dashboard To Measure Effectiveness Of Real Estate Strategy SS V and find out how to give a successful presentation. Present a perfect display to your team and make your presentation unforgettable. This slide covers dashboard to evaluate effectiveness of real estate business based on SEO performance. The purpose of this template is to provide an overview on elements such keyword ideas, global volume, traffic potential, etc.
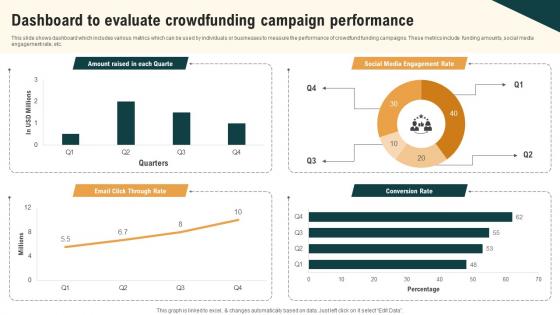
Dashboard To Evaluate Crowdfunding Campaign Real Estate Crowdfunding To Unlock Fin SS V
This slide shows dashboard which includes various metrics which can be used by individuals or businesses to measure the performance of crowdfund funding campaigns. These metrics include funding amounts, social media engagement rate, etc. Find highly impressive Dashboard To Evaluate Crowdfunding Campaign Real Estate Crowdfunding To Unlock Fin SS V on Slidegeeks to deliver a meaningful presentation. You can save an ample amount of time using these presentation templates. No need to worry to prepare everything from scratch because Slidegeeks experts have already done a huge research and work for you. You need to download Dashboard To Evaluate Crowdfunding Campaign Real Estate Crowdfunding To Unlock Fin SS V for your upcoming presentation. All the presentation templates are 100 percent editable and you can change the color and personalize the content accordingly. Download now This slide shows dashboard which includes various metrics which can be used by individuals or businesses to measure the performance of crowdfund funding campaigns. These metrics include funding amounts, social media engagement rate, etc.

Dashboard Analytics Measuring Supply Chain Efficiency Optimizing Retail Operations With Digital DT SS V
This slide represents a supply chain management dashboard measuring the efficiency of supply chain operations after effective digital transformation of retail operations. It includes inventory to sales, inventory turnover, carrying cost of inventory, inventory accuracy, and percentage out of stock items.If you are looking for a format to display your unique thoughts, then the professionally designed Dashboard Analytics Measuring Supply Chain Efficiency Optimizing Retail Operations With Digital DT SS V is the one for you. You can use it as a Google Slides template or a PowerPoint template. Incorporate impressive visuals, symbols, images, and other charts. Modify or reorganize the text boxes as you desire. Experiment with shade schemes and font pairings. Alter, share or cooperate with other people on your work. Download Dashboard Analytics Measuring Supply Chain Efficiency Optimizing Retail Operations With Digital DT SS V and find out how to give a successful presentation. Present a perfect display to your team and make your presentation unforgettable. This slide represents a supply chain management dashboard measuring the efficiency of supply chain operations after effective digital transformation of retail operations. It includes inventory to sales, inventory turnover, carrying cost of inventory, inventory accuracy, and percentage out of stock items.
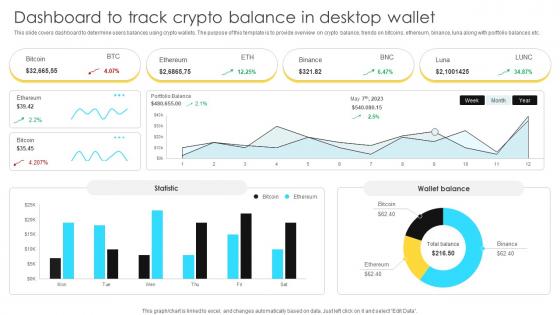
Mastering Blockchain Wallets Dashboard To Track Crypto Balance In Desktop Wallet BCT SS V
This slide covers dashboard to determine users balances using crypto wallets. The purpose of this template is to provide overview on crypto balance, trends on bitcoins, ethereum, binance, luna along with portfolio balances etc. This Mastering Blockchain Wallets Dashboard To Track Crypto Balance In Desktop Wallet BCT SS V is perfect for any presentation, be it in front of clients or colleagues. It is a versatile and stylish solution for organizing your meetings. The Mastering Blockchain Wallets Dashboard To Track Crypto Balance In Desktop Wallet BCT SS V features a modern design for your presentation meetings. The adjustable and customizable slides provide unlimited possibilities for acing up your presentation. Slidegeeks has done all the homework before launching the product for you. So, do not wait, grab the presentation templates today This slide covers dashboard to determine users balances using crypto wallets. The purpose of this template is to provide overview on crypto balance, trends on bitcoins, ethereum, binance, luna along with portfolio balances etc.
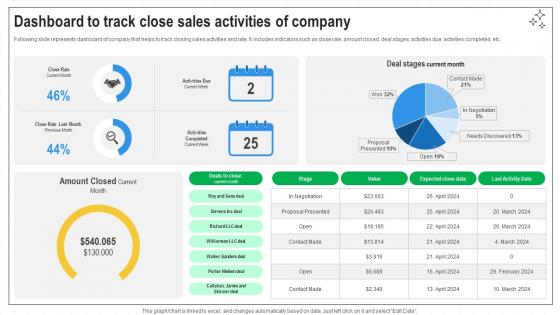
Closing Techniques To Seal Dashboard To Track Close Sales Activities Of Company SA SS V
Following slide represents dashboard of company that helps to track closing sales activities and rate. It includes indicators such as close rate, amount closed, deal stages, activities due, activities completed, etc. If you are looking for a format to display your unique thoughts, then the professionally designed Closing Techniques To Seal Dashboard To Track Close Sales Activities Of Company SA SS V is the one for you. You can use it as a Google Slides template or a PowerPoint template. Incorporate impressive visuals, symbols, images, and other charts. Modify or reorganize the text boxes as you desire. Experiment with shade schemes and font pairings. Alter, share or cooperate with other people on your work. Download Closing Techniques To Seal Dashboard To Track Close Sales Activities Of Company SA SS V and find out how to give a successful presentation. Present a perfect display to your team and make your presentation unforgettable. Following slide represents dashboard of company that helps to track closing sales activities and rate. It includes indicators such as close rate, amount closed, deal stages, activities due, activities completed, etc.
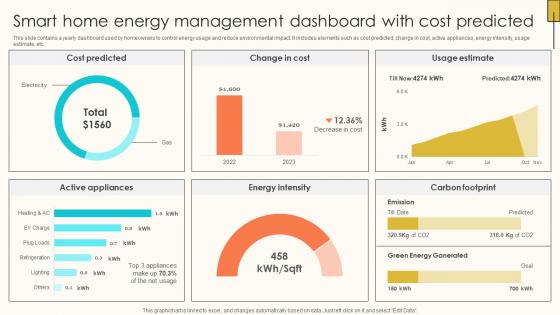
Smart Home Energy Management Dashboard Internet Of Things Solutions To Enhance Energy IoT SS V
This slide contains a yearly dashboard used by homeowners to control energy usage and reduce environmental impact. It includes elements such as cost predicted, change in cost, active appliances, energy intensity, usage estimate, etc. Explore a selection of the finest Smart Home Energy Management Dashboard Internet Of Things Solutions To Enhance Energy IoT SS V here. With a plethora of professionally designed and pre-made slide templates, you can quickly and easily find the right one for your upcoming presentation. You can use our Smart Home Energy Management Dashboard Internet Of Things Solutions To Enhance Energy IoT SS V to effectively convey your message to a wider audience. Slidegeeks has done a lot of research before preparing these presentation templates. The content can be personalized and the slides are highly editable. Grab templates today from Slidegeeks. This slide contains a yearly dashboard used by homeowners to control energy usage and reduce environmental impact. It includes elements such as cost predicted, change in cost, active appliances, energy intensity, usage estimate, etc.
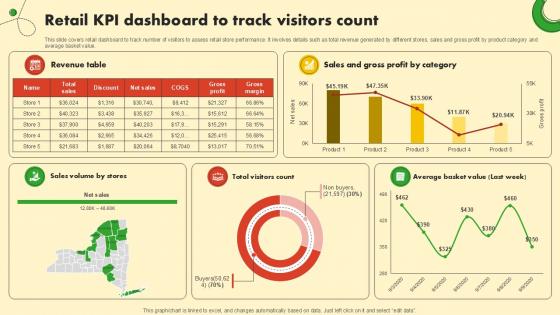
Retail KPI Dashboard To Track Food And Grocery Retail Ppt Slide
This slide covers retail dashboard to track number of visitors to assess retail store performance. It involves details such as total revenue generated by different stores, sales and gross profit by product category and average basket value. This Retail KPI Dashboard To Track Food And Grocery Retail Ppt Slide is perfect for any presentation, be it in front of clients or colleagues. It is a versatile and stylish solution for organizing your meetings. The Retail KPI Dashboard To Track Food And Grocery Retail Ppt Slide features a modern design for your presentation meetings. The adjustable and customizable slides provide unlimited possibilities for acing up your presentation. Slidegeeks has done all the homework before launching the product for you. So, do not wait, grab the presentation templates today This slide covers retail dashboard to track number of visitors to assess retail store performance. It involves details such as total revenue generated by different stores, sales and gross profit by product category and average basket value.
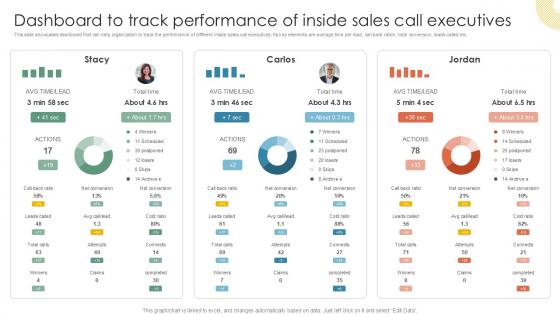
Dashboard To Track Performance Of Inside Vs Outside Sales PPT PowerPoint Strategy SS V
This slide showcases dashboard that can help organization to track the performance of different inside sales call executives. Its key elements are average time per lead, call back ration, total conversion, leads called etc. Do you have an important presentation coming up Are you looking for something that will make your presentation stand out from the rest Look no further than Dashboard To Track Performance Of Inside Vs Outside Sales PPT PowerPoint Strategy SS V. With our professional designs, you can trust that your presentation will pop and make delivering it a smooth process. And with Slidegeeks, you can trust that your presentation will be unique and memorable. So why wait Grab Dashboard To Track Performance Of Inside Vs Outside Sales PPT PowerPoint Strategy SS V today and make your presentation stand out from the rest This slide showcases dashboard that can help organization to track the performance of different inside sales call executives. Its key elements are average time per lead, call back ration, total conversion, leads called etc.
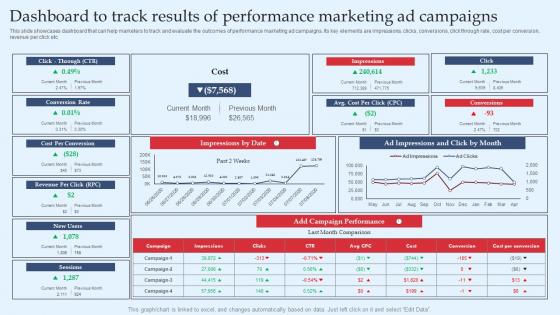
Strategic Performance Marketing Campaign Dashboard To Track Results Of Performance Inspiration Pdf
This slide showcases dashboard that can help marketers to track and evaluate the outcomes of performance marketing ad campaigns. Its key elements are impressions, clicks, conversions, click through rate, cost per conversion, revenue per click etc. Crafting an eye-catching presentation has never been more straightforward. Let your presentation shine with this tasteful yet straightforward Strategic Performance Marketing Campaign Dashboard To Track Results Of Performance Inspiration Pdf template. It offers a minimalistic and classy look that is great for making a statement. The colors have been employed intelligently to add a bit of playfulness while still remaining professional. Construct the ideal Strategic Performance Marketing Campaign Dashboard To Track Results Of Performance Inspiration Pdf that effortlessly grabs the attention of your audience. Begin now and be certain to wow your customers. This slide showcases dashboard that can help marketers to track and evaluate the outcomes of performance marketing ad campaigns. Its key elements are impressions, clicks, conversions, click through rate, cost per conversion, revenue per click etc.
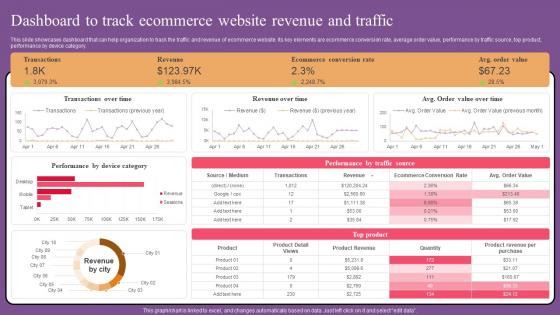
Dashboard Track Ecommerce Website Optimization To Improve Product Sale Professional Pdf
This slide showcases dashboard that can help organization to track the traffic and revenue of ecommerce website. Its key elements are ecommerce conversion rate, average order value, performance by traffic source, top product, performance by device category. Find highly impressive Dashboard Track Ecommerce Website Optimization To Improve Product Sale Professional Pdf on Slidegeeks to deliver a meaningful presentation. You can save an ample amount of time using these presentation templates. No need to worry to prepare everything from scratch because Slidegeeks experts have already done a huge research and work for you. You need to download Dashboard Track Ecommerce Website Optimization To Improve Product Sale Professional Pdf for your upcoming presentation. All the presentation templates are 100 percent editable and you can change the color and personalize the content accordingly. Download now This slide showcases dashboard that can help organization to track the traffic and revenue of ecommerce website. Its key elements are ecommerce conversion rate, average order value, performance by traffic source, top product, performance by device category.
Dashboard For Tracking Ambassador Techniques For Generating Brand Awareness Graphics Pdf
This slide covers the KPI dashboard for companies to evaluate the performance of ambassador marketing campaigns. It includes metrics such as the number of brand ambassadors, the total number of shares, clicks, CPS, revenue, commissions, etc. Do you have an important presentation coming up Are you looking for something that will make your presentation stand out from the rest Look no further than Dashboard For Tracking Ambassador Techniques For Generating Brand Awareness Graphics Pdf. With our professional designs, you can trust that your presentation will pop and make delivering it a smooth process. And with Slidegeeks, you can trust that your presentation will be unique and memorable. So why wait Grab Dashboard For Tracking Ambassador Techniques For Generating Brand Awareness Graphics Pdf today and make your presentation stand out from the rest This slide covers the KPI dashboard for companies to evaluate the performance of ambassador marketing campaigns. It includes metrics such as the number of brand ambassadors, the total number of shares, clicks, CPS, revenue, commissions, etc.
Dashboard For Tracking Ambassador Marketing Tracking Word Mouth Marketing Summary PDF
This slide covers the KPI dashboard for companies to evaluate the performance of ambassador marketing campaigns. It includes metrics such as the number of brand ambassadors, the total number of shares, clicks, CPS, revenue, commissions, etc. Do you have an important presentation coming up Are you looking for something that will make your presentation stand out from the rest Look no further than Dashboard For Tracking Ambassador Marketing Tracking Word Mouth Marketing Summary PDF. With our professional designs, you can trust that your presentation will pop and make delivering it a smooth process. And with Slidegeeks, you can trust that your presentation will be unique and memorable. So why wait Grab Dashboard For Tracking Ambassador Marketing Tracking Word Mouth Marketing Summary PDF today and make your presentation stand out from the rest This slide covers the KPI dashboard for companies to evaluate the performance of ambassador marketing campaigns. It includes metrics such as the number of brand ambassadors, the total number of shares, clicks, CPS, revenue, commissions, etc.
Managing It Services Spending Tracking Dashboard Technological Innovation Playbook Designs Pdf
This slide provides information regarding the management of the digital services performance and IT spending tracking dashboard in terms of ROI, spend vs. budget, IT costs software, hardware, personnel and goals, IT spending in terms of revenues, etc. Do you have an important presentation coming up Are you looking for something that will make your presentation stand out from the rest Look no further than Managing It Services Spending Tracking Dashboard Technological Innovation Playbook Designs Pdf. With our professional designs, you can trust that your presentation will pop and make delivering it a smooth process. And with Slidegeeks, you can trust that your presentation will be unique and memorable. So why wait Grab Managing It Services Spending Tracking Dashboard Technological Innovation Playbook Designs Pdf today and make your presentation stand out from the rest This slide provides information regarding the management of the digital services performance and IT spending tracking dashboard in terms of ROI, spend vs. budget, IT costs software, hardware, personnel and goals, IT spending in terms of revenues, etc.
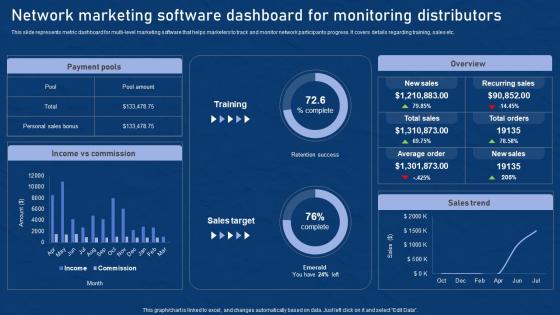
Network Marketing Software Dashboard Effective Network Marketing Promotion Tactics Themes Pdf
This slide represents metric dashboard for multi level marketing software that helps marketers to track and monitor network participants progress. It covers details regarding training, sales etc. If you are looking for a format to display your unique thoughts, then the professionally designed Network Marketing Software Dashboard Effective Network Marketing Promotion Tactics Themes Pdf is the one for you. You can use it as a Google Slides template or a PowerPoint template. Incorporate impressive visuals, symbols, images, and other charts. Modify or reorganize the text boxes as you desire. Experiment with shade schemes and font pairings. Alter, share or cooperate with other people on your work. Download Network Marketing Software Dashboard Effective Network Marketing Promotion Tactics Themes Pdf and find out how to give a successful presentation. Present a perfect display to your team and make your presentation unforgettable. This slide represents metric dashboard for multi level marketing software that helps marketers to track and monitor network participants progress. It covers details regarding training, sales etc.
Dashboard To Track Online Brand Marketing Campaigns Launching New Product Brand Icons Pdf
This slide showcases dashboard that can help organization to track the results of online brand marketing campaigns. Its key elements are leads breakdown,web traffic, lead to trial, organic search, website traffic, web users etc If you are looking for a format to display your unique thoughts, then the professionally designed Dashboard To Track Online Brand Marketing Campaigns Launching New Product Brand Icons Pdf is the one for you. You can use it as a Google Slides template or a PowerPoint template. Incorporate impressive visuals, symbols, images, and other charts. Modify or reorganize the text boxes as you desire. Experiment with shade schemes and font pairings. Alter, share or cooperate with other people on your work. Download Dashboard To Track Online Brand Marketing Campaigns Launching New Product Brand Icons Pdf and find out how to give a successful presentation. Present a perfect display to your team and make your presentation unforgettable. This slide showcases dashboard that can help organization to track the results of online brand marketing campaigns. Its key elements are leads breakdown,web traffic, lead to trial, organic search, website traffic, web users etc
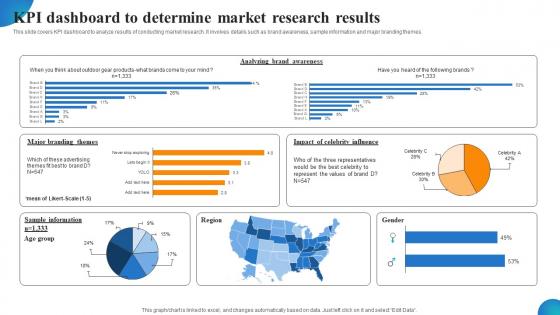
KPI Dashboard To Determine Market Research Results MDSS For Enhanced Ideas Pdf
This slide covers KPI dashboard to analyze results of conducting market research. It involves details such as brand awareness, sample information and major branding themes. If you are looking for a format to display your unique thoughts, then the professionally designed KPI Dashboard To Determine Market Research Results MDSS For Enhanced Ideas Pdf is the one for you. You can use it as a Google Slides template or a PowerPoint template. Incorporate impressive visuals, symbols, images, and other charts. Modify or reorganize the text boxes as you desire. Experiment with shade schemes and font pairings. Alter, share or cooperate with other people on your work. Download KPI Dashboard To Determine Market Research Results MDSS For Enhanced Ideas Pdf and find out how to give a successful presentation. Present a perfect display to your team and make your presentation unforgettable. This slide covers KPI dashboard to analyze results of conducting market research. It involves details such as brand awareness, sample information and major branding themes.
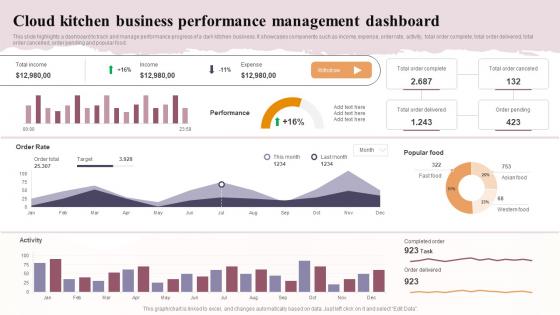
Cloud Kitchen Business Performance Management Dashboard Global Virtual Restaurant Structure Pdf
This slide highlights a dashboard to track and manage performance progress of a dark kitchen business. It showcases components such as income, expense, order rate, activity, total order complete, total order delivered, total order cancelled, order pending and popular food. Crafting an eye-catching presentation has never been more straightforward. Let your presentation shine with this tasteful yet straightforward Cloud Kitchen Business Performance Management Dashboard Global Virtual Restaurant Structure Pdf template. It offers a minimalistic and classy look that is great for making a statement. The colors have been employed intelligently to add a bit of playfulness while still remaining professional. Construct the ideal Cloud Kitchen Business Performance Management Dashboard Global Virtual Restaurant Structure Pdf that effortlessly grabs the attention of your audience. Begin now and be certain to wow your customers. This slide highlights a dashboard to track and manage performance progress of a dark kitchen business. It showcases components such as income, expense, order rate, activity, total order complete, total order delivered, total order cancelled, order pending and popular food.
Dashboard Tracking Ambassador Implementing Social Media Tactics For Boosting WOM Demonstration Pdf
This slide covers the KPI dashboard for companies to evaluate the performance of ambassador marketing campaigns. It includes metrics such as the number of brand ambassadors, the total number of shares, clicks, CPS, revenue, commissions, etc.Find highly impressive Dashboard Tracking Ambassador Implementing Social Media Tactics For Boosting WOM Demonstration Pdf on Slidegeeks to deliver a meaningful presentation. You can save an ample amount of time using these presentation templates. No need to worry to prepare everything from scratch because Slidegeeks experts have already done a huge research and work for you. You need to download Dashboard Tracking Ambassador Implementing Social Media Tactics For Boosting WOM Demonstration Pdf for your upcoming presentation. All the presentation templates are 100 percent editable and you can change the color and personalize the content accordingly. Download now This slide covers the KPI dashboard for companies to evaluate the performance of ambassador marketing campaigns. It includes metrics such as the number of brand ambassadors, the total number of shares, clicks, CPS, revenue, commissions, etc.

Power Management Dashboard With Energy Consumption AIOT Applications For Various Industries IoT SS V
The purpose of this slide is to showcase power management dashboard which covers various metrics. The metrics mentioned in slide are average power by device, energy consumption, voltage and frequency by various devices, etc. Do you have to make sure that everyone on your team knows about any specific topic I yes, then you should give Power Management Dashboard With Energy Consumption AIOT Applications For Various Industries IoT SS V a try. Our experts have put a lot of knowledge and effort into creating this impeccable Power Management Dashboard With Energy Consumption AIOT Applications For Various Industries IoT SS V. You can use this template for your upcoming presentations, as the slides are perfect to represent even the tiniest detail. You can download these templates from the Slidegeeks website and these are easy to edit. So grab these today The purpose of this slide is to showcase power management dashboard which covers various metrics. The metrics mentioned in slide are average power by device, energy consumption, voltage and frequency by various devices, etc.
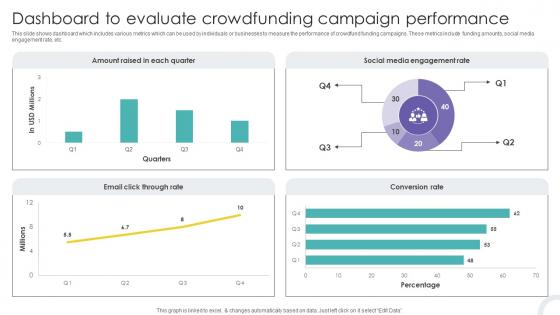
Dashboard To Evaluate Crowdfunding Campaign Crowdfunding Strategies To Raise Funds Fin SS V
This slide shows dashboard which includes various metrics which can be used by individuals or businesses to measure the performance of crowdfund funding campaigns. These metrics include funding amounts, social media engagement rate, etc. Find highly impressive Dashboard To Evaluate Crowdfunding Campaign Crowdfunding Strategies To Raise Funds Fin SS V on Slidegeeks to deliver a meaningful presentation. You can save an ample amount of time using these presentation templates. No need to worry to prepare everything from scratch because Slidegeeks experts have already done a huge research and work for you. You need to download Dashboard To Evaluate Crowdfunding Campaign Crowdfunding Strategies To Raise Funds Fin SS V for your upcoming presentation. All the presentation templates are 100 percent editable and you can change the color and personalize the content accordingly. Download now This slide shows dashboard which includes various metrics which can be used by individuals or businesses to measure the performance of crowdfund funding campaigns. These metrics include funding amounts, social media engagement rate, etc.
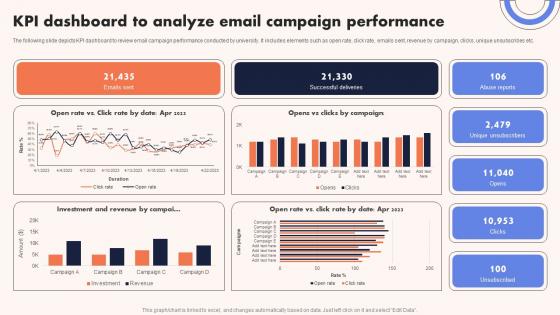
University Marketing Guide KPI Dashboard To Analyze Email Campaign Performance Strategy SS V
The following slide depicts KPI dashboard to review email campaign performance conducted by university. It includes elements such as open rate, click rate, emails sent, revenue by campaign, clicks, unique unsubscribes etc. Are you searching for a University Marketing Guide KPI Dashboard To Analyze Email Campaign Performance Strategy SS V that is uncluttered, straightforward, and original Its easy to edit, and you can change the colors to suit your personal or business branding. For a presentation that expresses how much effort you have put in, this template is ideal With all of its features, including tables, diagrams, statistics, and lists, its perfect for a business plan presentation. Make your ideas more appealing with these professional slides. Download University Marketing Guide KPI Dashboard To Analyze Email Campaign Performance Strategy SS V from Slidegeeks today. The following slide depicts KPI dashboard to review email campaign performance conducted by university. It includes elements such as open rate, click rate, emails sent, revenue by campaign, clicks, unique unsubscribes etc.
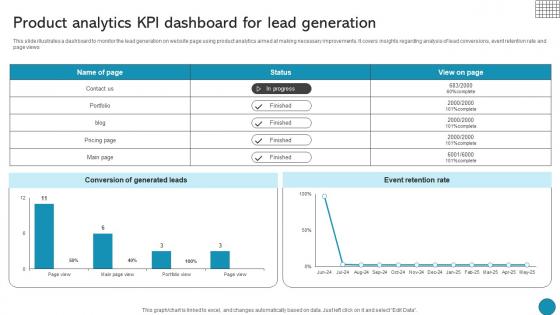
Product Analytics Kpi Dashboard For Lead Generation Driving Business Success Integrating Product
This slide illustrates a dashboard to monitor the lead generation on website page using product analytics aimed at making necessary improvements. It covers insights regarding analysis of lead conversions, event retention rate and page views Do you have to make sure that everyone on your team knows about any specific topic I yes, then you should give Product Analytics Kpi Dashboard For Lead Generation Driving Business Success Integrating Product a try. Our experts have put a lot of knowledge and effort into creating this impeccable Product Analytics Kpi Dashboard For Lead Generation Driving Business Success Integrating Product. You can use this template for your upcoming presentations, as the slides are perfect to represent even the tiniest detail. You can download these templates from the Slidegeeks website and these are easy to edit. So grab these today This slide illustrates a dashboard to monitor the lead generation on website page using product analytics aimed at making necessary improvements. It covers insights regarding analysis of lead conversions, event retention rate and page views
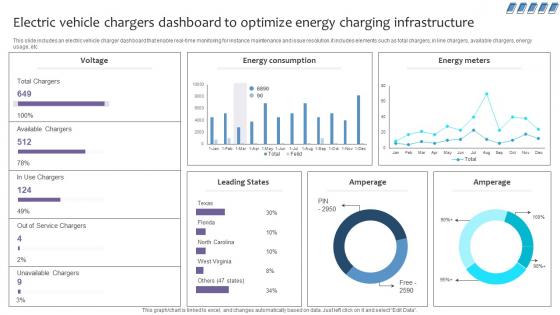
Empowering The Future Electric Vehicle Chargers Dashboard To Optimize Energy IoT SS V
This slide includes an electric vehicle charger dashboard that enable real-time monitoring for instance maintenance and issue resolution.it includes elements such as total chargers, in line chargers, available chargers, energy usage, etc. If you are looking for a format to display your unique thoughts, then the professionally designed Empowering The Future Electric Vehicle Chargers Dashboard To Optimize Energy IoT SS V is the one for you. You can use it as a Google Slides template or a PowerPoint template. Incorporate impressive visuals, symbols, images, and other charts. Modify or reorganize the text boxes as you desire. Experiment with shade schemes and font pairings. Alter, share or cooperate with other people on your work. Download Empowering The Future Electric Vehicle Chargers Dashboard To Optimize Energy IoT SS V and find out how to give a successful presentation. Present a perfect display to your team and make your presentation unforgettable. This slide includes an electric vehicle charger dashboard that enable real-time monitoring for instance maintenance and issue resolution.it includes elements such as total chargers, in line chargers, available chargers, energy usage, etc.
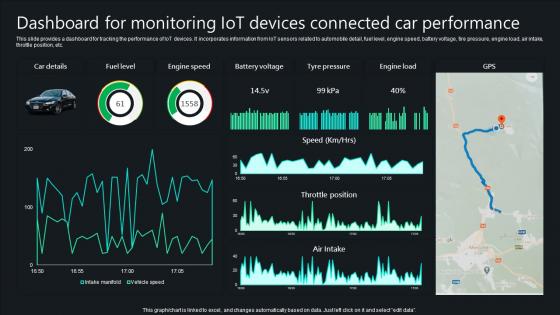
Unlocking Potential IoTs Application Dashboard For Monitoring IoT Devices Connected Car IoT SS V
This slide provides a dashboard for tracking the performance of IoT devices. It incorporates information from IoT sensors related to automobile detail, fuel level, engine speed, battery voltage, tire pressure, engine load, air intake, throttle position, etc. Crafting an eye-catching presentation has never been more straightforward. Let your presentation shine with this tasteful yet straightforward Unlocking Potential IoTs Application Dashboard For Monitoring IoT Devices Connected Car IoT SS V template. It offers a minimalistic and classy look that is great for making a statement. The colors have been employed intelligently to add a bit of playfulness while still remaining professional. Construct the ideal Unlocking Potential IoTs Application Dashboard For Monitoring IoT Devices Connected Car IoT SS V that effortlessly grabs the attention of your audience Begin now and be certain to wow your customers This slide provides a dashboard for tracking the performance of IoT devices. It incorporates information from IoT sensors related to automobile detail, fuel level, engine speed, battery voltage, tire pressure, engine load, air intake, throttle position, etc.
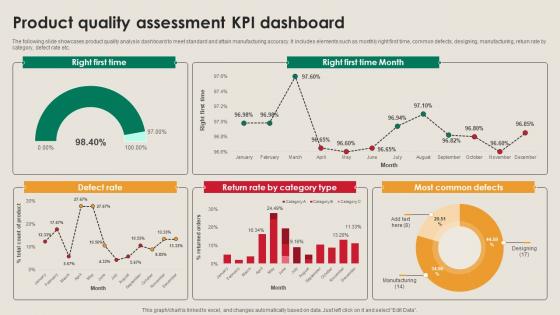
Product Quality Assessment KPI Dashboard Manufacturing Strategy Driving Industry 4 0
The following slide showcases product quality analysis dashboard to meet standard and attain manufacturing accuracy. It includes elements such as monthly right first time, common defects, designing, manufacturing, return rate by category, defect rate etc. If you are looking for a format to display your unique thoughts, then the professionally designed Product Quality Assessment KPI Dashboard Manufacturing Strategy Driving Industry 4 0 is the one for you. You can use it as a Google Slides template or a PowerPoint template. Incorporate impressive visuals, symbols, images, and other charts. Modify or reorganize the text boxes as you desire. Experiment with shade schemes and font pairings. Alter, share or cooperate with other people on your work. Download Product Quality Assessment KPI Dashboard Manufacturing Strategy Driving Industry 4 0 and find out how to give a successful presentation. Present a perfect display to your team and make your presentation unforgettable. The following slide showcases product quality analysis dashboard to meet standard and attain manufacturing accuracy. It includes elements such as monthly right first time, common defects, designing, manufacturing, return rate by category, defect rate etc.
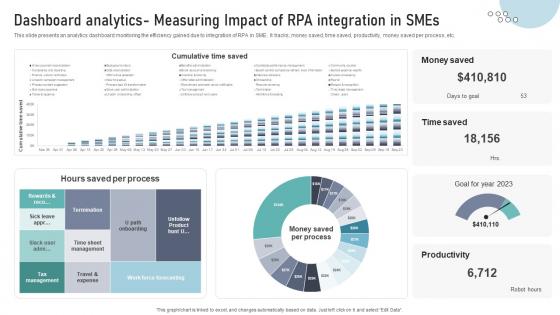
Dashboard Analytics Measuring Impact Of RPA Integration In SMEs DT SS V
This slide presents an analytics dashboard monitoring the efficiency gained due to integration of RPA in SME. It tracks, money saved, time saved, productivity, money saved per process, etc.Formulating a presentation can take up a lot of effort and time, so the content and message should always be the primary focus. The visuals of the PowerPoint can enhance the presenters message, so our Dashboard Analytics Measuring Impact Of RPA Integration In SMEs DT SS V was created to help save time. Instead of worrying about the design, the presenter can concentrate on the message while our designers work on creating the ideal templates for whatever situation is needed. Slidegeeks has experts for everything from amazing designs to valuable content, we have put everything into Dashboard Analytics Measuring Impact Of RPA Integration In SMEs DT SS V. This slide presents an analytics dashboard monitoring the efficiency gained due to integration of RPA in SME. It tracks, money saved, time saved, productivity, money saved per process, etc.
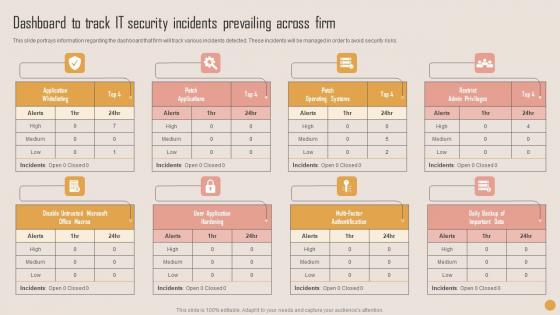
Dashboard To Track IT Security Playbook For Strategic Actions To Improve IT Performance Summary Pdf
This slide portrays information regarding the dashboard that firm will track various incidents detected. These incidents will be managed in order to avoid security risks. If your project calls for a presentation, then Slidegeeks is your go to partner because we have professionally designed, easy to edit templates that are perfect for any presentation. After downloading, you can easily edit Dashboard To Track IT Security Playbook For Strategic Actions To Improve IT Performance Summary Pdf and make the changes accordingly. You can rearrange slides or fill them with different images. Check out all the handy templates This slide portrays information regarding the dashboard that firm will track various incidents detected. These incidents will be managed in order to avoid security risks.
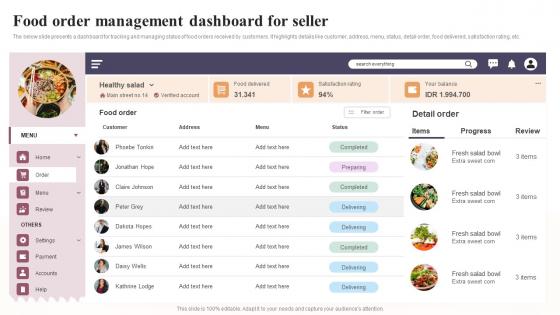
Food Order Management Dashboard For Seller Global Virtual Restaurant Formats Pdf
The below slide presents a dashboard for tracking and managing status of food orders received by customers. It highlights details like customer, address, menu, status, detail order, food delivered, satisfaction rating, etc. Slidegeeks has constructed Food Order Management Dashboard For Seller Global Virtual Restaurant Formats Pdf after conducting extensive research and examination. These presentation templates are constantly being generated and modified based on user preferences and critiques from editors. Here, you will find the most attractive templates for a range of purposes while taking into account ratings and remarks from users regarding the content. This is an excellent jumping-off point to explore our content and will give new users an insight into our top-notch PowerPoint Templates. The below slide presents a dashboard for tracking and managing status of food orders received by customers. It highlights details like customer, address, menu, status, detail order, food delivered, satisfaction rating, etc.
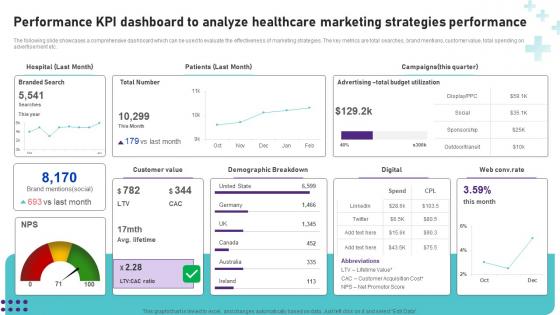
Performance KPI Dashboard To Analyze Healthcare Operational Areas Healthcare Rules PDF
Do you know about Slidesgeeks Performance KPI Dashboard To Analyze Healthcare Operational Areas Healthcare Rules PDF These are perfect for delivering any kind od presentation. Using it, create PowerPoint presentations that communicate your ideas and engage audiences. Save time and effort by using our pre-designed presentation templates that are perfect for a wide range of topic. Our vast selection of designs covers a range of styles, from creative to business, and are all highly customizable and easy to edit. Download as a PowerPoint template or use them as Google Slides themes. The following slide showcases a comprehensive dashboard which can be used to evaluate the effectiveness of marketing strategies. The key metrics are total searches, brand mentions, customer value, total spending on advertisement etc.
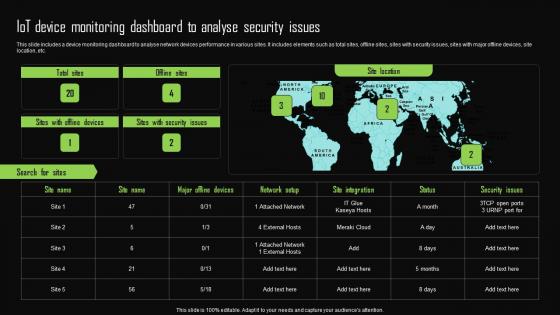
Iot Device Monitoring Dashboard To Analyse Security Issues Iot Device Management Template Pdf
This slide includes a device monitoring dashboard to analyse network devices performance in various sites. It includes elements such as total sites, offline sites, sites with security issues, sites with major offline devices, site location, etc. This Iot Device Monitoring Dashboard To Analyse Security Issues Iot Device Management Template Pdf from Slidegeeks makes it easy to present information on your topic with precision. It provides customization options, so you can make changes to the colors, design, graphics, or any other component to create a unique layout. It is also available for immediate download, so you can begin using it right away. Slidegeeks has done good research to ensure that you have everything you need to make your presentation stand out. Make a name out there for a brilliant performance. This slide includes a device monitoring dashboard to analyse network devices performance in various sites. It includes elements such as total sites, offline sites, sites with security issues, sites with major offline devices, site location, etc.
Learning And Improvement KPI Dashboard Ppt Powerpoint Presentation Complete Deck With Slides
This Learning And Improvement KPI Dashboard Ppt Powerpoint Presentation Complete Deck With Slides acts as backup support for your ideas, vision, thoughts, etc. Use it to present a thorough understanding of the topic. This PPT slideshow can be utilized for both in-house and outside presentations depending upon your needs and business demands. Entailing fourteen slides with a consistent design and theme, this template will make a solid use case. As it is intuitively designed, it suits every business vertical and industry. All you have to do is make a few tweaks in the content or any other component to design unique presentations. The biggest advantage of this complete deck is that it can be personalized multiple times once downloaded. The color, design, shapes, and other elements are free to modify to add personal touches. You can also insert your logo design in this PPT layout. Therefore a well-thought and crafted presentation can be delivered with ease and precision by downloading this Learning And Improvement KPI Dashboard Ppt Powerpoint Presentation Complete Deck With Slides PPT slideshow. Our Learning And Improvement KPI Dashboard Ppt Powerpoint Presentation Complete Deck With Slides are topically designed to provide an attractive backdrop to any subject. Use them to look like a presentation pro.
Data Breach Prevention Status Tracking Dashboard Data Breach Prevention Information Pdf
This slide represents the critical cyber security performance indicators for the organization. The key components include application health, encryption status, license consumption, windows defender, etc. Crafting an eye-catching presentation has never been more straightforward. Let your presentation shine with this tasteful yet straightforward Data Breach Prevention Status Tracking Dashboard Data Breach Prevention Information Pdf template. It offers a minimalistic and classy look that is great for making a statement. The colors have been employed intelligently to add a bit of playfulness while still remaining professional. Construct the ideal Data Breach Prevention Status Tracking Dashboard Data Breach Prevention Information Pdf that effortlessly grabs the attention of your audience Begin now and be certain to wow your customers This slide represents the critical cyber security performance indicators for the organization. The key components include application health, encryption status, license consumption, windows defender, etc.
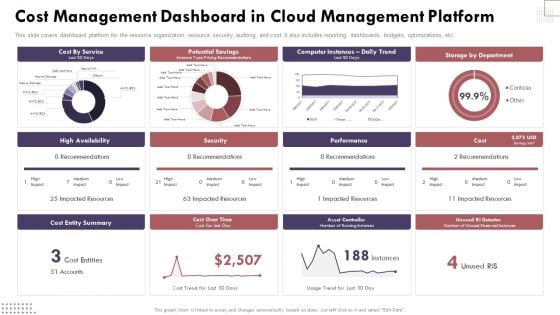
Cost Management Dashboard In Cloud Management Platform Cloud Computing Complexities And Solutions Ideas PDF
This slide covers dashboard platform for the resource organization, resource security, auditing, and cost. It also includes reporting, dashboards, budgets, optimizations, etc. Presenting this PowerPoint presentation, titled Cost Management Dashboard In Cloud Management Platform Cloud Computing Complexities And Solutions Ideas PDF, with topics curated by our researchers after extensive research. This editable presentation is available for immediate download and provides attractive features when used. Download now and captivate your audience. Presenting this Cost Management Dashboard In Cloud Management Platform Cloud Computing Complexities And Solutions Ideas PDF. Our researchers have carefully researched and created these slides with all aspects taken into consideration. This is a completely customizable Cost Management Dashboard In Cloud Management Platform Cloud Computing Complexities And Solutions Ideas PDF that is available for immediate downloading. Download now and make an impact on your audience. Highlight the attractive features available with our PPTs.
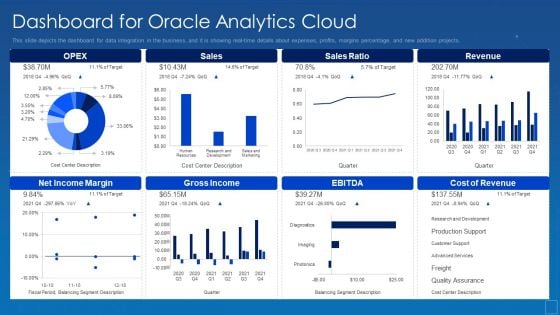
Oracle Cloud Data Analytics Administration IT Dashboard For Oracle Analytics Cloud Sample PDF
This slide depicts the dashboard for data integration in the business, and it is showing real-time details about expenses, profits, margins percentage, and new addition projects. Deliver an awe inspiring pitch with this creative oracle cloud data analytics administration it dashboard for oracle analytics cloud sample pdf bundle. Topics like dashboard for oracle analytics cloud can be discussed with this completely editable template. It is available for immediate download depending on the needs and requirements of the user.
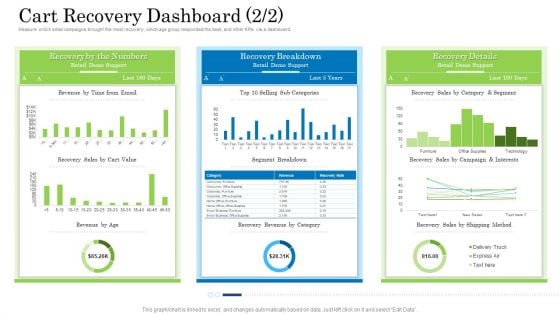
Customer Behavioral Data And Analytics Cart Recovery Dashboard Value Inspiration PDF
Measure which email campaigns brought the most recovery, which age group responded the best, and other KPIs via a dashboard. Deliver and pitch your topic in the best possible manner with this customer behavioral data and analytics cart recovery dashboard value inspiration pdf. Use them to share invaluable insights on cart recovery dashboard and impress your audience. This template can be altered and modified as per your expectations. So, grab it now.
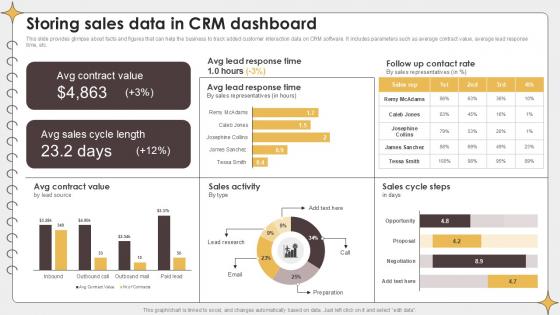
Storing Sales Data In CRM Dashboard Planning Outreach Campaigns PPT Slide
This slide provides glimpse about facts and figures that can help the business to track added customer interaction data on CRM software. It includes parameters such as average contract value, average lead response time, etc. This Storing Sales Data In CRM Dashboard Planning Outreach Campaigns PPT Slide is perfect for any presentation, be it in front of clients or colleagues. It is a versatile and stylish solution for organizing your meetings. The Storing Sales Data In CRM Dashboard Planning Outreach Campaigns PPT Slide features a modern design for your presentation meetings. The adjustable and customizable slides provide unlimited possibilities for acing up your presentation. Slidegeeks has done all the homework before launching the product for you. So, do not wait, grab the presentation templates today This slide provides glimpse about facts and figures that can help the business to track added customer interaction data on CRM software. It includes parameters such as average contract value, average lead response time, etc.
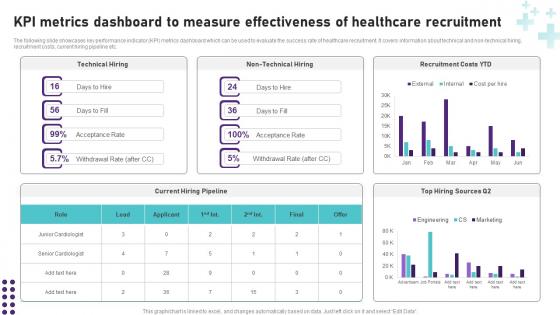
KPI Metrics Dashboard To Measure Healthcare Operational Areas Healthcare Brochure PDF
Retrieve professionally designed KPI Metrics Dashboard To Measure Healthcare Operational Areas Healthcare Brochure PDF to effectively convey your message and captivate your listeners. Save time by selecting pre-made slideshows that are appropriate for various topics, from business to educational purposes. These themes come in many different styles, from creative to corporate, and all of them are easily adjustable and can be edited quickly. Access them as PowerPoint templates or as Google Slides themes. You do not have to go on a hunt for the perfect presentation because Slidegeeks got you covered from everywhere. The following slide showcases key performance indicator KPI metrics dashboard which can be used to evaluate the success rate of healthcare recruitment. It covers information about technical and non-technical hiring, recruitment costs, current hiring pipeline etc.
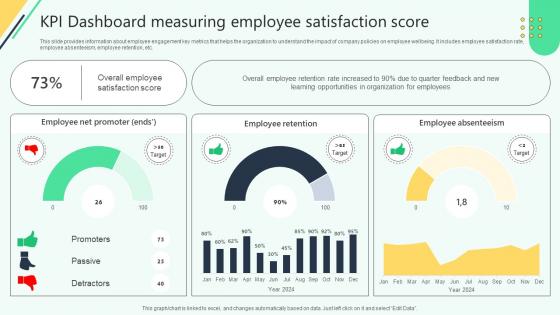
Kpi Dashboard Measuring Employee Satisfaction Score Analysing Hr Data For Effective Decision Making
This slide provides information about employee engagement key metrics that helps the organization to understand the impact of company policies on employee wellbeing. It includes employee satisfaction rate, employee absenteeism, employee retention, etc. Create an editable Kpi Dashboard Measuring Employee Satisfaction Score Analysing Hr Data For Effective Decision Making that communicates your idea and engages your audience. Whether you are presenting a business or an educational presentation, pre-designed presentation templates help save time. Kpi Dashboard Measuring Employee Satisfaction Score Analysing Hr Data For Effective Decision Making is highly customizable and very easy to edit, covering many different styles from creative to business presentations. Slidegeeks has creative team members who have crafted amazing templates. So, go and get them without any delay. This slide provides information about employee engagement key metrics that helps the organization to understand the impact of company policies on employee wellbeing. It includes employee satisfaction rate, employee absenteeism, employee retention, etc.
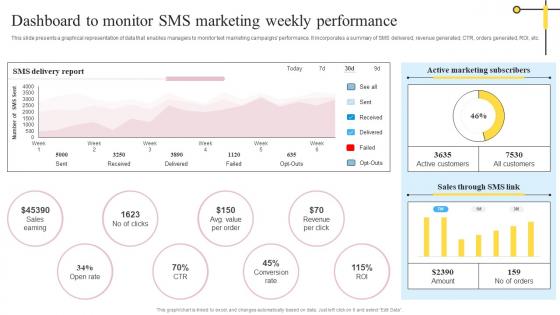
Dashboard To Monitor SMS Marketing Weekly Definitive Guide On Mass Advertising Inspiration Pdf
This slide presents a graphical representation of data that enables managers to monitor text marketing campaigns performance. It incorporates a summary of SMS delivered, revenue generated, CTR, orders generated, ROI, etc. Get a simple yet stunning designed Dashboard To Monitor SMS Marketing Weekly Definitive Guide On Mass Advertising Inspiration Pdf. It is the best one to establish the tone in your meetings. It is an excellent way to make your presentations highly effective. So, download this PPT today from Slidegeeks and see the positive impacts. Our easy-to-edit Dashboard To Monitor SMS Marketing Weekly Definitive Guide On Mass Advertising Inspiration Pdf can be your go-to option for all upcoming conferences and meetings. So, what are you waiting for Grab this template today. This slide presents a graphical representation of data that enables managers to monitor text marketing campaigns performance. It incorporates a summary of SMS delivered, revenue generated, CTR, orders generated, ROI, etc.


 Continue with Email

 Home
Home


