Data Analytics Icons
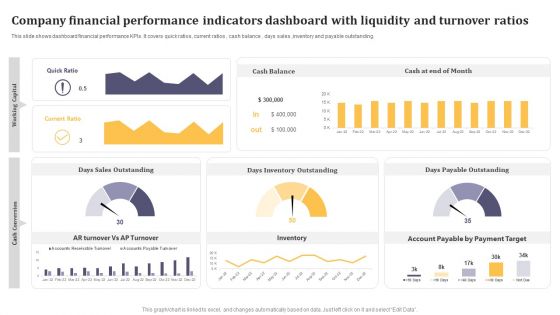
Company Financial Performance Indicators Dashboard With Liquidity And Turnover Ratios Formats PDF
This graph or chart is linked to excel, and changes automatically based on data. Just left click on it and select Edit Data. Pitch your topic with ease and precision using this Company Financial Performance Indicators Dashboard With Liquidity And Turnover Ratios Formats PDF. This layout presents information on Cash Balance, Days Inventory Outstanding, Days Payable Outstanding. It is also available for immediate download and adjustment. So, changes can be made in the color, design, graphics or any other component to create a unique layout.
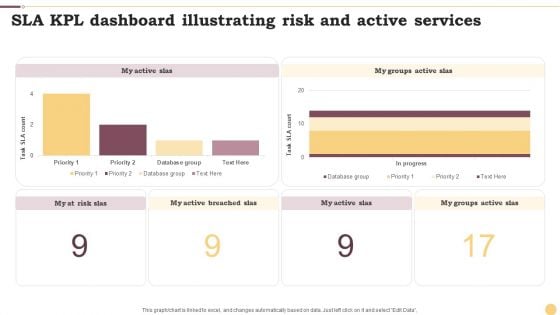
SLA KPL Dashboard Illustrating Risk And Active Services Ppt Portfolio Design Inspiration PDF
This graph or chart is linked to excel, and changes automatically based on data. Just left click on it and select Edit Data. Pitch your topic with ease and precision using this SLA KPL Dashboard Illustrating Risk And Active Services Ppt Portfolio Design Inspiration PDF. This layout presents information on My Active SLAs, Database Group, Priority. It is also available for immediate download and adjustment. So, changes can be made in the color, design, graphics or any other component to create a unique layout.
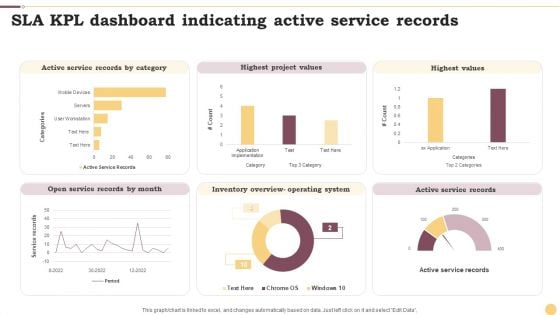
SLA KPL Dashboard Indicating Active Service Records Ppt Professional Graphics Example PDF
This graph or chart is linked to excel, and changes automatically based on data. Just left click on it and select Edit Data. Pitch your topic with ease and precision using this SLA KPL Dashboard Indicating Active Service Records Ppt Professional Graphics Example PDF. This layout presents information on Active Service Records, Highest Project Values, Highest Values. It is also available for immediate download and adjustment. So, changes can be made in the color, design, graphics or any other component to create a unique layout.
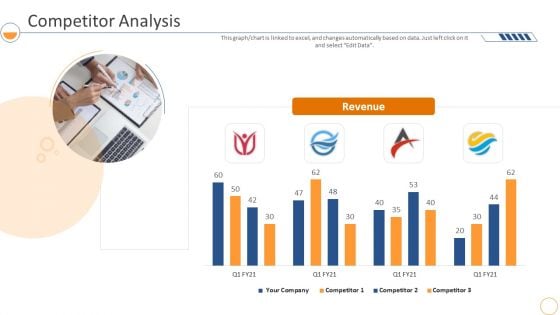
Monthly Company Performance Analysiscompetitor Analysis Pictures PDF
This graph or chart is linked to excel, and changes automatically based on data. Just left click on it and select Edit Data. Deliver and pitch your topic in the best possible manner with this monthly company performance analysiscompetitor analysis pictures pdf. Use them to share invaluable insights on revenue, competitor analysis and impress your audience. This template can be altered and modified as per your expectations. So, grab it now.
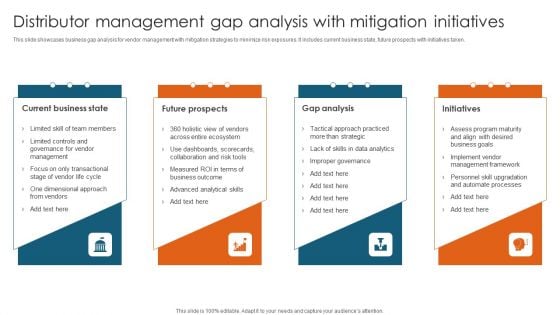
Distributor Management Gap Analysis With Mitigation Initiatives Structure PDF
This slide showcases business gap analysis for vendor management with mitigation strategies to minimize risk exposures. It includes current business state, future prospects with initiatives taken.Presenting Distributor Management Gap Analysis With Mitigation Initiatives Structure PDF to dispense important information. This template comprises four stages. It also presents valuable insights into the topics including Tactical Approach, Assess Program, Advanced Analytical. This is a completely customizable PowerPoint theme that can be put to use immediately. So, download it and address the topic impactfully.
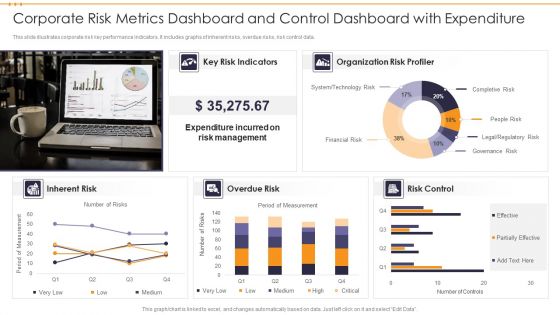
Corporate Risk Metrics Dashboard And Control Dashboard With Expenditure Inspiration PDF
This slide illustrates corporate risk key performance indicators. It includes graphs of inherent risks, overdue risks, risk control data. Showcasing this set of slides titled Corporate Risk Metrics Dashboard And Control Dashboard With Expenditure Inspiration PDF. The topics addressed in these templates are Expenditure, Risk Management, Organization Risk. All the content presented in this PPT design is completely editable. Download it and make adjustments in color, background, font etc. as per your unique business setting.
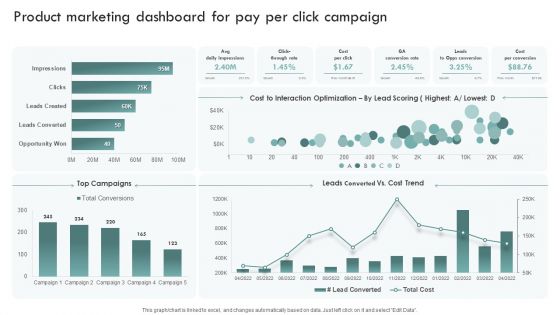
Brand Awareness Plan Product Marketing Dashboard For Pay Per Click Campaign Template PDF
This graph or chart is linked to excel, and changes automatically based on data. Just left click on it and select Edit Data. Get a simple yet stunning designed Brand Awareness Plan Product Marketing Dashboard For Pay Per Click Campaign Template PDF. It is the best one to establish the tone in your meetings. It is an excellent way to make your presentations highly effective. So, download this PPT today from Slidegeeks and see the positive impacts. Our easy-to-edit Brand Awareness Plan Product Marketing Dashboard For Pay Per Click Campaign Template PDF can be your go-to option for all upcoming conferences and meetings. So, what are you waiting for Grab this template today.
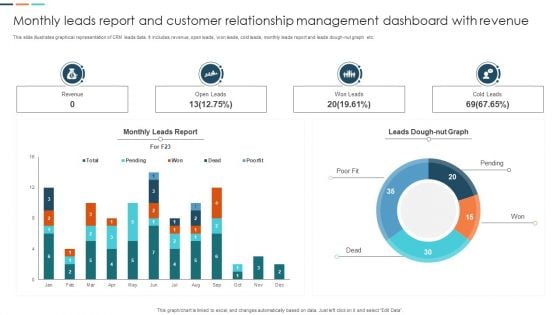
Monthly Leads Report And Customer Relationship Management Dashboard With Revenue Information PDF
This slide illustrates graphical representation of CRM leads data. It includes revenue, open leads, won leads, cold leads, monthly leads report and leads dough nut graph etc. Pitch your topic with ease and precision using this Monthly Leads Report And Customer Relationship Management Dashboard With Revenue Information PDF. This layout presents information on Monthly Leads Report, Customer Relationship Management, Dashboard With Revenue. It is also available for immediate download and adjustment. So, changes can be made in the color, design, graphics or any other component to create a unique layout.
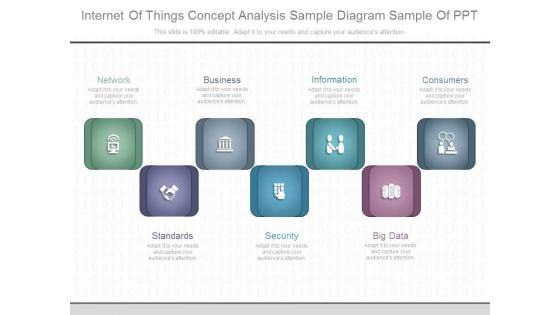
Internet Of Things Concept Analysis Sample Diagram Sample Of Ppt
This is a internet of things concept analysis sample diagram sample of ppt. This is a seven stage process. The stages in this process are network, business, information, consumers, standards, security, big data.
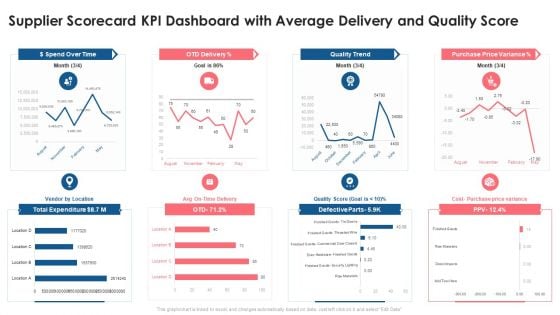
Supplier Scorecard Supplier Scorecard KPI Dashboard With Average Delivery And Quality Score Introduction PDF
This graph or chart is linked to excel, and changes automatically based on data. Just left click on it and select Edit Data. Deliver an awe inspiring pitch with this creative supplier scorecard supplier scorecard kpi dashboard with average delivery and quality score introduction pdf bundle. Topics like dollar spend over time, otd delivery, quality trend, purchase price variance, total expenditure can be discussed with this completely editable template. It is available for immediate download depending on the needs and requirements of the user.
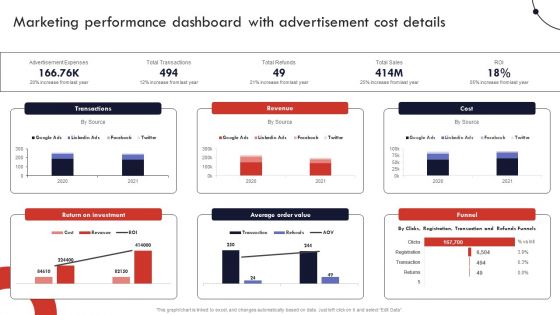
Product And Services Promotion Marketing Performance Dashboard With Advertisement Graphics PDF
This graph or chart is linked to excel, and changes automatically based on data. Just left click on it and select Edit Data. Slidegeeks is here to make your presentations a breeze with Product And Services Promotion Marketing Performance Dashboard With Advertisement Graphics PDF With our easy-to-use and customizable templates, you can focus on delivering your ideas rather than worrying about formatting. With a variety of designs to choose from, youre sure to find one that suits your needs. And with animations and unique photos, illustrations, and fonts, you can make your presentation pop. So whether youre giving a sales pitch or presenting to the board, make sure to check out Slidegeeks first.
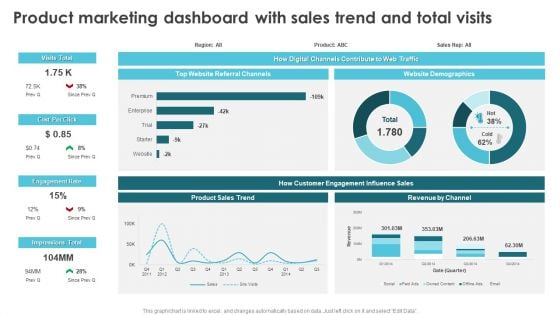
Product Marketing For Generating Product Marketing Dashboard With Sales Trend Designs PDF
This graph or chart is linked to excel, and changes automatically based on data. Just left click on it and select Edit Data. From laying roadmaps to briefing everything in detail, our templates are perfect for you. You can set the stage with your presentation slides. All you have to do is download these easy-to-edit and customizable templates. Product Marketing For Generating Product Marketing Dashboard With Sales Trend Designs PDF will help you deliver an outstanding performance that everyone would remember and praise you for. Do download this presentation today.
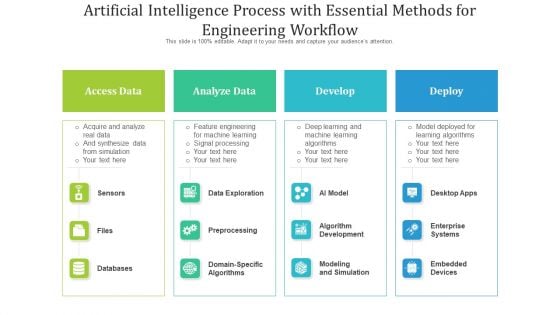
Artificial Intelligence Process With Essential Methods For Engineering Workflow Ppt PowerPoint Presentation File Demonstration PDF
Presenting artificial intelligence process with essential methods for engineering workflow ppt powerpoint presentation file demonstration pdf to dispense important information. This template comprises four stages. It also presents valuable insights into the topics including access data, analyze data, develop. This is a completely customizable PowerPoint theme that can be put to use immediately. So, download it and address the topic impactfully.
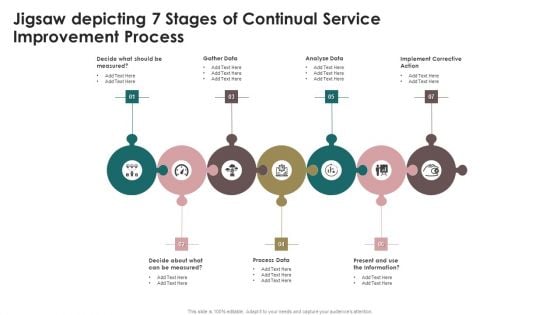
Jigsaw Depicting 7 Stages Of Continual Service Improvement Process Mockup PDF
Presenting Jigsaw Depicting 7 Stages Of Continual Service Improvement Process Mockup PDF to dispense important information. This template comprises seven stages. It also presents valuable insights into the topics including Gather Data, Analyze Data, Implement Corrective Action. This is a completely customizable PowerPoint theme that can be put to use immediately. So, download it and address the topic impactfully.
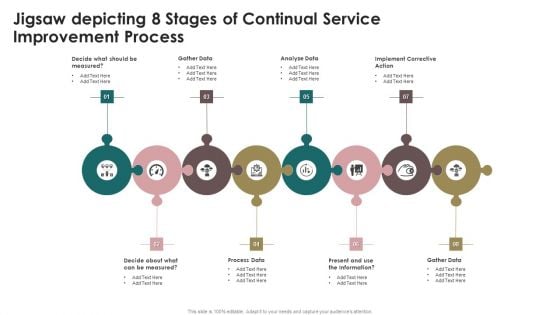
Jigsaw Depicting 8 Stages Of Continual Service Improvement Process Inspiration PDF
Presenting Jigsaw Depicting 8 Stages Of Continual Service Improvement Process Inspiration PDF to dispense important information. This template comprises eight stages. It also presents valuable insights into the topics including Gather Data, Analyze Data, Implement Corrective Action. This is a completely customizable PowerPoint theme that can be put to use immediately. So, download it and address the topic impactfully.
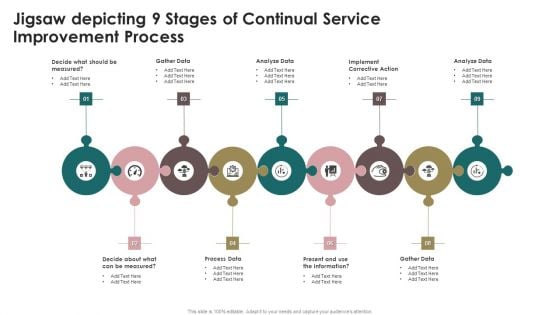
Jigsaw Depicting 9 Stages Of Continual Service Improvement Process Slides PDF
Presenting Jigsaw Depicting 9 Stages Of Continual Service Improvement Process Slides PDF to dispense important information. This template comprises nine stages. It also presents valuable insights into the topics including Gather Data, Analyze Data, Implement. This is a completely customizable PowerPoint theme that can be put to use immediately. So, download it and address the topic impactfully.
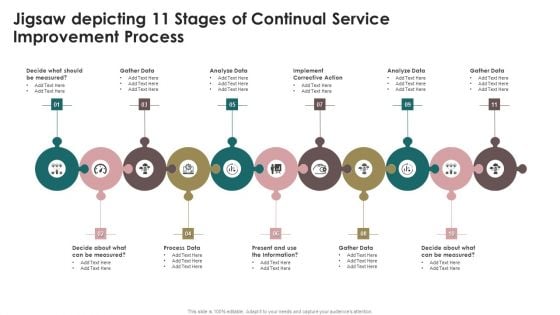
Jigsaw Depicting 11 Stages Of Continual Service Improvement Process Topics PDF
Presenting Jigsaw Depicting 11 Stages Of Continual Service Improvement Process Topics PDF to dispense important information. This template comprises eleven stages. It also presents valuable insights into the topics including Analyze Data, Implement Corrective Action, Analyze Data. This is a completely customizable PowerPoint theme that can be put to use immediately. So, download it and address the topic impactfully.
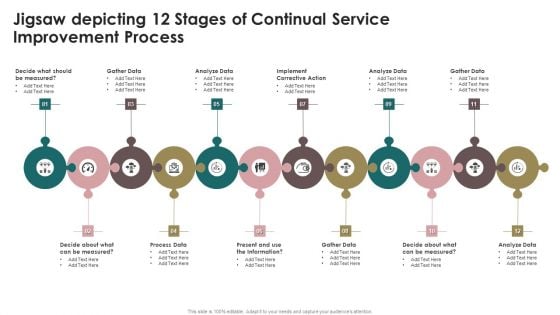
Jigsaw Depicting 12 Stages Of Continual Service Improvement Process Structure PDF
Presenting Jigsaw Depicting 12 Stages Of Continual Service Improvement Process Structure PDF to dispense important information. This template comprises tweleve stages. It also presents valuable insights into the topics including Analyze Data, Implement Corrective Action, Gather Data. This is a completely customizable PowerPoint theme that can be put to use immediately. So, download it and address the topic impactfully.
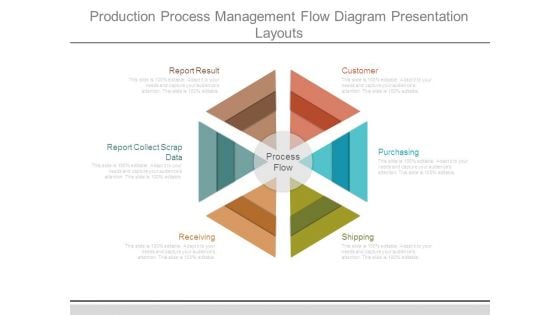
Production Process Management Flow Diagram Presentation Layouts
This is a production process management flow diagram presentation layouts. This is a six stage process. The stages in this process are report result, report collect scrap data, receiving, customer, purchasing, shipping, process flow.
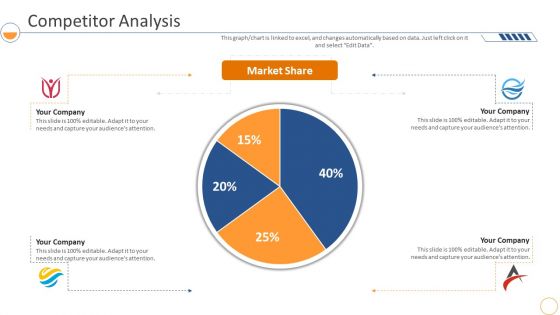
Monthly Company Performance Analysiscompetitor Analysis Market Formats PDF
This graph or chart is linked to excel, and changes automatically based on data. Just left click on it and select Edit Data. Deliver an awe inspiring pitch with this creative monthly company performance analysiscompetitor analysis market formats pdf bundle. Topics like competitor analysis, market share can be discussed with this completely editable template. It is available for immediate download depending on the needs and requirements of the user.
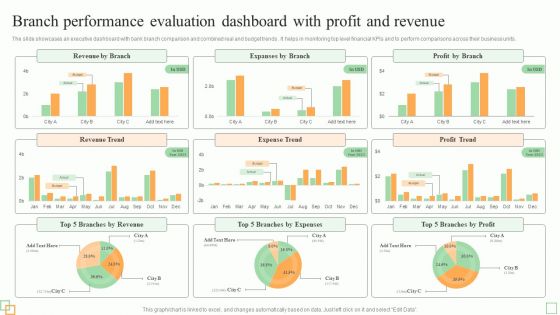
Branch Performance Evaluation Dashboard With Profit And Revenue Diagrams PDF
The slides showcases tips for enhancing branchs workforce performance and efficiency. It covers utilize transaction analysis data, schedule idle time, incent staff for efficiency, get bottom support and use part-time staff.Persuade your audience using this Best Practices To Improve Branch Workforce Performance Evaluation And Efficiency Introduction PDF. This PPT design covers five stages, thus making it a great tool to use. It also caters to a variety of topics including Market Opportunities, Customer Branch, Unnecessary Labor. Download this PPT design now to present a convincing pitch that not only emphasizes the topic but also showcases your presentation skills.
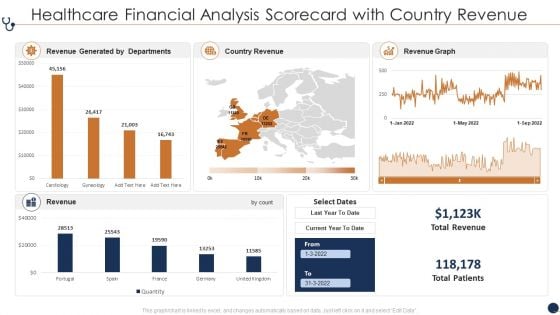
Healthcare Financial Analysis Scorecard With Country Revenue Ppt Layouts PDF
This graph or chart is linked to excel, and changes automatically based on data. Just left click on it and select Edit Data. Deliver an awe inspiring pitch with this creative Healthcare Financial Analysis Scorecard With Country Revenue Ppt Layouts PDF bundle. Topics like Revenue Generated Departments, Country Revenue Current can be discussed with this completely editable template. It is available for immediate download depending on the needs and requirements of the user.
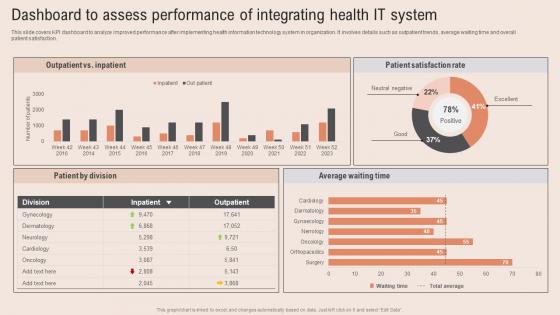
Dashboard Assess Performance Healthcare Information Tech To Enhance Medical Facilities Professional Pdf
This slide covers KPI dashboard to analyze improved performance after implementing health information technology system in organization. It involves details such as outpatient trends, average waiting time and overall patient satisfaction. Present like a pro with Dashboard Assess Performance Healthcare Information Tech To Enhance Medical Facilities Professional Pdf Create beautiful presentations together with your team, using our easy to use presentation slides. Share your ideas in real time and make changes on the fly by downloading our templates. So whether you are in the office, on the go, or in a remote location, you can stay in sync with your team and present your ideas with confidence. With Slidegeeks presentation got a whole lot easier. Grab these presentations today. This slide covers KPI dashboard to analyze improved performance after implementing health information technology system in organization. It involves details such as outpatient trends, average waiting time and overall patient satisfaction.
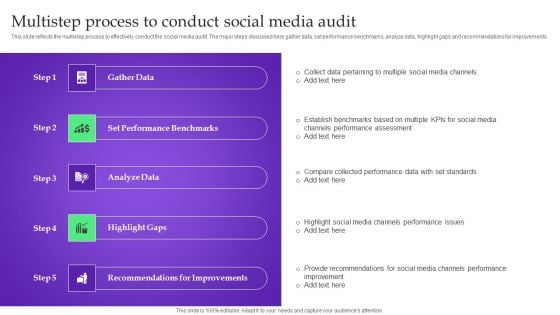
Analysis Plan For E Commerce Promotion Tactics Multistep Process To Conduct Social Media Audit Themes PDF
This slide reflects the multistep process to effectively conduct the social media audit. The major steps discussed here gather data, set performance benchmarks, analyze data, highlight gaps and recommendations for improvements. This slide reflects the multistep process to effectively conduct the social media audit. The major steps discussed here gather data, set performance benchmarks, analyze data, highlight gaps and recommendations for improvements. Want to ace your presentation in front of a live audience Our Analysis Plan For E Commerce Promotion Tactics Multistep Process To Conduct Social Media Audit Themes PDF can help you do that by engaging all the users towards you. Slidegeeks experts have put their efforts and expertise into creating these impeccable powerpoint presentations so that you can communicate your ideas clearly. Moreover, all the templates are customizable, and easy to edit and downloadable. Use these for both personal and commercial use.

Dashboard Assess Healthcare Service Healthcare Information Tech Enhance Medical Facilities Microsoft Pdf
This slide covers KPI dashboard to assess performance f medical services. It involves details such as patient stay length, admission rate, average treatment costs and cost analysis of stays. From laying roadmaps to briefing everything in detail, our templates are perfect for you. You can set the stage with your presentation slides. All you have to do is download these easy to edit and customizable templates. Dashboard Assess Healthcare Service Healthcare Information Tech Enhance Medical Facilities Microsoft Pdf will help you deliver an outstanding performance that everyone would remember and praise you for. Do download this presentation today. This slide covers KPI dashboard to assess performance f medical services. It involves details such as patient stay length, admission rate, average treatment costs and cost analysis of stays.
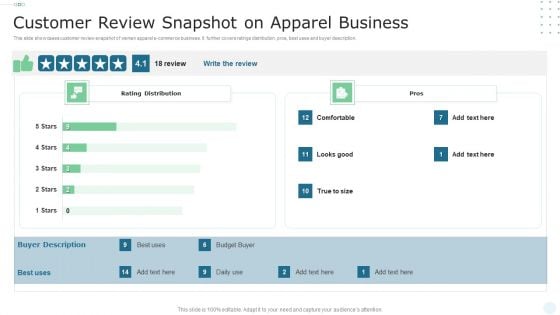
Customer Review Snapshot On Apparel Business Ideas PDF
This slide showcases customer review snapshot of women apparel e commerce business. It further covers ratings distribution, pros, best uses and buyer description. Showcasing this set of slides titled Customer Review Snapshot On Apparel Business Ideas PDF. The topics addressed in these templates are Customer Review Snapshot, Apparel Business. All the content presented in this PPT design is completely editable. Download it and make adjustments in color, background, font etc. as per your unique business setting.
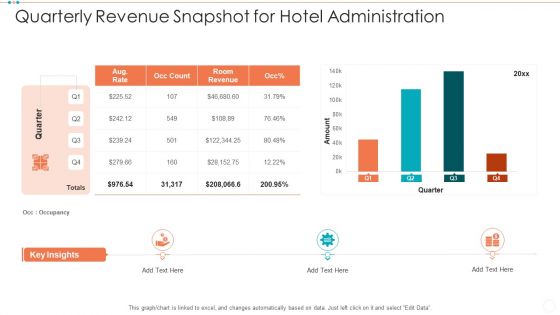
Quarterly Revenue Snapshot For Hotel Administration Structure PDF
Showcasing this set of slides titled quarterly revenue snapshot for hotel administration structure pdf. The topics addressed in these templates are quarterly revenue snapshot for hotel administration. All the content presented in this PPT design is completely editable. Download it and make adjustments in color, background, font etc. as per your unique business setting.
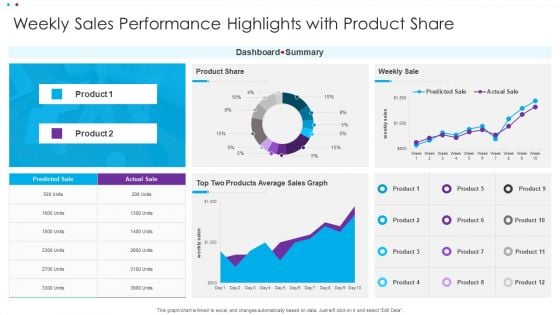
Weekly Sales Performance Highlights With Product Share Ppt File Information PDF
This graph or chart is linked to excel, and changes automatically based on data. Just left click on it and select Edit Data. Pitch your topic with ease and precision using this Weekly Sales Performance Highlights With Product Share Ppt File Information PDF. This layout presents information on Dashboard Summary, Weekly Sale, Product Share. It is also available for immediate download and adjustment. So, changes can be made in the color, design, graphics or any other component to create a unique layout.
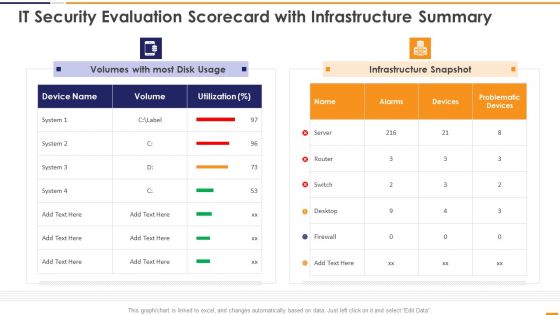
IT Security Evaluation Scorecard With Infrastructure Summary Ppt Slides Portrait PDF
This graph or chart is linked to excel, and changes automatically based on data. Just left click on it and select Edit Data. Deliver an awe inspiring pitch with this creative IT Security Evaluation Scorecard With Infrastructure Summary Ppt Slides Portrait PDF bundle. Topics like Volumes Most Disk, Usage Infrastructure Snapshot can be discussed with this completely editable template. It is available for immediate download depending on the needs and requirements of the user.

Implementing Succession Planning HR Performance Management Dashboard Microsoft PDF
This graph or chart is linked to excel, and changes automatically based on data. Just left click on it and select Edit Data. Find highly impressive Implementing Succession Planning HR Performance Management Dashboard Microsoft PDF on Slidegeeks to deliver a meaningful presentation. You can save an ample amount of time using these presentation templates. No need to worry to prepare everything from scratch because Slidegeeks experts have already done a huge research and work for you. You need to download Implementing Succession Planning HR Performance Management Dashboard Microsoft PDF for your upcoming presentation. All the presentation templates are 100 percent editable and you can change the color and personalize the content accordingly. Download now.
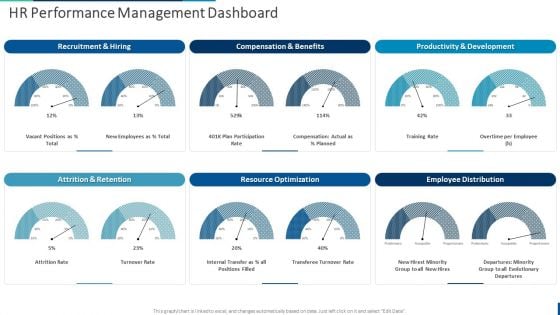
Internal Employee Succession HR Performance Management Dashboard Guidelines PDF
This graph or chart is linked to excel, and changes automatically based on data. Just left click on it and select Edit Data. Find highly impressive Internal Employee Succession HR Performance Management Dashboard Guidelines PDF on Slidegeeks to deliver a meaningful presentation. You can save an ample amount of time using these presentation templates. No need to worry to prepare everything from scratch because Slidegeeks experts have already done a huge research and work for you. You need to download Internal Employee Succession HR Performance Management Dashboard Guidelines PDF for your upcoming presentation. All the presentation templates are 100 percent editable and you can change the color and personalize the content accordingly. Download now
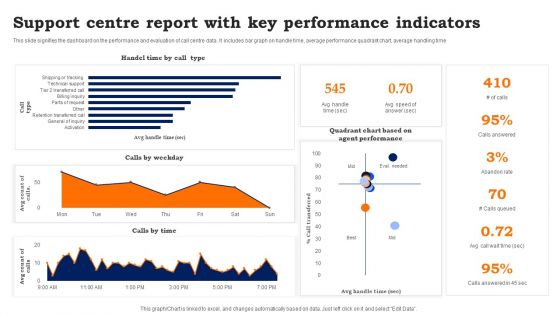
Support Centre Report With Key Performance Indicators Information PDF
This slide signifies the dashboard on the performance and evaluation of call centre data. It includes bar graph on handle time, average performance quadrant chart, average handling time. Showcasing this set of slides titled Support Centre Report With Key Performance Indicators Information PDF. The topics addressed in these templates are Support Centre Report, Key Performance Indicators. All the content presented in this PPT design is completely editable. Download it and make adjustments in color, background, font etc. as per your unique business setting.
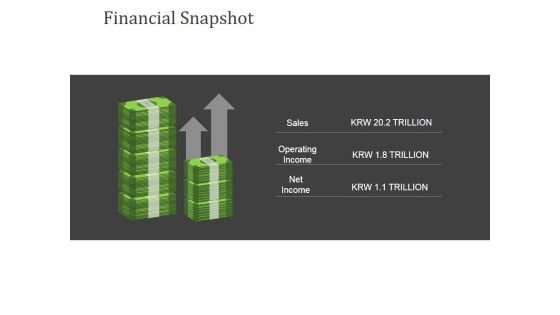
Financial Snapshot Ppt PowerPoint Presentation Model Themes
This is a financial snapshot ppt powerpoint presentation model themes. This is a two stage process. The stages in this process are sales, operating income, net income.

Project Evaluation And Estimated Results Dashboard Ideas PDF
This slide illustrates graphical representation and facts and figures relating to project management data. It includes budget by employee, overdue tasks, workload charts etc. Showcasing this set of slides titled Project Evaluation And Estimated Results Dashboard Ideas PDF. The topics addressed in these templates are Overdue Tasks, Project Budget, Project Evaluation. All the content presented in this PPT design is completely editable. Download it and make adjustments in color, background, font etc. as per your unique business setting.
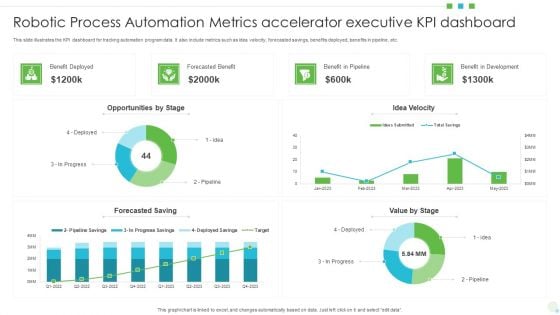
Robotic Process Automation Metrics Accelerator Executive KPI Dashboard Formats PDF
This slide illustrates the KPI dashboard for tracking automation program data. It also include metrics such as idea velocity, forecasted savings, benefits deployed, benefits in pipeline, etc. Showcasing this set of slides titled Robotic Process Automation Metrics Accelerator Executive KPI Dashboard Formats PDF. The topics addressed in these templates are Opportunities, Benefit In Development, Value. All the content presented in this PPT design is completely editable. Download it and make adjustments in color, background, font etc. as per your unique business setting.
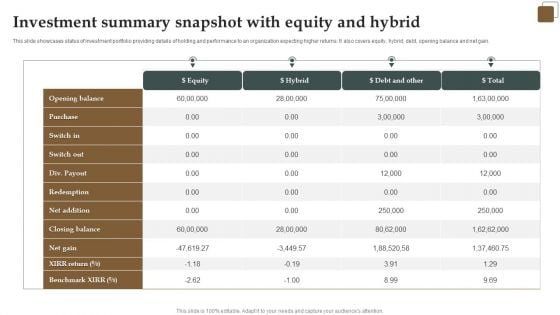
Investment Summary Snapshot With Equity And Hybrid Diagrams PDF
This slide showcases status of investment portfolio providing details of holding and performance to an organization expecting higher returns. It also covers equity, hybrid, debt, opening balance and net gain. Showcasing this set of slides titled Investment Summary Snapshot With Equity And Hybrid Diagrams PDF. The topics addressed in these templates are Purchase, Equity, Net Gain . All the content presented in this PPT design is completely editable. Download it and make adjustments in color, background, font etc. as per your unique business setting.
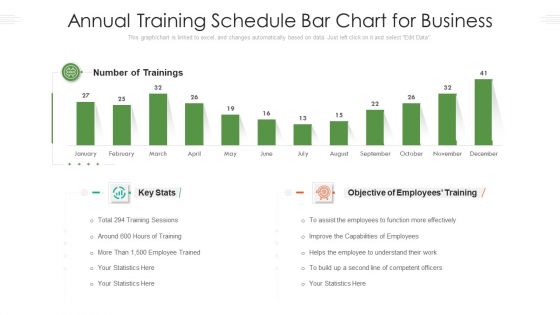
Annual Training Schedule Bar Chart For Business Ppt PowerPoint Presentation File Infographics PDF
This graph chart is linked to excel, and changes automatically based on data. Just left click on it and select Edit Data. Showcasing this set of slides titled annual training schedule bar chart for business ppt powerpoint presentation file infographics pdf. The topics addressed in these templates are trainings, employees, competent officers. All the content presented in this PPT design is completely editable. Download it and make adjustments in color, background, font etc. as per your unique business setting.
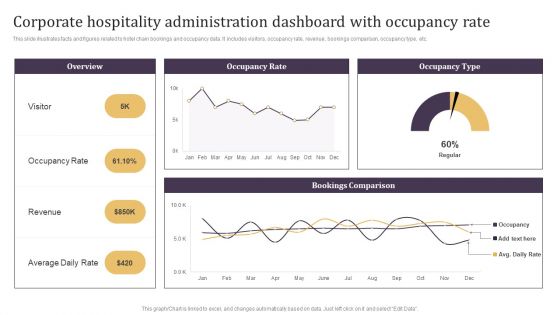
Corporate Hospitality Administration Dashboard With Occupancy Rate Guidelines PDF
This slide illustrates facts and figures related to hotel chain bookings and occupancy data. It includes visitors, occupancy rate, revenue, bookings comparison, occupancy type, etc.Pitch your topic with ease and precision using this Corporate Hospitality Administration Dashboard With Occupancy Rate Guidelines PDF. This layout presents information on Occupancy Rate, Average Daily Rate, Bookings Comparison. It is also available for immediate download and adjustment. So, changes can be made in the color, design, graphics or any other component to create a unique layout.
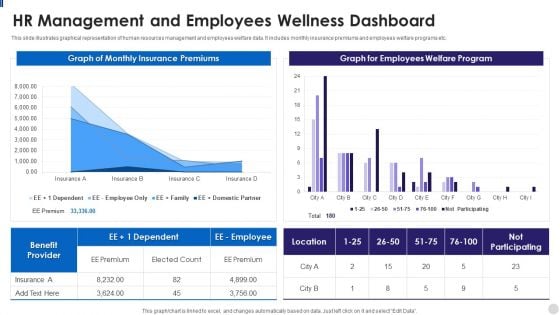
HR Management And Employees Wellness Dashboard Slides PDF
This slide illustrates graphical representation of human resources management and employees welfare data. It includes monthly insurance premiums and employees welfare programs etc. Showcasing this set of slides titled HR Management And Employees Wellness Dashboard Slides PDF. The topics addressed in these templates are Premium, Benefit, Insurance. All the content presented in this PPT design is completely editable. Download it and make adjustments in color, background, font etc. as per your unique business setting.
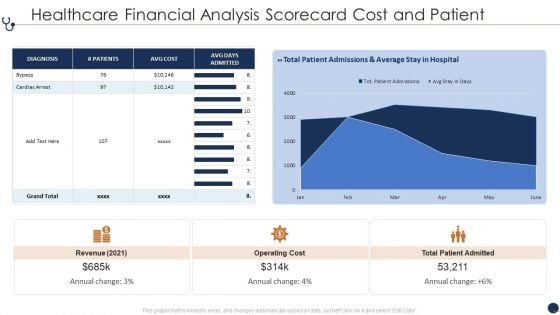
Healthcare Financial Analysis Scorecard Cost And Patient Ppt Pictures Rules PDF
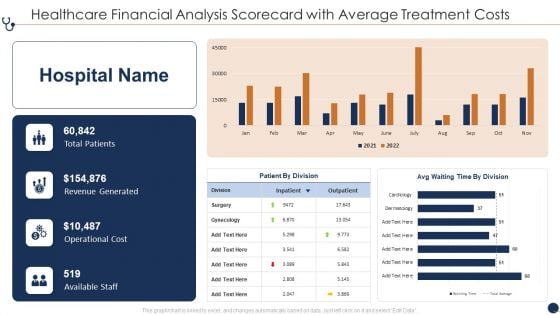
Healthcare Financial Analysis Scorecard With Average Treatment Costs Ppt Gallery Inspiration PDF
This graph or chart is linked to excel, and changes automatically based on data. Just left click on it and select Edit Data. Deliver and pitch your topic in the best possible manner with this Healthcare Financial Analysis Scorecard With Average Treatment Costs Ppt Gallery Inspiration PDF. Use them to share invaluable insights on Total Patients Revenue, Generated Operational Cost, Available Staff Outpatient and impress your audience. This template can be altered and modified as per your expectations. So, grab it now.
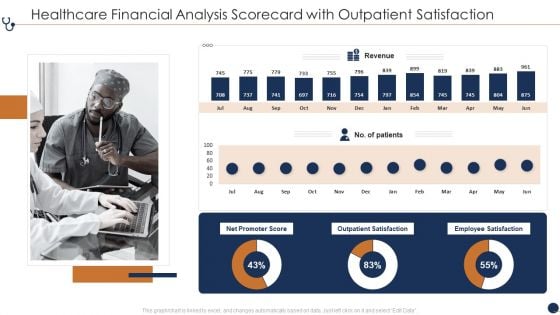
Healthcare Financial Analysis Scorecard With Outpatient Satisfaction Ppt Professional Background Image PDF
This graph or chart is linked to excel, and changes automatically based on data. Just left click on it and select Edit Data. Deliver and pitch your topic in the best possible manner with this Healthcare Financial Analysis Scorecard With Outpatient Satisfaction Ppt Professional Background Image PDF. Use them to share invaluable insights on Net Promoter Score, Outpatient Satisfaction Employee, Revenue Satisfaction Patients and impress your audience. This template can be altered and modified as per your expectations. So, grab it now.
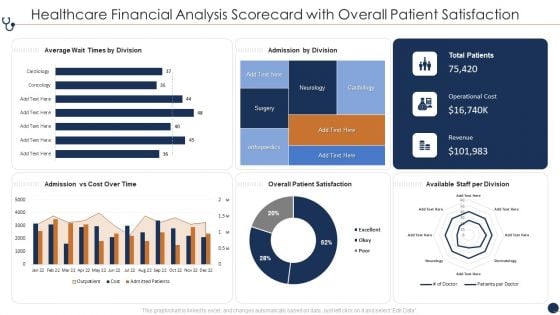
Healthcare Financial Analysis Scorecard With Overall Patient Satisfaction Ppt File Graphics PDF
This graph or chart is linked to excel, and changes automatically based on data. Just left click on it and select Edit Data. Deliver an awe inspiring pitch with this creative Healthcare Financial Analysis Scorecard With Overall Patient Satisfaction Ppt File Graphics PDF bundle. Topics like Average Wait Times, Admission By Division, Admission Vs Cost, Overall Patient Satisfaction can be discussed with this completely editable template. It is available for immediate download depending on the needs and requirements of the user.
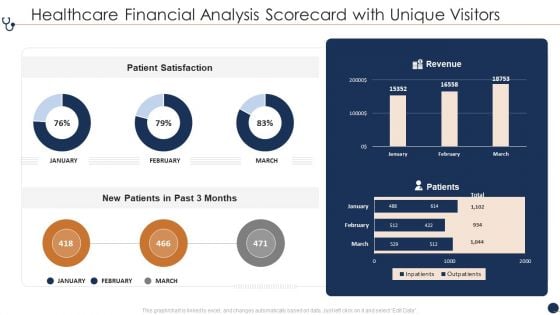
Healthcare Financial Analysis Scorecard With Unique Visitors Ppt File Visuals PDF
This graph or chart is linked to excel, and changes automatically based on data. Just left click on it and select Edit Data. Deliver an awe inspiring pitch with this creative Healthcare Financial Analysis Scorecard With Unique Visitors Ppt File Visuals PDF bundle. Topics like Patient Satisfaction Revenue, New Patients Past can be discussed with this completely editable template. It is available for immediate download depending on the needs and requirements of the user.
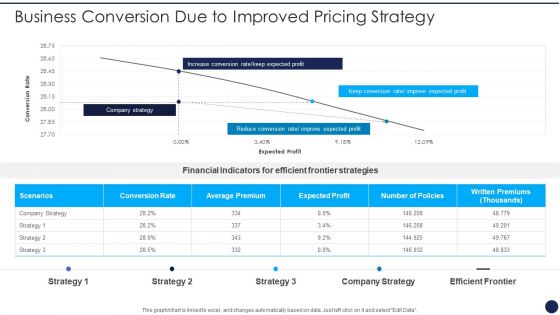
Product Pricing Strategies Analysis Business Conversion Due To Improved Pricing Strategy Slides PDF
This graph or chart is linked to excel, and changes automatically based on data. Just left click on it and select Edit Data. Deliver an awe inspiring pitch with this creative Product Pricing Strategies Analysis Business Conversion Due To Improved Pricing Strategy Slides PDF bundle. Topics like Increase Conversion Rate, Keep Expected Profit, Reduce Conversion Rate, Improve Expected Profit can be discussed with this completely editable template. It is available for immediate download depending on the needs and requirements of the user.
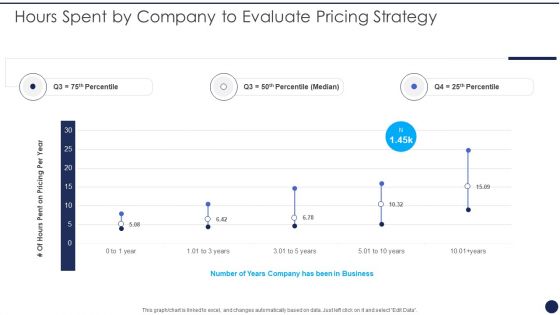
Product Pricing Strategies Analysis Hours Spent By Company To Evaluate Pricing Strategy Professional PDF
This graph or chart is linked to excel, and changes automatically based on data. Just left click on it and select Edit Data. Deliver an awe inspiring pitch with this creative Product Pricing Strategies Analysis Hours Spent By Company To Evaluate Pricing Strategy Professional PDF bundle. Topics like Pricing Per Year, Number Years Business can be discussed with this completely editable template. It is available for immediate download depending on the needs and requirements of the user.
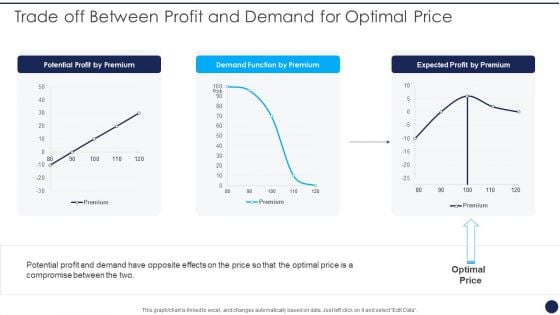
Product Pricing Strategies Analysis Trade Off Between Profit And Demand For Optimal Price Portrait PDF
This graph or chart is linked to excel, and changes automatically based on data. Just left click on it and select Edit Data. Deliver and pitch your topic in the best possible manner with this Product Pricing Strategies Analysis Trade Off Between Profit And Demand For Optimal Price Portrait PDF. Use them to share invaluable insights on Potential Profit Premium, Demand Function Premium and impress your audience. This template can be altered and modified as per your expectations. So, grab it now.
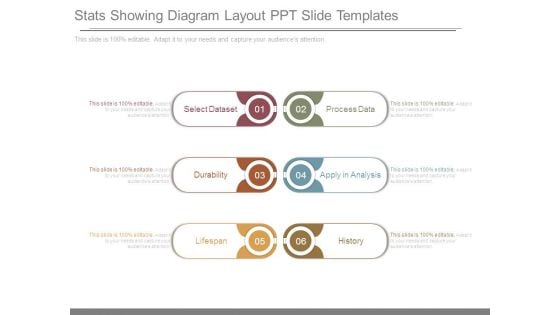
Stats Showing Diagram Layout Ppt Slide Templates
This is a stats showing diagram layout ppt slide templates. This is a six stage process. The stages in this process are select dataset, durability, lifespan, process data, apply in analysis, history.
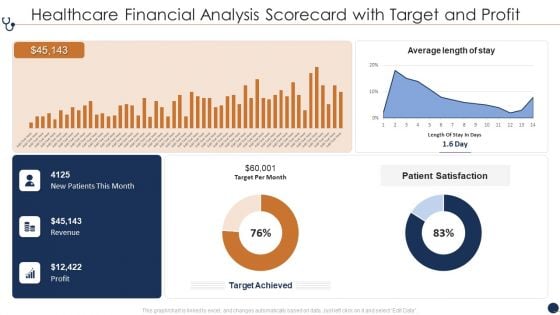
Healthcare Financial Analysis Scorecard With Target And Profit Ppt Gallery Example File PDF
This graph or chart is linked to excel, and changes automatically based on data. Just left click on it and select Edit Data. Deliver an awe inspiring pitch with this creative Avg Nurse Patient, Revenue And Expenses, Avg Treatment Costs bundle. Topics like Average Length Stay, Patient Satisfaction Target, Target Per Month can be discussed with this completely editable template. It is available for immediate download depending on the needs and requirements of the user.
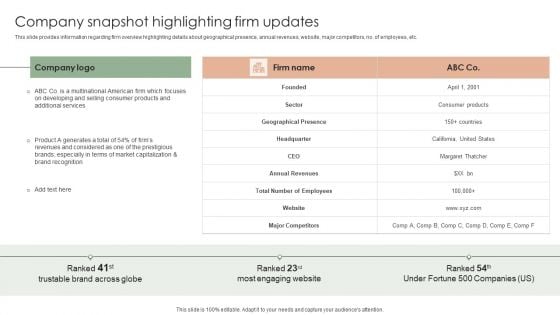
Implementing Effective Strategy Company Snapshot Highlighting Firm Updates Structure PDF
This slide provides information regarding firm overview highlighting details about geographical presence, annual revenues, website, major competitors, no. of employees, etc. Are you searching for a Implementing Effective Strategy Company Snapshot Highlighting Firm Updates Structure PDF that is uncluttered, straightforward, and original Its easy to edit, and you can change the colors to suit your personal or business branding. For a presentation that expresses how much effort youve put in, this template is ideal With all of its features, including tables, diagrams, statistics, and lists, its perfect for a business plan presentation. Make your ideas more appealing with these professional slides. Download Implementing Effective Strategy Company Snapshot Highlighting Firm Updates Structure PDF from Slidegeeks today.

Developing Appealing Persona Customer Satisfaction Kpi Dashboard Microsoft PDF
This graph or chart is linked to excel, and changes automatically based on data. Just left click on it and select Edit Data. Do you have an important presentation coming up Are you looking for something that will make your presentation stand out from the rest Look no further than Developing Appealing Persona Customer Satisfaction Kpi Dashboard Microsoft PDF. With our professional designs, you can trust that your presentation will pop and make delivering it a smooth process. And with Slidegeeks, you can trust that your presentation will be unique and memorable. So why wait Grab Developing Appealing Persona Customer Satisfaction Kpi Dashboard Microsoft PDF today and make your presentation stand out from the rest
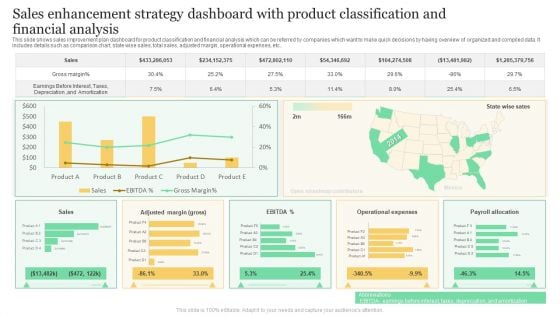
Sales Enhancement Strategy Dashboard With Product Classification And Financial Analysis Formats PDF
This slide shows sales improvement plan dashboard for product classification and financial analysis which can be referred by companies which want to make quick decisions by having overview of organized and compiled data. It includes details such as comparison chart, state wise sales, total sales, adjusted margin, operational expenses, etc. Showcasing this set of slides titled Sales Enhancement Strategy Dashboard With Product Classification And Financial Analysis Formats PDF. The topics addressed in these templates are Gross Margin, Sales, Operational Expenses. All the content presented in this PPT design is completely editable. Download it and make adjustments in color, background, font etc. as per your unique business setting.
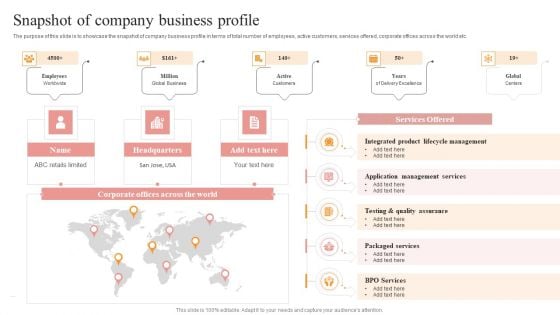
Snapshot Of Company Business Profile Themes PDF
The purpose of this slide is to showcase the snapshot of company business profile in terms of total number of employees, active customers, services offered, corporate offices across the world etc. Slidegeeks is here to make your presentations a breeze with Snapshot Of Company Business Profile Themes PDF With our easy to use and customizable templates, you can focus on delivering your ideas rather than worrying about formatting. With a variety of designs to choose from, you are sure to find one that suits your needs. And with animations and unique photos, illustrations, and fonts, you can make your presentation pop. So whether you are giving a sales pitch or presenting to the board, make sure to check out Slidegeeks first.
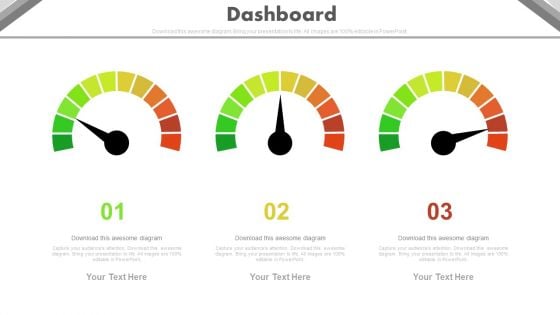
Three Steps Dashboard Charts For Financial Review Powerpoint Slides
This PowerPoint template has been designed with three dashboards. Use this PPT slide to depict financial review and plan. This professional diagram slide will help you express your views to target audience.
Several Brands Performance Tracking Dashboard Designs PDF
This slide provides information regarding different brands performance tracking dashboard in terms positive or negative mentions, sources, etc. The Several Brands Performance Tracking Dashboard Designs PDF is a compilation of the most recent design trends as a series of slides. It is suitable for any subject or industry presentation, containing attractive visuals and photo spots for businesses to clearly express their messages. This template contains a variety of slides for the user to input data, such as structures to contrast two elements, bullet points, and slides for written information. Slidegeeks is prepared to create an impression.
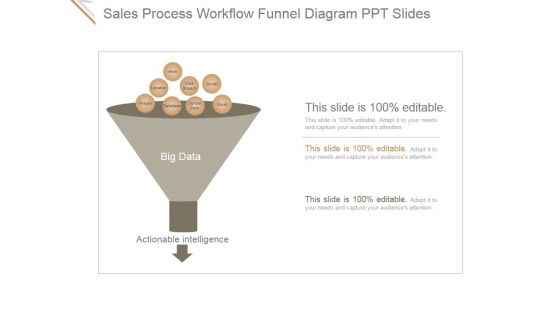
Sales Process Workflow Funnel Diagram Ppt PowerPoint Presentation Microsoft
This is a sales process workflow funnel diagram ppt powerpoint presentation microsoft. This is a three stage process. The stages in this process are html, click stream, social, email, sensor data, database, location, images.
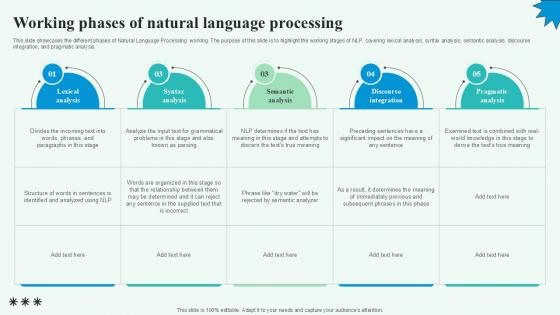
Working Phases Of Natural Language Automated Content Generation PPT PowerPoint
This slide showcases the different phases of Natural Language Processing working. The purpose of this slide is to highlight the working stages of NLP, covering lexical analysis, syntax analysis, semantic analysis, discourse integration, and pragmatic analysis. The Working Phases Of Natural Language Automated Content Generation PPT PowerPoint is a compilation of the most recent design trends as a series of slides. It is suitable for any subject or industry presentation, containing attractive visuals and photo spots for businesses to clearly express their messages. This template contains a variety of slides for the user to input data, such as structures to contrast two elements, bullet points, and slides for written information. Slidegeeks is prepared to create an impression. This slide showcases the different phases of Natural Language Processing working. The purpose of this slide is to highlight the working stages of NLP, covering lexical analysis, syntax analysis, semantic analysis, discourse integration, and pragmatic analysis.
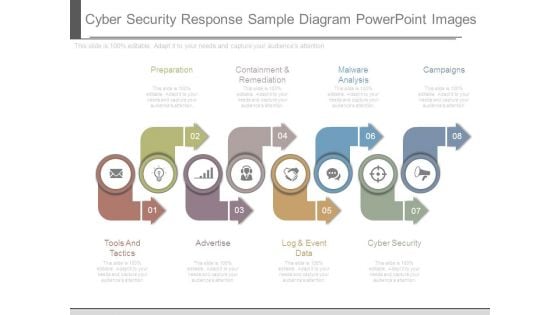
Cyber Security Response Sample Diagram Powerpoint Images
This is a cyber security response sample diagram powerpoint images. This is a eight stage process. The stages in this process are preparation, containment and remediation, malware analysis, campaigns, cyber security, log and event data, advertise, tools and tactics.
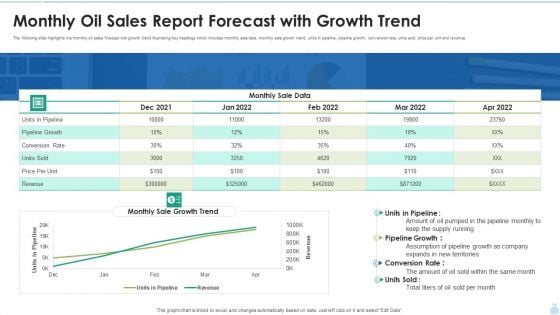
Monthly Oil Sales Report Forecast With Growth Trend Graphics PDF
The following slide highlights the monthly oil sales forecast with growth trend illustrating key headings which includes monthly sale data, monthly sale growth trend, units in pipeline, pipeline growth, conversion rate, units sold, price per unit and revenue. Showcasing this set of slides titled Monthly Oil Sales Report Forecast With Growth Trend Graphics PDF. The topics addressed in these templates are Pipeline Growth, Monthly Sale Data, Conversion Rate. All the content presented in this PPT design is completely editable. Download it and make adjustments in color, background, font etc. as per your unique business setting.
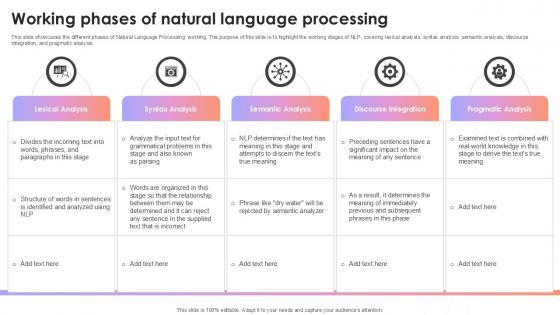
Working Phases Of Natural Language Processing AI Content Creation It Ppt Sample
This slide showcases the different phases of Natural Language Processing working. The purpose of this slide is to highlight the working stages of NLP, covering lexical analysis, syntax analysis, semantic analysis, discourse integration, and pragmatic analysis. The Working Phases Of Natural Language Processing AI Content Creation It Ppt Sample is a compilation of the most recent design trends as a series of slides. It is suitable for any subject or industry presentation, containing attractive visuals and photo spots for businesses to clearly express their messages. This template contains a variety of slides for the user to input data, such as structures to contrast two elements, bullet points, and slides for written information. Slidegeeks is prepared to create an impression. This slide showcases the different phases of Natural Language Processing working. The purpose of this slide is to highlight the working stages of NLP, covering lexical analysis, syntax analysis, semantic analysis, discourse integration, and pragmatic analysis.


 Continue with Email

 Home
Home


