Data Analytics Icons
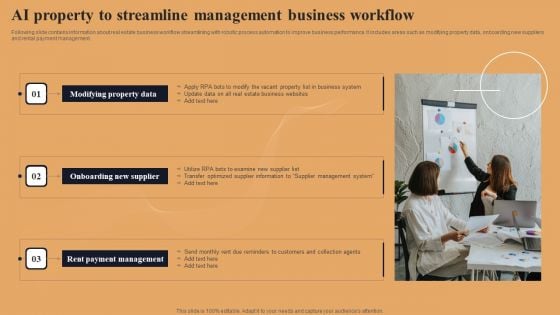
AI Property To Streamline Management Business Workflow Ideas PDF
Following slide contains information about real estate business workflow streamlining with robotic process automation to improve business performance. It includes areas such as modifying property data, onboarding new suppliers and rental payment management. Presenting AI Property To Streamline Management Business Workflow Ideas PDF to dispense important information. This template comprises three stages. It also presents valuable insights into the topics including Modifying Property Data, Onboarding New Supplier, Rent Payment Management. This is a completely customizable PowerPoint theme that can be put to use immediately. So, download it and address the topic impactfully.
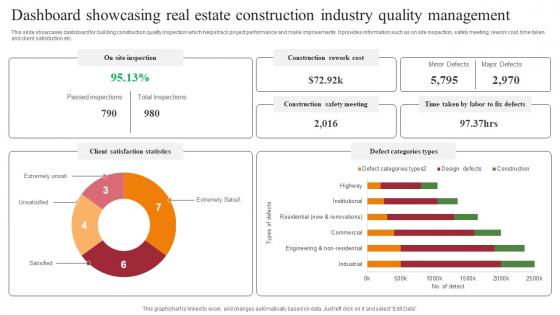
Dashboard Showcasing Real Estate Construction Industry Quality Management Topics Pdf
This slide showcases dashboard for building construction quality inspection which helps track project performance and make improvements. It provides information such as on site inspection, safety meeting, rework cost, time taken and client satisfaction etc. Pitch your topic with ease and precision using this Dashboard Showcasing Real Estate Construction Industry Quality Management Topics Pdf. This layout presents information on Client Satisfaction Statistics, Defect Categories Types. It is also available for immediate download and adjustment. So, changes can be made in the color, design, graphics or any other component to create a unique layout. This slide showcases dashboard for building construction quality inspection which helps track project performance and make improvements. It provides information such as on site inspection, safety meeting, rework cost, time taken and client satisfaction etc.
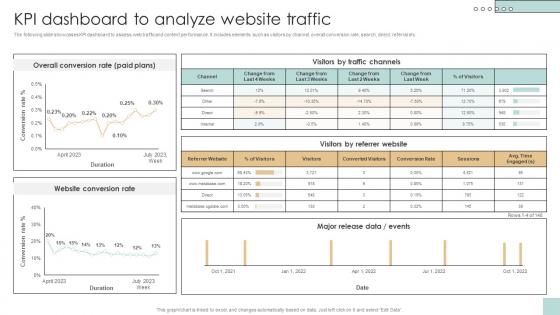
KPI Dashboard To Analyze Website Traffic Developing And Creating Digital Content Strategy SS V
The following slide showcases KPI dashboard to assess web traffic and content performance. It includes elements such as visitors by channel, overall conversion rate, search, direct, referral etc. The best PPT templates are a great way to save time, energy, and resources. Slidegeeks have 100 percent editable powerpoint slides making them incredibly versatile. With these quality presentation templates, you can create a captivating and memorable presentation by combining visually appealing slides and effectively communicating your message. Download KPI Dashboard To Analyze Website Traffic Developing And Creating Digital Content Strategy SS V from Slidegeeks and deliver a wonderful presentation. The following slide showcases KPI dashboard to assess web traffic and content performance. It includes elements such as visitors by channel, overall conversion rate, search, direct, referral etc.
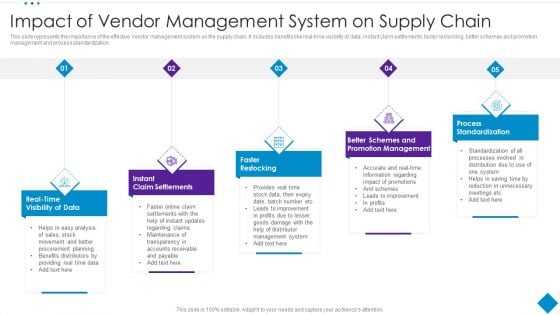
Impact Of Vendor Management System On Supply Chain Sample PDF
This slide represents the importance of the effective Vendor management system on the supply chain. It includes benefits like real time visibility of data, instant claim settlements, faster restocking, better schemes and promotion management and process standardization. Presenting Impact Of Vendor Management System On Supply Chain Sample PDF to dispense important information. This template comprises five stages. It also presents valuable insights into the topics including Promotion Management, Process Standardization, Visibility Of Data. This is a completely customizable PowerPoint theme that can be put to use immediately. So, download it and address the topic impactfully.

Three Best Practices For Quarterly Business Review Guidelines PDF
This slide shows practices to involve while reviewing companys performance and strategies to be adopted for achieving future goals. It includes customer engagement in QBR, success plan and right data. Presenting Three Best Practices For Quarterly Business Review Guidelines PDF to dispense important information. This template comprises three stages. It also presents valuable insights into the topics including Customer Engagement, Customer Success Plan, Right Data. This is a completely customizable PowerPoint theme that can be put to use immediately. So, download it and address the topic impactfully.
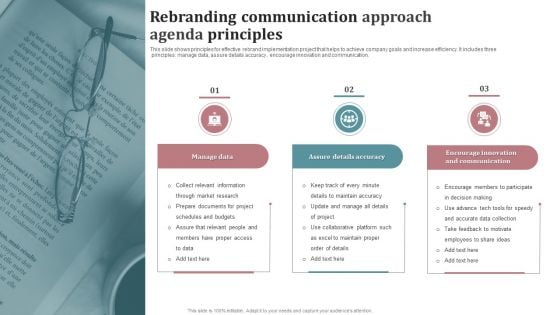
Rebranding Communication Approach Agenda Principles Rules PDF
This slide shows principles for effective rebrand implementation project that helps to achieve company goals and increase efficiency. It includes three principles manage data, assure details accuracy , encourage innovation and communication. Presenting Rebranding Communication Approach Agenda Principles Rules PDF to dispense important information. This template comprises three stages. It also presents valuable insights into the topics including Manage Data, Assure Details Accuracy, Encourage Innovation And Communication. This is a completely customizable PowerPoint theme that can be put to use immediately. So, download it and address the topic impactfully.
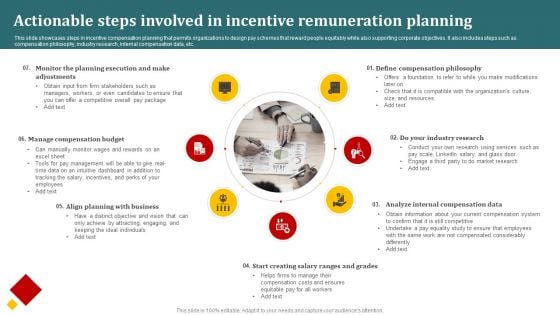
Actionable Steps Involved In Incentive Remuneration Planning Formats PDF
This slide showcases steps in incentive compensation planning that permits organizations to design pay schemes that reward people equitably while also supporting corporate objectives. It also includes steps such as compensation philosophy, industry research, internal compensation data, etc. Presenting Actionable Steps Involved In Incentive Remuneration Planning Formats PDF to dispense important information. This template comprises seven stages. It also presents valuable insights into the topics including Define Compensation Philosophy, Analyze Internal Compensation Data, Start Creating Salary Ranges. This is a completely customizable PowerPoint theme that can be put to use immediately. So, download it and address the topic impactfully.
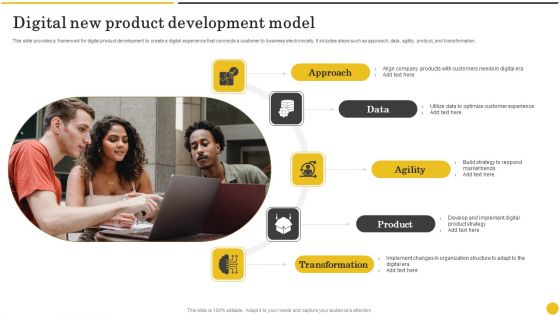
Digital New Product Development Model Formats PDF
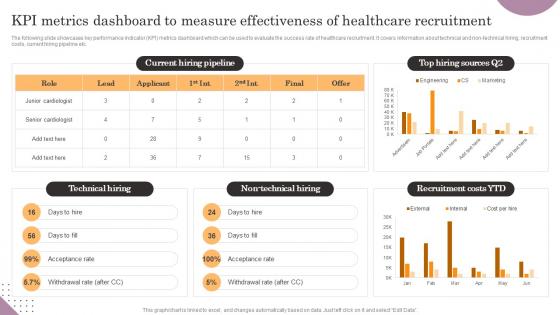
KPI Metrics Dashboard To Measure Effectiveness Of General Management Information Pdf
The following slide showcases key performance indicator KPI metrics dashboard which can be used to evaluate the success rate of healthcare recruitment. It covers information about technical and non-technical hiring, recruitment costs, current hiring pipeline etc. Presenting this PowerPoint presentation, titled KPI Metrics Dashboard To Measure Effectiveness Of General Management Information Pdf, with topics curated by our researchers after extensive research. This editable presentation is available for immediate download and provides attractive features when used. Download now and captivate your audience. Presenting this KPI Metrics Dashboard To Measure Effectiveness Of General Management Information Pdf. Our researchers have carefully researched and created these slides with all aspects taken into consideration. This is a completely customizable KPI Metrics Dashboard To Measure Effectiveness Of General Management Information Pdf that is available for immediate downloading. Download now and make an impact on your audience. Highlight the attractive features available with our PPTs. The following slide showcases key performance indicator KPI metrics dashboard which can be used to evaluate the success rate of healthcare recruitment. It covers information about technical and non-technical hiring, recruitment costs, current hiring pipeline etc.
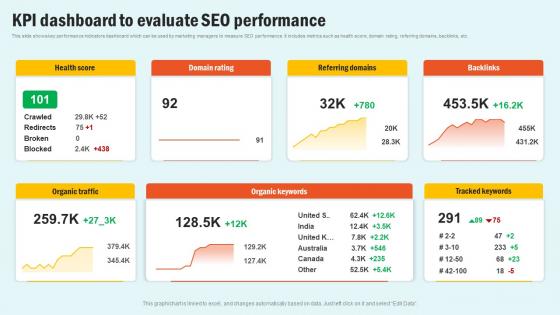
KPI Dashboard To Evaluate SEO Enhancing Website Performance With Search Engine Content Structure Pdf
This slide shows key performance indicators dashboard which can be used by marketing managers to measure SEO performance. It includes metrics such as health score, domain rating, referring domains, backlinks, etc. Welcome to our selection of the KPI Dashboard To Evaluate SEO Enhancing Website Performance With Search Engine Content Structure Pdf. These are designed to help you showcase your creativity and bring your sphere to life. Planning and Innovation are essential for any business that is just starting out. This collection contains the designs that you need for your everyday presentations. All of our PowerPoints are 100 percent editable, so you can customize them to suit your needs. This multi purpose template can be used in various situations. Grab these presentation templates today This slide shows key performance indicators dashboard which can be used by marketing managers to measure SEO performance. It includes metrics such as health score, domain rating, referring domains, backlinks, etc.
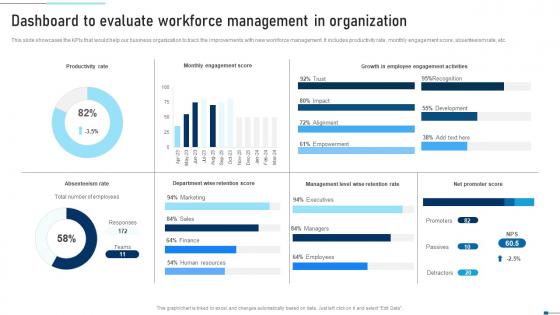
Dashboard To Evaluate Workforce Management In Strategic Talent Recruitment Diagrams Pdf
This slide showcases the KPIs that would help our business organization to track the improvements with new workforce management. It includes productivity rate, monthly engagement score, absenteeism rate, etc. Find highly impressive Dashboard To Evaluate Workforce Management In Strategic Talent Recruitment Diagrams Pdf on Slidegeeks to deliver a meaningful presentation. You can save an ample amount of time using these presentation templates. No need to worry to prepare everything from scratch because Slidegeeks experts have already done a huge research and work for you. You need to download for your upcoming presentation. All the presentation templates are 100 percent editable and you can change the color and personalize the content accordingly. Download now This slide showcases the KPIs that would help our business organization to track the improvements with new workforce management. It includes productivity rate, monthly engagement score, absenteeism rate, etc.
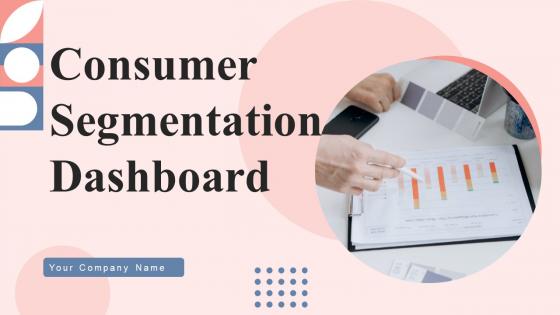
Consumer Segmentation Dashboard Ppt Powerpoint Presentation Complete Deck With Slides
This Consumer Segmentation Dashboard Ppt Powerpoint Presentation Complete Deck With Slides acts as backup support for your ideas, vision, thoughts, etc. Use it to present a thorough understanding of the topic. This PPT slideshow can be utilized for both in-house and outside presentations depending upon your needs and business demands. Entailing twelve slides with a consistent design and theme, this template will make a solid use case. As it is intuitively designed, it suits every business vertical and industry. All you have to do is make a few tweaks in the content or any other component to design unique presentations. The biggest advantage of this complete deck is that it can be personalized multiple times once downloaded. The color, design, shapes, and other elements are free to modify to add personal touches. You can also insert your logo design in this PPT layout. Therefore a well-thought and crafted presentation can be delivered with ease and precision by downloading this Consumer Segmentation Dashboard Ppt Powerpoint Presentation Complete Deck With Slides PPT slideshow. Our Consumer Segmentation Dashboard Ppt Powerpoint Presentation Complete Deck With Slides are topically designed to provide an attractive backdrop to any subject. Use them to look like a presentation pro.
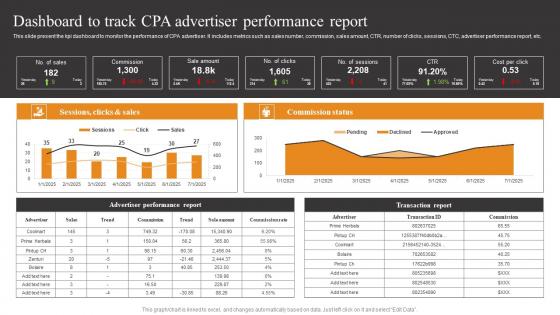
Dashboard To Track CPA Tactics To Optimize Corporate Performance Information Pdf
This slide present the kpi dashboard to monitor the performance of CPA advertiser. It includes metrics such as sales number, commission, sales amount, CTR, number of clicks, sessions, CTC, advertiser performance report, etc. Slidegeeks is here to make your presentations a breeze with Dashboard To Track CPA Tactics To Optimize Corporate Performance Information Pdf With our easy to use and customizable templates, you can focus on delivering your ideas rather than worrying about formatting. With a variety of designs to choose from, you are sure to find one that suits your needs. And with animations and unique photos, illustrations, and fonts, you can make your presentation pop. So whether you are giving a sales pitch or presenting to the board, make sure to check out Slidegeeks first. This slide present the kpi dashboard to monitor the performance of CPA advertiser. It includes metrics such as sales number, commission, sales amount, CTR, number of clicks, sessions, CTC, advertiser performance report, etc.
Optimizing Client Lead Handling Lead Generation Dashboard For Tracking Information Pdf
This slide covers the KPI dashboard for tracking lead conversion rates. It includes metrics such as visitors, average session rate, per visit, bounce rate, page views, etc. Make sure to capture your audiences attention in your business displays with our gratis customizable Optimizing Client Lead Handling Lead Generation Dashboard For Tracking Information Pdf. These are great for business strategies, office conferences, capital raising or task suggestions. If you desire to acquire more customers for your tech business and ensure they stay satisfied, create your own sales presentation with these plain slides. This slide covers the KPI dashboard for tracking lead conversion rates. It includes metrics such as visitors, average session rate, per visit, bounce rate, page views, etc.
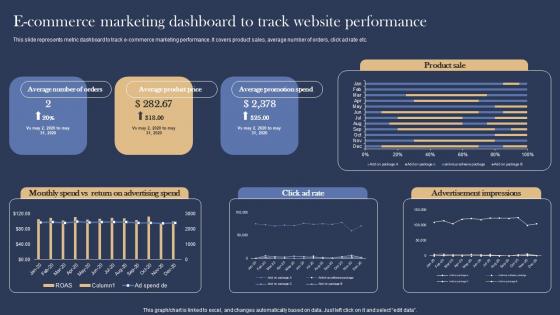
E Commerce Marketing Dashboard Management Marketing Strategies For E Commerce Information Pdf
This slide represents metric dashboard to track e commerce marketing performance. It covers product sales, average number of orders, click ad rate etc. This modern and well arranged E Commerce Marketing Dashboard Management Marketing Strategies For E Commerce Information Pdf provides lots of creative possibilities. It is very simple to customize and edit with the Powerpoint Software. Just drag and drop your pictures into the shapes. All facets of this template can be edited with Powerpoint, no extra software is necessary. Add your own material, put your images in the places assigned for them, adjust the colors, and then you can show your slides to the world, with an animated slide included. This slide represents metric dashboard to track e commerce marketing performance. It covers product sales, average number of orders, click ad rate etc.
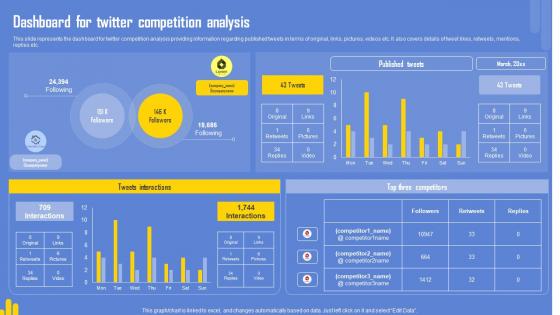
Optimizing Twitter For Online Dashboard For Twitter Competition Analysis Professional Pdf
This slide represents the dashboard for twitter competition analysis providing information regarding published tweets in terms of original, links, pictures, videos etc. It also covers details of tweet likes, retweets, mentions, replies etc. From laying roadmaps to briefing everything in detail, our templates are perfect for you. You can set the stage with your presentation slides. All you have to do is download these easy-to-edit and customizable templates. Optimizing Twitter For Online Dashboard For Twitter Competition Analysis Professional Pdf will help you deliver an outstanding performance that everyone would remember and praise you for. Do download this presentation today. This slide represents the dashboard for twitter competition analysis providing information regarding published tweets in terms of original, links, pictures, videos etc. It also covers details of tweet likes, retweets, mentions, replies etc.
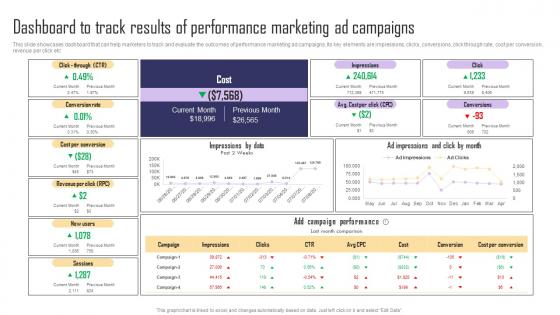
Dashboard To Track Results Of Performance Marketing Paid Internet Marketing Strategy Information Pdf
This slide showcases dashboard that can help marketers to track and evaluate the outcomes of performance marketing ad campaigns. Its key elements are impressions, clicks, conversions, click through rate, cost per conversion, revenue per click etc. Do you have an important presentation coming up Are you looking for something that will make your presentation stand out from the rest Look no further than Dashboard To Track Results Of Performance Marketing Paid Internet Marketing Strategy Information Pdf. With our professional designs, you can trust that your presentation will pop and make delivering it a smooth process. And with Slidegeeks, you can trust that your presentation will be unique and memorable. So why wait Grab Dashboard To Track Results Of Performance Marketing Paid Internet Marketing Strategy Information Pdf today and make your presentation stand out from the rest. This slide showcases dashboard that can help marketers to track and evaluate the outcomes of performance marketing ad campaigns. Its key elements are impressions, clicks, conversions, click through rate, cost per conversion, revenue per click etc.

Property Dealer Sales Dashboard By Power BI Ppt Presentation SS
The following slide showcases figures highlighting sustainability plans taken by corporates. It provides information about competitors, energy reduction, waste management, operations, employee retention, etc. Do you know about Slidesgeeks Property Dealer Sales Dashboard By Power BI Ppt Presentation SS These are perfect for delivering any kind od presentation. Using it, create PowerPoint presentations that communicate your ideas and engage audiences. Save time and effort by using our pre-designed presentation templates that are perfect for a wide range of topic. Our vast selection of designs covers a range of styles, from creative to business, and are all highly customizable and easy to edit. Download as a PowerPoint template or use them as Google Slides themes. The following slide showcases figures highlighting sustainability plans taken by corporates. It provides information about competitors, energy reduction, waste management, operations, employee retention, etc.
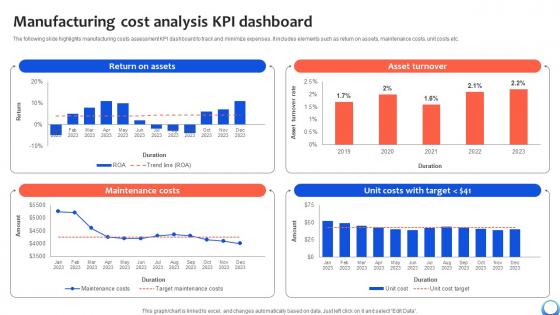
Manufacturing Cost Analysis KPI Dashboard Automating Production Process Strategy SS V
The following slide highlights manufacturing costs assessment KPI dashboard to track and minimize expenses. It includes elements such as return on assets, maintenance costs, unit costs etc. Make sure to capture your audiences attention in your business displays with our gratis customizable Manufacturing Cost Analysis KPI Dashboard Automating Production Process Strategy SS V. These are great for business strategies, office conferences, capital raising or task suggestions. If you desire to acquire more customers for your tech business and ensure they stay satisfied, create your own sales presentation with these plain slides. The following slide highlights manufacturing costs assessment KPI dashboard to track and minimize expenses. It includes elements such as return on assets, maintenance costs, unit costs etc.
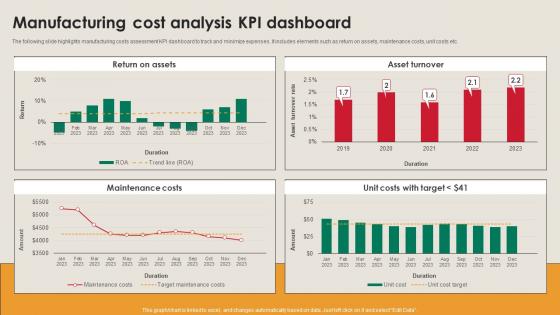
Manufacturing Cost Analysis KPI Dashboard Manufacturing Strategy Driving Industry 4 0
The following slide highlights manufacturing costs assessment KPI dashboard to track and minimize expenses. It includes elements such as return on assets, maintenance costs, unit costs etc. Find a pre-designed and impeccable Manufacturing Cost Analysis KPI Dashboard Manufacturing Strategy Driving Industry 4 0. The templates can ace your presentation without additional effort. You can download these easy-to-edit presentation templates to make your presentation stand out from others. So, what are you waiting for Download the template from Slidegeeks today and give a unique touch to your presentation. The following slide highlights manufacturing costs assessment KPI dashboard to track and minimize expenses. It includes elements such as return on assets, maintenance costs, unit costs etc.
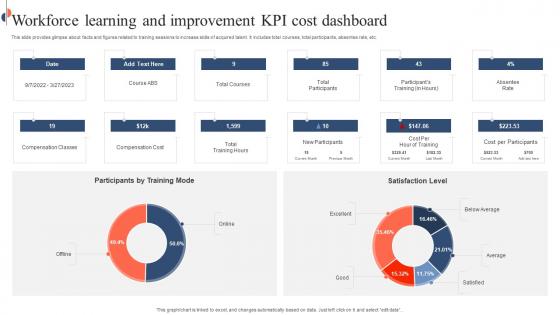
Workforce Learning And Improvement KPI Cost Dashboard Rules Pdf
This slide provides glimpse about facts and figures related to training sessions to increase skills of acquired talent. It includes total courses, total participants, absentee rate, etc. Pitch your topic with ease and precision using this Workforce Learning And Improvement KPI Cost Dashboard Rules Pdf. This layout presents information on Workforce Learning, Improvement KPI, Cost Dashboard. It is also available for immediate download and adjustment. So, changes can be made in the color, design, graphics or any other component to create a unique layout. This slide provides glimpse about facts and figures related to training sessions to increase skills of acquired talent. It includes total courses, total participants, absentee rate, etc.

Statistical Technique And Tools DMAIC Methodology To Maintain PPT PowerPoint
This slide shows main tools that are used in analysing phase for checking reliability of data. It include tools such as hypothesis testing, regression analysis and analysis of variance, etc. Here you can discover an assortment of the finest PowerPoint and Google Slides templates. With these templates, you can create presentations for a variety of purposes while simultaneously providing your audience with an eye-catching visual experience. Download Statistical Technique And Tools DMAIC Methodology To Maintain PPT PowerPoint to deliver an impeccable presentation. These templates will make your job of preparing presentations much quicker, yet still, maintain a high level of quality. Slidegeeks has experienced researchers who prepare these templates and write high-quality content for you. Later on, you can personalize the content by editing the Statistical Technique And Tools DMAIC Methodology To Maintain PPT PowerPoint. This slide shows main tools that are used in analysing phase for checking reliability of data. It include tools such as hypothesis testing, regression analysis and analysis of variance, etc.
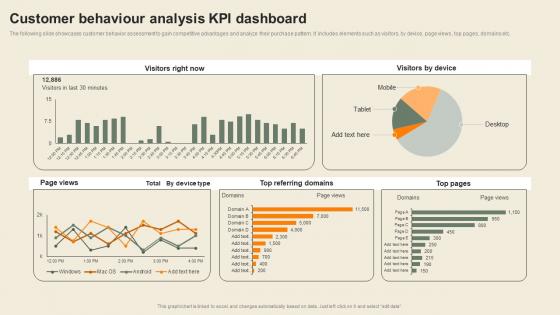
Customer Behaviour Analysis KPI Dashboard Usability Of CDP Software Tool Graphics Pdf
The following slide showcases customer behavior assessment to gain competitive advantages and analyze their purchase pattern. It includes elements such as visitors, by device, page views, top pages, domains etc. Do you have an important presentation coming up Are you looking for something that will make your presentation stand out from the rest Look no further than Customer Behaviour Analysis KPI Dashboard Usability Of CDP Software Tool Graphics Pdf. With our professional designs, you can trust that your presentation will pop and make delivering it a smooth process. And with Slidegeeks, you can trust that your presentation will be unique and memorable. So why wait Grab Customer Behaviour Analysis KPI Dashboard Usability Of CDP Software Tool Graphics Pdf today and make your presentation stand out from the rest The following slide showcases customer behavior assessment to gain competitive advantages and analyze their purchase pattern. It includes elements such as visitors, by device, page views, top pages, domains etc.
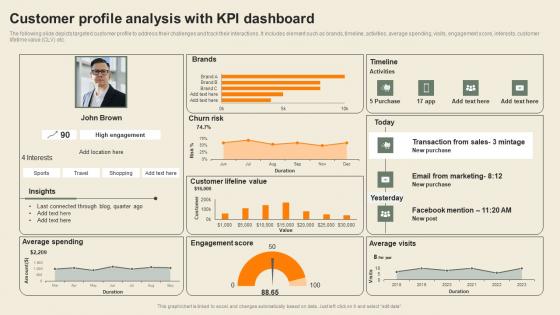
Customer Profile Analysis With KPI Dashboard Usability Of CDP Software Tool Ideas Pdf
The following slide depicts targeted customer profile to address their challenges and track their interactions. It includes element such as brands, timeline, activities, average spending, visits, engagement score, interests, customer lifetime value CLV etc. Crafting an eye-catching presentation has never been more straightforward. Let your presentation shine with this tasteful yet straightforward Customer Profile Analysis With KPI Dashboard Usability Of CDP Software Tool Ideas Pdf template. It offers a minimalistic and classy look that is great for making a statement. The colors have been employed intelligently to add a bit of playfulness while still remaining professional. Construct the ideal Customer Profile Analysis With KPI Dashboard Usability Of CDP Software Tool Ideas Pdf that effortlessly grabs the attention of your audience Begin now and be certain to wow your customers The following slide depicts targeted customer profile to address their challenges and track their interactions. It includes element such as brands, timeline, activities, average spending, visits, engagement score, interests, customer lifetime value CLV etc.
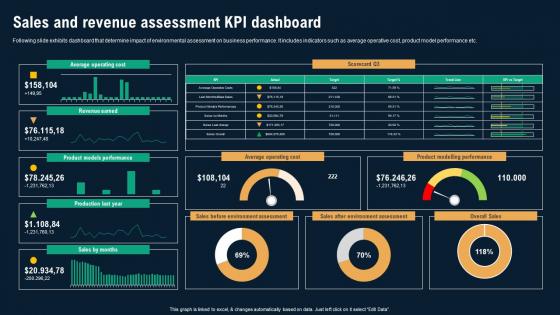
Sales And Revenue Assessment KPI Dashboard Business Environmental Analysis Ideas Pdf
Following slide exhibits dashboard that determine impact of environmental assessment on business performance. It includes indicators such as average operative cost, product model performance etc. There are so many reasons you need a Sales And Revenue Assessment KPI Dashboard Business Environmental Analysis Ideas Pdf The first reason is you can not spend time making everything from scratch, Thus, Slidegeeks has made presentation templates for you too. You can easily download these templates from our website easily. Following slide exhibits dashboard that determine impact of environmental assessment on business performance. It includes indicators such as average operative cost, product model performance etc.
Learning And Improvement KPI Dashboard Ppt Powerpoint Presentation Complete Deck With Slides
This Learning And Improvement KPI Dashboard Ppt Powerpoint Presentation Complete Deck With Slides acts as backup support for your ideas, vision, thoughts, etc. Use it to present a thorough understanding of the topic. This PPT slideshow can be utilized for both in-house and outside presentations depending upon your needs and business demands. Entailing fourteen slides with a consistent design and theme, this template will make a solid use case. As it is intuitively designed, it suits every business vertical and industry. All you have to do is make a few tweaks in the content or any other component to design unique presentations. The biggest advantage of this complete deck is that it can be personalized multiple times once downloaded. The color, design, shapes, and other elements are free to modify to add personal touches. You can also insert your logo design in this PPT layout. Therefore a well-thought and crafted presentation can be delivered with ease and precision by downloading this Learning And Improvement KPI Dashboard Ppt Powerpoint Presentation Complete Deck With Slides PPT slideshow. Our Learning And Improvement KPI Dashboard Ppt Powerpoint Presentation Complete Deck With Slides are topically designed to provide an attractive backdrop to any subject. Use them to look like a presentation pro.

Statistical Technique And Tools Lean Six Sigma In Manufacturing Ppt Template
This slide shows main tools that are used in analysing phase for checking reliability of data. It include tools such as hypothesis testing, regression analysis and analysis of variance, etc. Are you in need of a template that can accommodate all of your creative concepts This one is crafted professionally and can be altered to fit any style. Use it with Google Slides or PowerPoint. Include striking photographs, symbols, depictions, and other visuals. Fill, move around, or remove text boxes as desired. Test out color palettes and font mixtures. Edit and save your work, or work with colleagues. Download Statistical Technique And Tools Lean Six Sigma In Manufacturing Ppt Template and observe how to make your presentation outstanding. Give an impeccable presentation to your group and make your presentation unforgettable. This slide shows main tools that are used in analysing phase for checking reliability of data. It include tools such as hypothesis testing, regression analysis and analysis of variance, etc.
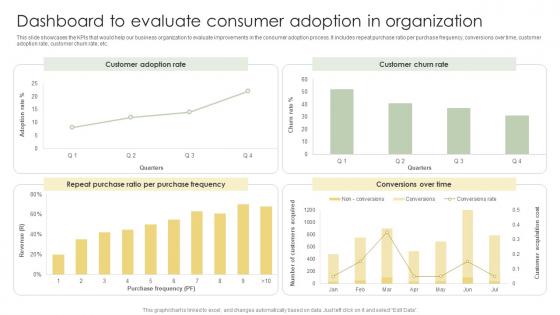
Dashboard To Evaluate Consumer Adoption In Organization Analyzing Customer Adoption Information Pdf
This slide showcases the KPIs that would help our business organization to evaluate improvements in the consumer adoption process. It includes repeat purchase ratio per purchase frequency, conversions over time, customer adoption rate, customer churn rate, etc.Slidegeeks is here to make your presentations a breeze with Dashboard To Evaluate Consumer Adoption In Organization Analyzing Customer Adoption Information Pdf With our easy-to-use and customizable templates, you can focus on delivering your ideas rather than worrying about formatting. With a variety of designs to choose from, you are sure to find one that suits your needs. And with animations and unique photos, illustrations, and fonts, you can make your presentation pop. So whether you are giving a sales pitch or presenting to the board, make sure to check out Slidegeeks first. This slide showcases the KPIs that would help our business organization to evaluate improvements in the consumer adoption process. It includes repeat purchase ratio per purchase frequency, conversions over time, customer adoption rate, customer churn rate, etc.
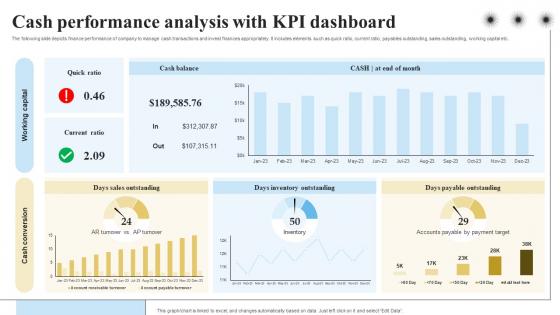
Cash Performance Analysis With KPI Dashboard Objectives And Key Result Methodology For Business
The following slide depicts finance performance of company to manage cash transactions and invest finances appropriately. It includes elements such as quick ratio, current ratio, payables outstanding, sales outstanding, working capital etc. Do you have to make sure that everyone on your team knows about any specific topic I yes, then you should give Cash Performance Analysis With KPI Dashboard Objectives And Key Result Methodology For Business a try. Our experts have put a lot of knowledge and effort into creating this impeccable Cash Performance Analysis With KPI Dashboard Objectives And Key Result Methodology For Business. You can use this template for your upcoming presentations, as the slides are perfect to represent even the tiniest detail. You can download these templates from the Slidegeeks website and these are easy to edit. So grab these today The following slide depicts finance performance of company to manage cash transactions and invest finances appropriately. It includes elements such as quick ratio, current ratio, payables outstanding, sales outstanding, working capital etc.
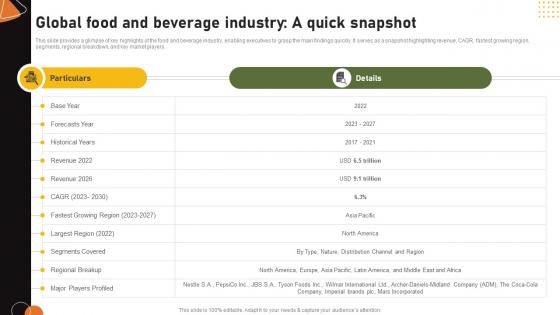
Food And Drink Industry Report Global Food And Beverage Industry A Quick Snapshot IR SS V
This slide provides a glimpse of key highlights of the food and beverage industry, enabling executives to grasp the main findings quickly. It serves as a snapshot highlighting revenue, CAGR, fastest growing region, segments, regional breakdown, and key market players. If you are looking for a format to display your unique thoughts, then the professionally designed Food And Drink Industry Report Global Food And Beverage Industry A Quick Snapshot IR SS V is the one for you. You can use it as a Google Slides template or a PowerPoint template. Incorporate impressive visuals, symbols, images, and other charts. Modify or reorganize the text boxes as you desire. Experiment with shade schemes and font pairings. Alter, share or cooperate with other people on your work. Download Food And Drink Industry Report Global Food And Beverage Industry A Quick Snapshot IR SS V and find out how to give a successful presentation. Present a perfect display to your team and make your presentation unforgettable. This slide provides a glimpse of key highlights of the food and beverage industry, enabling executives to grasp the main findings quickly. It serves as a snapshot highlighting revenue, CAGR, fastest growing region, segments, regional breakdown, and key market players.
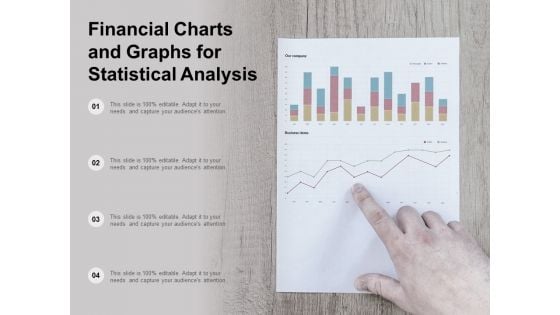
Financial Charts And Graphs For Statistical Analysis Ppt Powerpoint Presentation Show Layout
This is a financial charts and graphs for statistical analysis ppt powerpoint presentation show layout. This is a four stage process. The stages in this process are business metrics, business kpi, business dashboard.
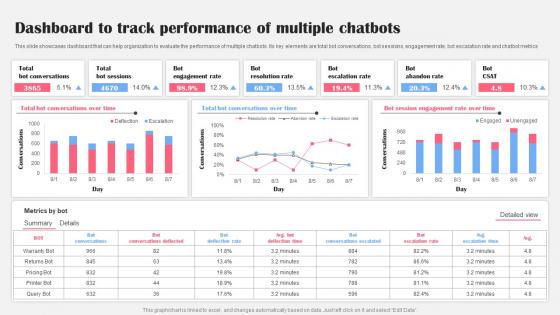
Dashboard To Track Performance Multiple AI Bot Application For Various Industries Demonstration Pdf
This slide showcases dashboard that can help organization to evaluate the performance of multiple chatbots. Its key elements are total bot conversations, bot sessions, engagement rate, bot escalation rate and chatbot metrics Are you searching for a Dashboard To Track Performance Multiple AI Bot Application For Various Industries Demonstration Pdf that is uncluttered, straightforward, and original Its easy to edit, and you can change the colors to suit your personal or business branding. For a presentation that expresses how much effort you have put in, this template is ideal With all of its features, including tables, diagrams, statistics, and lists, its perfect for a business plan presentation. Make your ideas more appealing with these professional slides. Download Dashboard To Track Performance Multiple AI Bot Application For Various Industries Demonstration Pdf from Slidegeeks today. This slide showcases dashboard that can help organization to evaluate the performance of multiple chatbots. Its key elements are total bot conversations, bot sessions, engagement rate, bot escalation rate and chatbot metrics
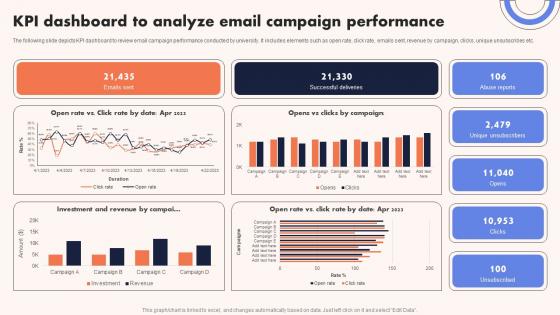
University Marketing Guide KPI Dashboard To Analyze Email Campaign Performance Strategy SS V
The following slide depicts KPI dashboard to review email campaign performance conducted by university. It includes elements such as open rate, click rate, emails sent, revenue by campaign, clicks, unique unsubscribes etc. Are you searching for a University Marketing Guide KPI Dashboard To Analyze Email Campaign Performance Strategy SS V that is uncluttered, straightforward, and original Its easy to edit, and you can change the colors to suit your personal or business branding. For a presentation that expresses how much effort you have put in, this template is ideal With all of its features, including tables, diagrams, statistics, and lists, its perfect for a business plan presentation. Make your ideas more appealing with these professional slides. Download University Marketing Guide KPI Dashboard To Analyze Email Campaign Performance Strategy SS V from Slidegeeks today. The following slide depicts KPI dashboard to review email campaign performance conducted by university. It includes elements such as open rate, click rate, emails sent, revenue by campaign, clicks, unique unsubscribes etc.
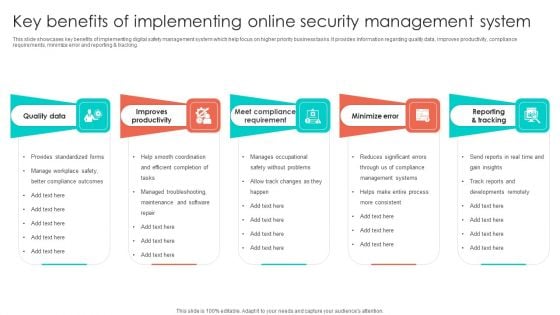
Key Benefits Of Implementing Online Security Management System Infographics PDF
This slide showcases key benefits of implementing digital safety management system which help focus on higher priority business tasks. It provides information regarding quality data, improves productivity, compliance requirements, minimize error and reporting and tracking. Presenting Key Benefits Of Implementing Online Security Management System Infographics PDF to dispense important information. This template comprises five stages. It also presents valuable insights into the topics including Improves Productivity, Quality Data, Minimize Error. This is a completely customizable PowerPoint theme that can be put to use immediately. So, download it and address the topic impactfully.
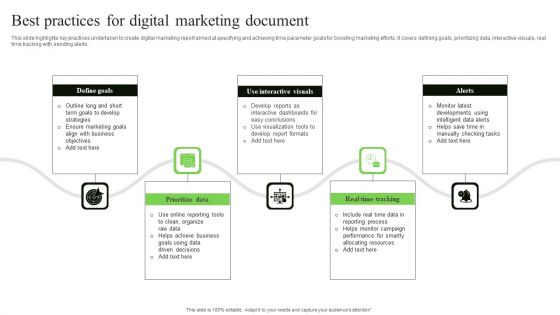
Best Practices For Digital Marketing Document Ideas PDF
This slide highlights key practices undertaken to create digital marketing report aimed at specifying and achieving time parameter goals for boosting marketing efforts. It covers defining goals, prioritizing data, interactive visuals, real time tracking with sending alerts. Presenting Best Practices For Digital Marketing Document Ideas PDF to dispense important information. This template comprises five stages. It also presents valuable insights into the topics including Define Goals, Prioritize Data, Use Interactive Visuals. This is a completely customizable PowerPoint theme that can be put to use immediately. So, download it and address the topic impactfully.

Consumer Segmentation And Monitoring Dashboard Mockup Pdf
This slide showcases a dashboard for customer segmentation based on recency, frequency and monetary analysis. It includes key segments such as loyalist, potential, churn, lost and potential. Showcasing this set of slides titled Consumer Segmentation And Monitoring Dashboard Mockup Pdf. The topics addressed in these templates are Consumer Segmentation, Monitoring Dashboard, Potential, Churn. All the content presented in this PPT design is completely editable. Download it and make adjustments in color, background, font etc. as per your unique business setting. This slide showcases a dashboard for customer segmentation based on recency, frequency and monetary analysis. It includes key segments such as loyalist, potential, churn, lost and potential.
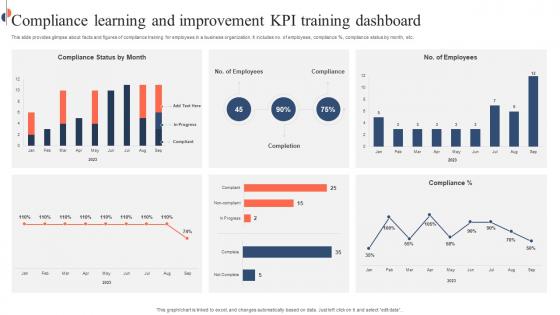
Compliance Learning And Improvement KPI Training Dashboard Sample Pdf
This slide provides glimpse about facts and figures of compliance training for employees in a business organization. It includes no. of employees, compliance percent, compliance status by month, etc. Pitch your topic with ease and precision using this Compliance Learning And Improvement KPI Training Dashboard Sample Pdf. This layout presents information on Compliance Learning, Improvement KPI, Training Dashboard, Compliance Training. It is also available for immediate download and adjustment. So, changes can be made in the color, design, graphics or any other component to create a unique layout. This slide provides glimpse about facts and figures of compliance training for employees in a business organization. It includes no. of employees, compliance percent, compliance status by month, etc.
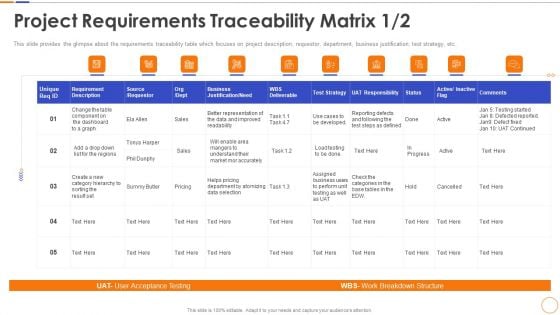
Project Requirements Traceability Matrix Strategy Diagrams PDF
This slide provides the glimpse about the requirements traceability table which focuses on project description, requestor, department, business justification, test strategy, etc. Deliver and pitch your topic in the best possible manner with this project requirements traceability matrix strategy diagrams pdf. Use them to share invaluable insights on dashboard, data, requirement, strategy and impress your audience. This template can be altered and modified as per your expectations. So, grab it now.

Cybersecurity Dashboard For ABS Healthcare Company Ppt Themes PDF
This slide shows a cybersecurity dashboard with KPIs such as total cybersecurity cases in company in 2021, total records stoles, malware cases resolved, operational efficiency, mean time to resolve threats etc. Presentingcybersecurity dashboard for abs healthcare company ppt themes pdf to provide visual cues and insights. Share and navigate important information on eight stages that need your due attention. This template can be used to pitch topics like phishing attacks 2021, records stolen 2021, malware cases resolved 2021, malware attacks 2021, hacking incidents 2021. In addtion, this PPT design contains high resolution images, graphics, etc, that are easily editable and available for immediate download.
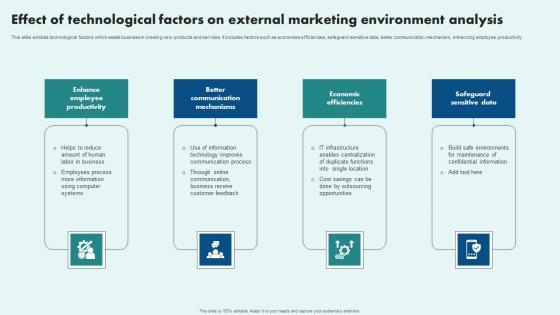
Effect Of Technological Factors On External Marketing Environment Analysis Themes Pdf
This slide exhibits technological factors which assist business in creating new products and services. It includes factors such as economies efficiencies, safeguard sensitive data, better communication mechanism, enhancing employee productivity Showcasing this set of slides titled Effect Of Technological Factors On External Marketing Environment Analysis Themes Pdf. The topics addressed in these templates are Enhance Employee Productivity, Better Communication Mechanisms, Economic Efficiencies. All the content presented in this PPT design is completely editable. Download it and make adjustments in color, background, font etc. as per your unique business setting. This slide exhibits technological factors which assist business in creating new products and services. It includes factors such as economies efficiencies, safeguard sensitive data, better communication mechanism, enhancing employee productivity
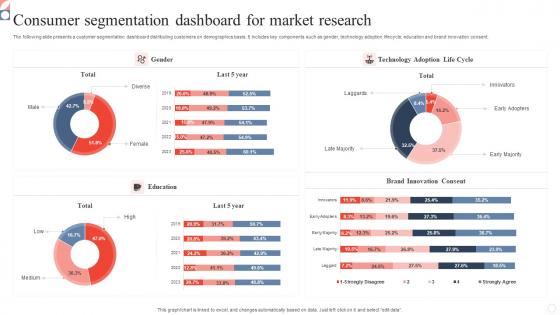
Consumer Segmentation Dashboard For Market Research Formats Pdf
The following slide presents a customer segmentation dashboard distributing customers on demographics basis. It includes key components such as gender, technology adoption lifecycle, education and brand innovation consent. Pitch your topic with ease and precision using this Consumer Segmentation Dashboard For Market Research Formats Pdf. This layout presents information on Consumer Segmentation Dashboard, Market Research, Technology Adoption Lifecycle. It is also available for immediate download and adjustment. So, changes can be made in the color, design, graphics or any other component to create a unique layout. The following slide presents a customer segmentation dashboard distributing customers on demographics basis. It includes key components such as gender, technology adoption lifecycle, education and brand innovation consent.
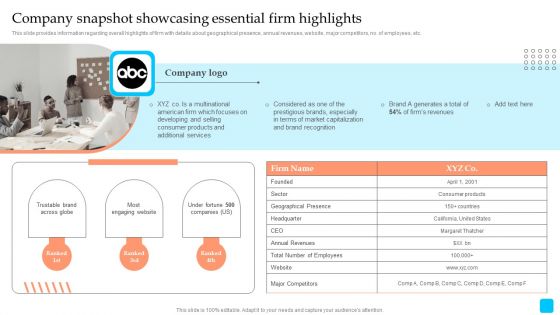
Strategic Toolkit To Administer Brand Image Company Snapshot Showcasing Essential Firm Highlights Sample PDF
This slide provides information regarding overall highlights of firm with details about geographical presence, annual revenues, website, major competitors, no. of employees, etc. Whether you have daily or monthly meetings, a brilliant presentation is necessary. Strategic Toolkit To Administer Brand Image Company Snapshot Showcasing Essential Firm Highlights Sample PDF can be your best option for delivering a presentation. Represent everything in detail using Strategic Toolkit To Administer Brand Image Company Snapshot Showcasing Essential Firm Highlights Sample PDF and make yourself stand out in meetings. The template is versatile and follows a structure that will cater to your requirements. All the templates prepared by Slidegeeks are easy to download and edit. Our research experts have taken care of the corporate themes as well. So, give it a try and see the results.
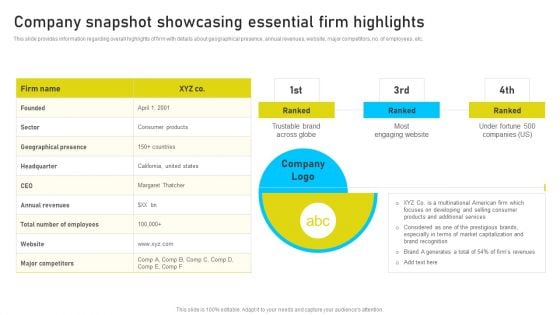
Brand Identity Management Toolkit Company Snapshot Showcasing Essential Firm Highlights Mockup PDF
This slide provides information regarding overall highlights of firm with details about geographical presence, annual revenues, website, major competitors, no. of employees, etc. Whether you have daily or monthly meetings, a brilliant presentation is necessary. Brand Identity Management Toolkit Company Snapshot Showcasing Essential Firm Highlights Mockup PDF can be your best option for delivering a presentation. Represent everything in detail using Brand Identity Management Toolkit Company Snapshot Showcasing Essential Firm Highlights Mockup PDF and make yourself stand out in meetings. The template is versatile and follows a structure that will cater to your requirements. All the templates prepared by Slidegeeks are easy to download and edit. Our research experts have taken care of the corporate themes as well. So, give it a try and see the results.
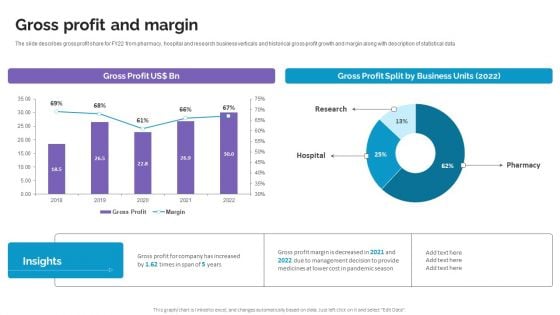
Gross Profit And Margin Life Science And Healthcare Solutions Company Profile Slides PDF
The slide describes gross profit share for FY22 from pharmacy, hospital and research business verticals and historical gross profit growth and margin along with description of statistical data. This Gross Profit And Margin Life Science And Healthcare Solutions Company Profile Slides PDF from Slidegeeks makes it easy to present information on your topic with precision. It provides customization options, so you can make changes to the colors, design, graphics, or any other component to create a unique layout. It is also available for immediate download, so you can begin using it right away. Slidegeeks has done good research to ensure that you have everything you need to make your presentation stand out. Make a name out there for a brilliant performance.
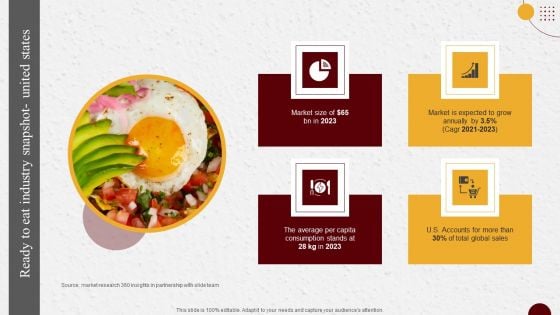
Industry Report Of Packaged Food Products Part 1 Ready To Eat Industry Snapshot United States Elements PDF
Are you searching for a Industry Report Of Packaged Food Products Part 1 Ready To Eat Industry Snapshot United States Elements PDF that is uncluttered, straightforward, and original Its easy to edit, and you can change the colors to suit your personal or business branding. For a presentation that expresses how much effort you have put in, this template is ideal. With all of its features, including tables, diagrams, statistics, and lists, its perfect for a business plan presentation. Make your ideas more appealing with these professional slides. Download Industry Report Of Packaged Food Products Part 1 Ready To Eat Industry Snapshot United States Elements PDF from Slidegeeks today.
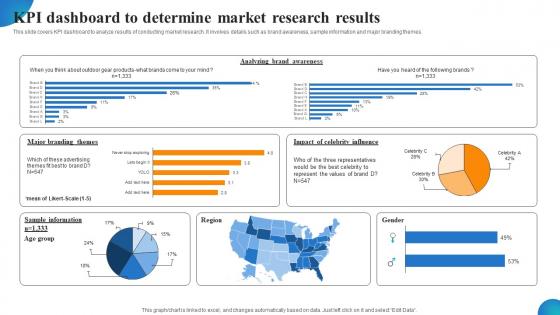
KPI Dashboard To Determine Market Research Results MDSS For Enhanced Ideas Pdf
This slide covers KPI dashboard to analyze results of conducting market research. It involves details such as brand awareness, sample information and major branding themes. If you are looking for a format to display your unique thoughts, then the professionally designed KPI Dashboard To Determine Market Research Results MDSS For Enhanced Ideas Pdf is the one for you. You can use it as a Google Slides template or a PowerPoint template. Incorporate impressive visuals, symbols, images, and other charts. Modify or reorganize the text boxes as you desire. Experiment with shade schemes and font pairings. Alter, share or cooperate with other people on your work. Download KPI Dashboard To Determine Market Research Results MDSS For Enhanced Ideas Pdf and find out how to give a successful presentation. Present a perfect display to your team and make your presentation unforgettable. This slide covers KPI dashboard to analyze results of conducting market research. It involves details such as brand awareness, sample information and major branding themes.
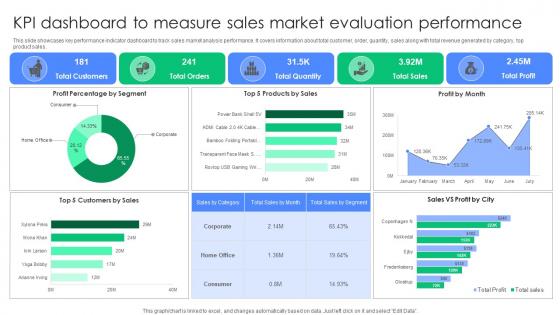
KPI Dashboard To Measure Sales Market Evaluation Performance Summary Pdf
This slide showcases key performance indicator dashboard to track sales market analysis performance. It covers information about total customer, order, quantity, sales along with total revenue generated by category, top product sales. Pitch your topic with ease and precision using this KPI Dashboard To Measure Sales Market Evaluation Performance Summary Pdf. This layout presents information on Profit Percentage Segment, Products Sales, Profit Month. It is also available for immediate download and adjustment. So, changes can be made in the color, design, graphics or any other component to create a unique layout. This slide showcases key performance indicator dashboard to track sales market analysis performance. It covers information about total customer, order, quantity, sales along with total revenue generated by category, top product sales.

Real Time Content Marketing Result Dashboard Ppt Infographic Template Example PDF
The following slide depicts real time content marketing KPI dashboard to monitor traffic flow and manage promotional efforts. It includes elements such as visitors by channel, conversion rate, search, direct, sessions, average time engaged etc. The Real Time Content Marketing Result Dashboard Ppt Infographic Template Example PDF is a compilation of the most recent design trends as a series of slides. It is suitable for any subject or industry presentation, containing attractive visuals and photo spots for businesses to clearly express their messages. This template contains a variety of slides for the user to input data, such as structures to contrast two elements, bullet points, and slides for written information. Slidegeeks is prepared to create an impression.
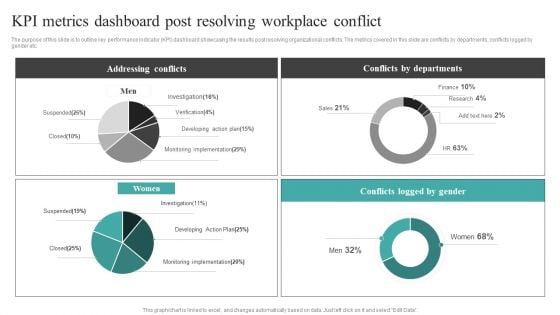
Common Conflict Situations Kpi Metrics Dashboard Post Resolving Workplace Information PDF
The purpose of this slide is to outline key performance indicator KPI dashboard showcasing the results post resolving organizational conflicts. The metrics covered in this slide are conflicts by departments, conflicts logged by gender etc. The Common Conflict Situations Kpi Metrics Dashboard Post Resolving Workplace Information PDF is a compilation of the most recent design trends as a series of slides. It is suitable for any subject or industry presentation, containing attractive visuals and photo spots for businesses to clearly express their messages. This template contains a variety of slides for the user to input data, such as structures to contrast two elements, bullet points, and slides for written information. Slidegeeks is prepared to create an impression.
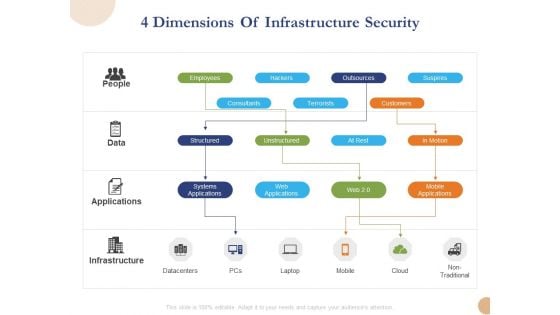
Substructure Segment Analysis 4 Dimensions Of Infrastructure Security Ppt Portfolio
This is a substructure segment analysis 4 dimensions of infrastructure security ppt portfolio template with various stages. Focus and dispense information on four stages using this creative set, that comes with editable features. It contains large content boxes to add your information on topics like people, data, applications, infrastructure. You can also showcase facts, figures, and other relevant content using this PPT layout. Grab it now.
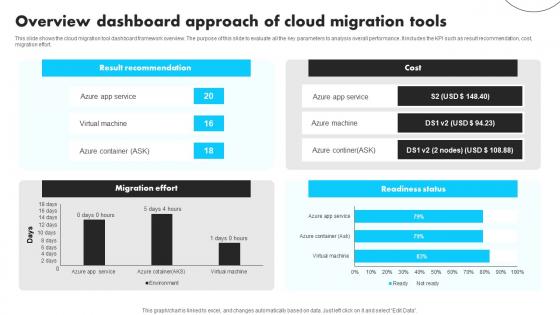
Overview Dashboard Approach Of Cloud Migration Tools Graphics Pdf
This slide shows the cloud migration tool dashboard framework overview. The purpose of this slide to evaluate all the key parameters to analysis overall performance .It includes the KPI such as result recommendation, cost, migration effort. Showcasing this set of slides titled Overview Dashboard Approach Of Cloud Migration Tools Graphics Pdf The topics addressed in these templates are Result Recommendation, Migration Effort, Readiness Status All the content presented in this PPT design is completely editable. Download it and make adjustments in color, background, font etc. as per your unique business setting. This slide shows the cloud migration tool dashboard framework overview. The purpose of this slide to evaluate all the key parameters to analysis overall performance .It includes the KPI such as result recommendation, cost, migration effort.
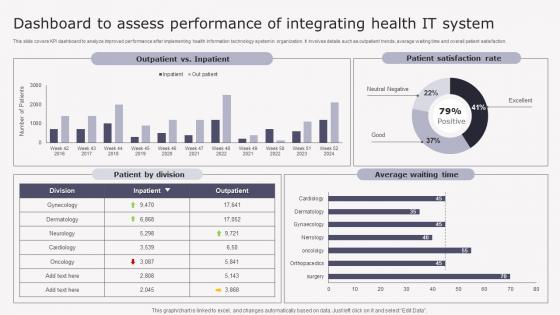
Transforming Medicare Services Using Health Dashboard To Assess Performance Introduction Pdf
This slide covers KPI dashboard to analyze improved performance after implementing health information technology system in organization. It involves details such as outpatient trends, average waiting time and overall patient satisfaction. Do you have to make sure that everyone on your team knows about any specific topic I yes, then you should give Transforming Medicare Services Using Health Dashboard To Assess Performance Introduction Pdf a try. Our experts have put a lot of knowledge and effort into creating this impeccable Transforming Medicare Services Using Health Dashboard To Assess Performance Introduction Pdf. You can use this template for your upcoming presentations, as the slides are perfect to represent even the tiniest detail. You can download these templates from the Slidegeeks website and these are easy to edit. So grab these today This slide covers KPI dashboard to analyze improved performance after implementing health information technology system in organization. It involves details such as outpatient trends, average waiting time and overall patient satisfaction.
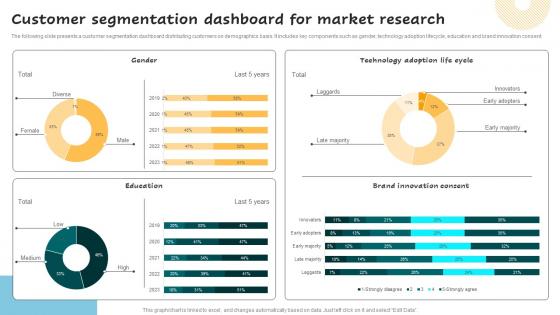
Customer Segmentation Dashboard Successful Guide For Market Segmentation Background Pdf
The following slide presents a customer segmentation dashboard distributing customers on demographics basis. It includes key components such as gender, technology adoption lifecycle, education and brand innovation consent. Do you have to make sure that everyone on your team knows about any specific topic I yes, then you should give Customer Segmentation Dashboard Successful Guide For Market Segmentation Background Pdf a try. Our experts have put a lot of knowledge and effort into creating this impeccable Customer Segmentation Dashboard Successful Guide For Market Segmentation Background Pdf. You can use this template for your upcoming presentations, as the slides are perfect to represent even the tiniest detail. You can download these templates from the Slidegeeks website and these are easy to edit. So grab these today. The following slide presents a customer segmentation dashboard distributing customers on demographics basis. It includes key components such as gender, technology adoption lifecycle, education and brand innovation consent.
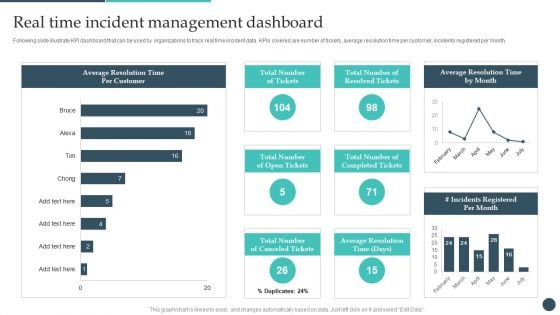
Safety Breach Response Playbook Real Time Incident Management Dashboard Formats PDF
Following slide illustrate KPI dashboard that can be used by organizations to track real time incident data. KPIs covered are number of tickets, average resolution time per customer, incidents registered per month. Find highly impressive Safety Breach Response Playbook Real Time Incident Management Dashboard Formats PDF on Slidegeeks to deliver a meaningful presentation. You can save an ample amount of time using these presentation templates. No need to worry to prepare everything from scratch because Slidegeeks experts have already done a huge research and work for you. You need to download Safety Breach Response Playbook Real Time Incident Management Dashboard Formats PDF for your upcoming presentation. All the presentation templates are 100 percent editable and you can change the color and personalize the content accordingly. Download now.

Client Self Service Metric Dashboard Brochure Pdf
The following slide highlights dashboard for customer self service to limit repetitive questions and facilitate support staff to handle complex issues. It includes components such as self service score, unique customers who survey help content, unique customers who produced tickets etc. Pitch your topic with ease and precision using this Client Self Service Metric Dashboard Brochure Pdf. This layout presents information on Self Service Score, Published, Content Type. It is also available for immediate download and adjustment. So, changes can be made in the color, design, graphics or any other component to create a unique layout. The following slide highlights dashboard for customer self service to limit repetitive questions and facilitate support staff to handle complex issues. It includes components such as self service score, unique customers who survey help content, unique customers who produced tickets etc.
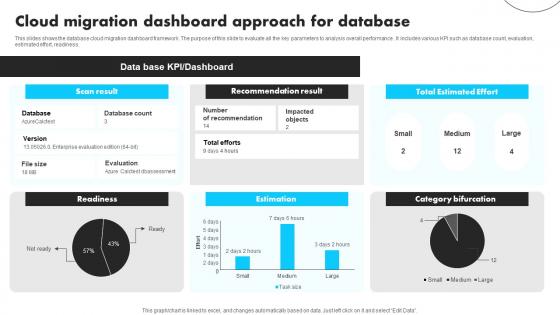
Cloud Migration Dashboard Approach For Database Guidelines Pdf
This slides shows the database cloud migration dashboard framework. The purpose of this slide to evaluate all the key parameters to analysis overall performance . It includes various KPI such as database count, evaluation, estimated effort, readiness. Pitch your topic with ease and precision using this Cloud Migration Dashboard Approach For Database Guidelines Pdf This layout presents information on Recommendation Result, Total Estimated Effort, Estimation It is also available for immediate download and adjustment. So, changes can be made in the color, design, graphics or any other component to create a unique layout. This slides shows the database cloud migration dashboard framework. The purpose of this slide to evaluate all the key parameters to analysis overall performance . It includes various KPI such as database count, evaluation, estimated effort, readiness.
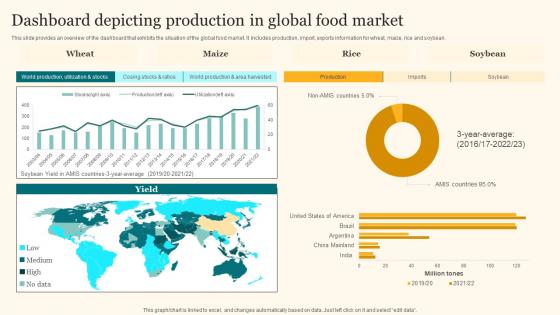
Dashboard Depicting Production In Global Agricultural Product Promotion Template Pdf
This slide provides an overview of the dashboard that exhibits the situation of the global food market. It includes production, import, exports information for wheat, maize, rice and soybean. Are you in need of a template that can accommodate all of your creative concepts This one is crafted professionally and can be altered to fit any style. Use it with Google Slides or PowerPoint. Include striking photographs, symbols, depictions, and other visuals. Fill, move around, or remove text boxes as desired. Test out color palettes and font mixtures. Edit and save your work, or work with colleagues. Download Dashboard Depicting Production In Global Agricultural Product Promotion Template Pdf and observe how to make your presentation outstanding. Give an impeccable presentation to your group and make your presentation unforgettable. This slide provides an overview of the dashboard that exhibits the situation of the global food market. It includes production, import, exports information for wheat, maize, rice and soybean.
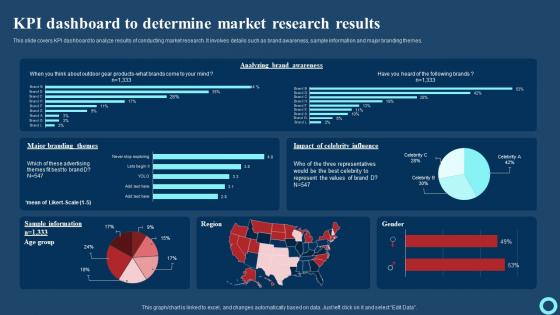
KPI Dashboard To Determine Market Research Results Effective Strategies To Enhance Structure Pdf
This slide covers KPI dashboard to analyze results of conducting market research. It involves details such as brand awareness, sample information and major branding themes. Do you have an important presentation coming up Are you looking for something that will make your presentation stand out from the rest Look no further than KPI Dashboard To Determine Market Research Results Effective Strategies To Enhance Structure Pdf With our professional designs, you can trust that your presentation will pop and make delivering it a smooth process. And with Slidegeeks, you can trust that your presentation will be unique and memorable. So why wait Grab KPI Dashboard To Determine Market Research Results Effective Strategies To Enhance Structure Pdf today and make your presentation stand out from the rest. This slide covers KPI dashboard to analyze results of conducting market research. It involves details such as brand awareness, sample information and major branding themes.
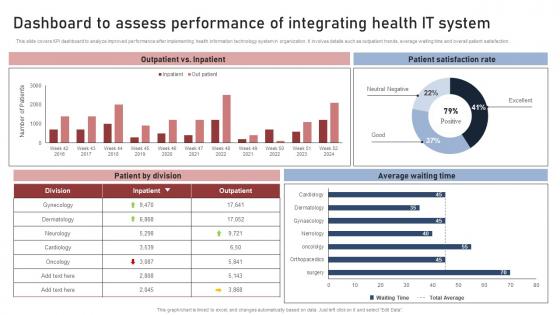
Dashboard To Assess Performance Transforming Medical Workflows Via His Integration Elements Pdf
This slide covers KPI dashboard to analyze improved performance after implementing health information technology system in organization. It involves details such as outpatient trends, average waiting time and overall patient satisfaction. Present like a pro with Dashboard To Assess Performance Transforming Medical Workflows Via His Integration Elements Pdf Create beautiful presentations together with your team, using our easy to use presentation slides. Share your ideas in real time and make changes on the fly by downloading our templates. So whether you are in the office, on the go, or in a remote location, you can stay in sync with your team and present your ideas with confidence. With Slidegeeks presentation got a whole lot easier. Grab these presentations today. This slide covers KPI dashboard to analyze improved performance after implementing health information technology system in organization. It involves details such as outpatient trends, average waiting time and overall patient satisfaction.
Product Branding Performance Tracking Dashboard Leveraging Corporate Guidelines Pdf
This slide provides information regarding product branding performance tracking dashboard in terms of revenues, new customers, customer satisfaction rate. Do you know about Slidesgeeks Product Branding Performance Tracking Dashboard Leveraging Corporate Guidelines Pdf These are perfect for delivering any kind od presentation. Using it, create PowerPoint presentations that communicate your ideas and engage audiences. Save time and effort by using our pre-designed presentation templates that are perfect for a wide range of topic. Our vast selection of designs covers a range of styles, from creative to business, and are all highly customizable and easy to edit. Download as a PowerPoint template or use them as Google Slides themes. This slide provides information regarding product branding performance tracking dashboard in terms of revenues, new customers, customer satisfaction rate.


 Continue with Email

 Home
Home


