Data Analytics Icons
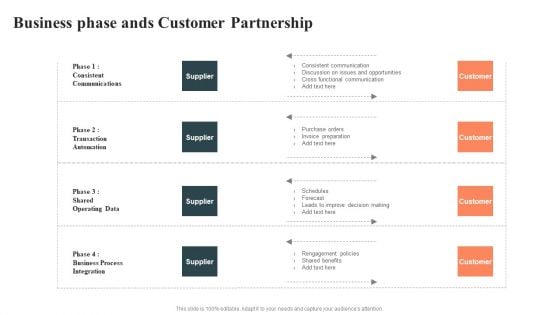
Business Phase Ands Customer Partnership Formats PDF
Pitch your topic with ease and precision using this Business Phase Ands Customer Partnership Formats PDF. This layout presents information on Supplier, Cross Functional Communication, Operating Data. It is also available for immediate download and adjustment. So, changes can be made in the color, design, graphics or any other component to create a unique layout.
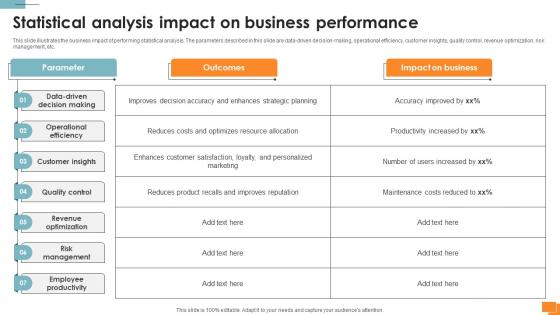
Statistical Tools For Evidence Statistical Analysis Impact On Business Performance
This slide illustrates the business impact of performing statistical analysis. The parameters described in this slide are data-driven decision-making, operational efficiency, customer insights, quality control, revenue optimization, risk management, etc. Do you know about Slidesgeeks Statistical Tools For Evidence Statistical Analysis Impact On Business Performance These are perfect for delivering any kind od presentation. Using it, create PowerPoint presentations that communicate your ideas and engage audiences. Save time and effort by using our pre-designed presentation templates that are perfect for a wide range of topic. Our vast selection of designs covers a range of styles, from creative to business, and are all highly customizable and easy to edit. Download as a PowerPoint template or use them as Google Slides themes. This slide illustrates the business impact of performing statistical analysis. The parameters described in this slide are data-driven decision-making, operational efficiency, customer insights, quality control, revenue optimization, risk management, etc.
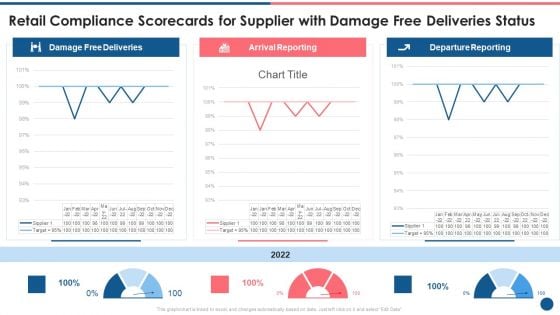
Supplier Scorecard Retail Compliance Scorecards For Supplier With Damage Free Deliveries Status Sample PDF
This graph or chart is linked to excel, and changes automatically based on data. Just left click on it and select Edit Data. Deliver and pitch your topic in the best possible manner with this supplier scorecard retail compliance scorecards for supplier with damage free deliveries status sample pdf. Use them to share invaluable insights on damage free deliveries, arrival reporting, departure reporting and impress your audience. This template can be altered and modified as per your expectations. So, grab it now.
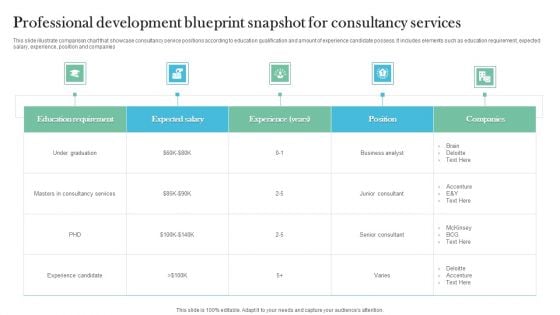
Professional Development Blueprint Snapshot For Consultancy Services Microsoft PDF
This slide illustrate comparison chart that showcase consultancy service positions according to education qualification and amount of experience candidate possess. It includes elements such as education requirement, expected salary, experience, position and companies. Pitch your topic with ease and precision using this Professional Development Blueprint Snapshot For Consultancy Services Microsoft PDF. This layout presents information on Consultancy Services, Education Requirement, Business Analyst. It is also available for immediate download and adjustment. So, changes can be made in the color, design, graphics or any other component to create a unique layout.
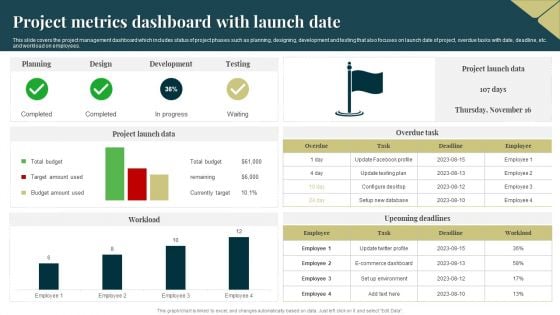
Project Metrics Dashboard With Launch Date Formats PDF
This slide covers the project management dashboard which includes status of project phases such as planning, designing, development and testing that also focuses on launch date of project, overdue tasks with date, deadline, etc. and workload on employees. Showcasing this set of slides titled Project Metrics Dashboard With Launch Date Formats PDF. The topics addressed in these templates are Budget, Project Launch Data, Development. All the content presented in this PPT design is completely editable. Download it and make adjustments in color, background, font etc. as per your unique business setting.
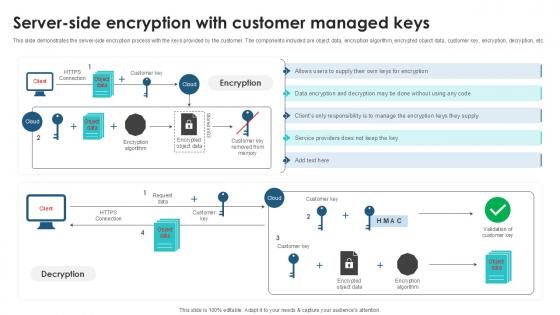
Server Side Encryption With Customer Client Side Encryption PPT Example
This slide demonstrates the server-side encryption process with the keys provided by the customer. The components included are object data, encryption algorithm, encrypted object data, customer key, encryption, decryption, etc. Retrieve professionally designed Server Side Encryption With Customer Client Side Encryption PPT Example to effectively convey your message and captivate your listeners. Save time by selecting pre-made slideshows that are appropriate for various topics, from business to educational purposes. These themes come in many different styles, from creative to corporate, and all of them are easily adjustable and can be edited quickly. Access them as PowerPoint templates or as Google Slides themes. You do not have to go on a hunt for the perfect presentation because Slidegeeks got you covered from everywhere. This slide demonstrates the server-side encryption process with the keys provided by the customer. The components included are object data, encryption algorithm, encrypted object data, customer key, encryption, decryption, etc.
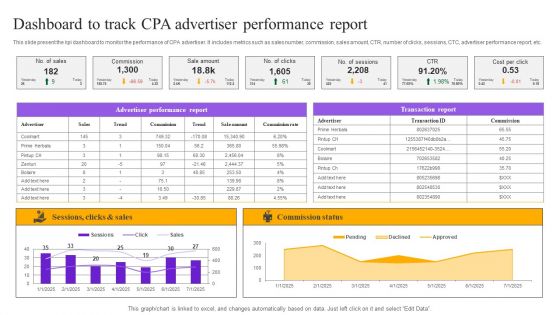
Strategies For Implementing CPA Marketing Dashboard To Track CPA Advertiser Performance Report Inspiration PDF
This slide present the kpi dashboard to monitor the performance of CPA advertiser. It includes metrics such as sales number, commission, sales amount, CTR, number of clicks, sessions, CTC, advertiser performance report, etc. The Strategies For Implementing CPA Marketing Dashboard To Track CPA Advertiser Performance Report Inspiration PDF is a compilation of the most recent design trends as a series of slides. It is suitable for any subject or industry presentation, containing attractive visuals and photo spots for businesses to clearly express their messages. This template contains a variety of slides for the user to input data, such as structures to contrast two elements, bullet points, and slides for written information. Slidegeeks is prepared to create an impression.
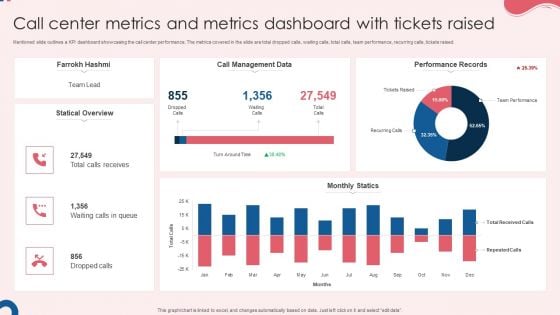
Call Center Metrics And Metrics Dashboard With Tickets Raised Graphics PDF
Mentioned slide outlines a KPI dashboard showcasing the call center performance. The metrics covered in the slide are total dropped calls, waiting calls, total calls, team performance, recurring calls, tickets raised. Showcasing this set of slides titled Call Center Metrics And Metrics Dashboard With Tickets Raised Graphics PDF. The topics addressed in these templates are Call Management Data, Monthly Statics, Performance Records. All the content presented in this PPT design is completely editable. Download it and make adjustments in color, background, font etc. as per your unique business setting.
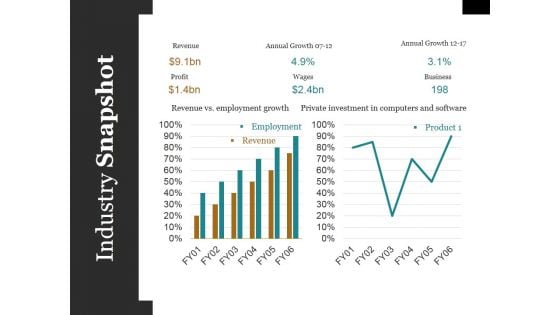
Industry Snapshot Ppt PowerPoint Presentation Styles Microsoft
This is a industry snapshot ppt powerpoint presentation styles microsoft. This is a two stage process. The stages in this process are employment, revenue, bar, marketing, success.
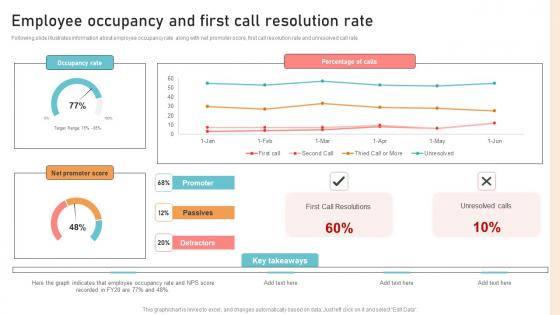
Optimizing Business Integration Employee Occupancy And First Call Demonstration Pdf
Following slide illustrates information about employee occupancy rate along with net promoter score, first call resolution rate and unresolved call rate. Whether you have daily or monthly meetings, a brilliant presentation is necessary. Optimizing Business Integration Employee Occupancy And First Call Demonstration Pdf can be your best option for delivering a presentation. Represent everything in detail using Optimizing Business Integration Employee Occupancy And First Call Demonstration Pdf and make yourself stand out in meetings. The template is versatile and follows a structure that will cater to your requirements. All the templates prepared by Slidegeeks are easy to download and edit. Our research experts have taken care of the corporate themes as well. So, give it a try and see the results. Following slide illustrates information about employee occupancy rate along with net promoter score, first call resolution rate and unresolved call rate.
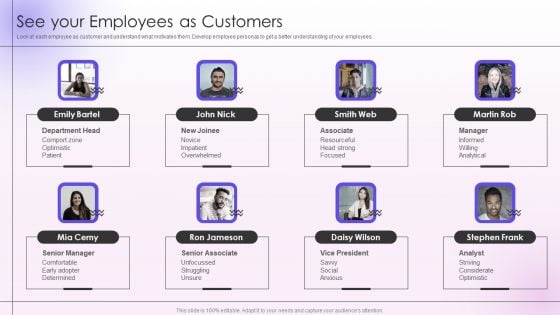
Employee Engagement And Satisfaction Strategies See Your Employees As Customers Themes PDF
Look at each employee as customer and understand what motivates them. Develop employee personas to get a better understanding of your employees. This is a Employee Engagement And Satisfaction Strategies See Your Employees As Customers Themes PDF template with various stages. Focus and dispense information on eight stages using this creative set, that comes with editable features. It contains large content boxes to add your information on topics like Resourceful, Analytical, Optimistic, Department. You can also showcase facts, figures, and other relevant content using this PPT layout. Grab it now.
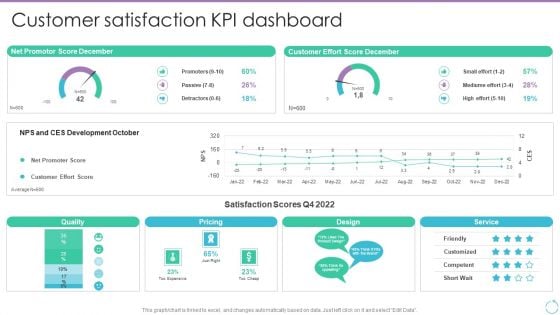
Personal Branding Plan For Executives Customer Satisfaction KPI Dashboard Graphics PDF
This graph or chart is linked to excel, and changes automatically based on data. Just left click on it and select Edit Data. Whether you have daily or monthly meetings, a brilliant presentation is necessary. Personal Branding Plan For Executives Customer Satisfaction KPI Dashboard Graphics PDF can be your best option for delivering a presentation. Represent everything in detail using Personal Branding Plan For Executives Customer Satisfaction KPI Dashboard Graphics PDF and make yourself stand out in meetings. The template is versatile and follows a structure that will cater to your requirements. All the templates prepared by Slidegeeks are easy to download and edit. Our research experts have taken care of the corporate themes as well. So, give it a try and see the results.
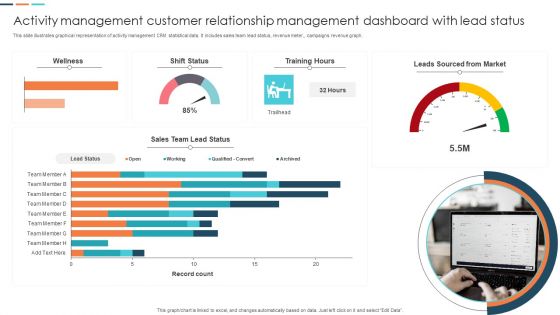
Activity Management Customer Relationship Management Dashboard With Lead Status Portrait PDF
This slide illustrates graphical representation of activity management CRM statistical data. It includes sales team lead status, revenue meter, campaigns revenue graph. Showcasing this set of slides titled Activity Management Customer Relationship Management Dashboard With Lead Status Portrait PDF. The topics addressed in these templates are Sales Team Lead Status, Leads Sourced From Market. All the content presented in this PPT design is completely editable. Download it and make adjustments in color, background, font etc. as per your unique business setting.
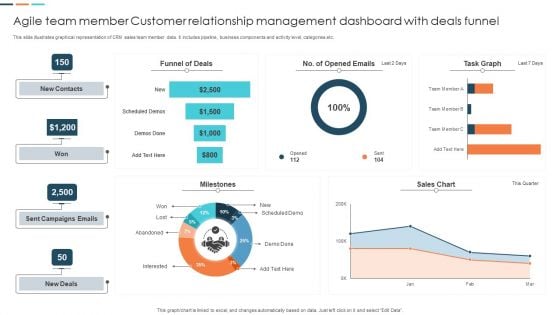
Agile Team Member Customer Relationship Management Dashboard With Deals Funnel Mockup PDF
This slide illustrates graphical representation of CRM sales team member data. It includes pipeline, business components and activity level, categories etc. Pitch your topic with ease and precision using this Agile Team Member Customer Relationship Management Dashboard With Deals Funnel Mockup PDF. This layout presents information on Funnel Of Deals, Sent Campaigns Emails, Sales Chart. It is also available for immediate download and adjustment. So, changes can be made in the color, design, graphics or any other component to create a unique layout.
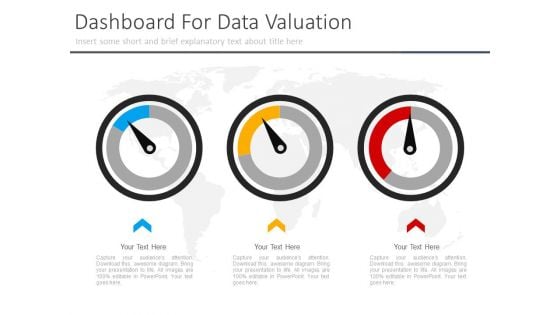
Three Dashboard For Corporate Level Strategy Powerpoint Slides
This PowerPoint template has been designed with three dashboards. You may use this slide to display corporate level strategy. This diagram provides an effective way of displaying information you can edit text, color, shade and style as per you need.
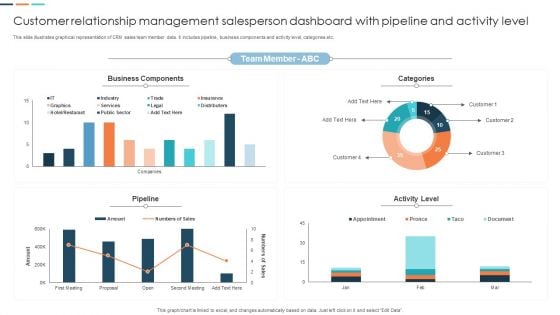
Customer Relationship Management Salesperson Dashboard With Pipeline And Activity Level Designs PDF
This slide illustrates graphical representation of CRM sales team member data. It includes pipeline, business components and activity level, categories etc. Pitch your topic with ease and precision using this Customer Relationship Management Salesperson Dashboard With Pipeline And Activity Level Designs PDF. This layout presents information on Categories, Business Components, Team Member. It is also available for immediate download and adjustment. So, changes can be made in the color, design, graphics or any other component to create a unique layout.

Tasks Performed By Prompt Engineers In Different Scenarios Themes PDF
This slide represents the responsibilities of prompt engineers in different domains. The scenarios discussed in this slide are customer support chatbot, AI-assisted content generation, artificial intelligence in scientific research, etc. The Tasks Performed By Prompt Engineers In Different Scenarios Themes Pdf is a compilation of the most recent design trends as a series of slides. It is suitable for any subject or industry presentation, containing attractive visuals and photo spots for businesses to clearly express their messages. This template contains a variety of slides for the user to input data, such as structures to contrast two elements, bullet points, and slides for written information. Slidegeeks is prepared to create an impression. This slide represents the responsibilities of prompt engineers in different domains. The scenarios discussed in this slide are customer support chatbot, AI-assisted content generation, artificial intelligence in scientific research, etc.
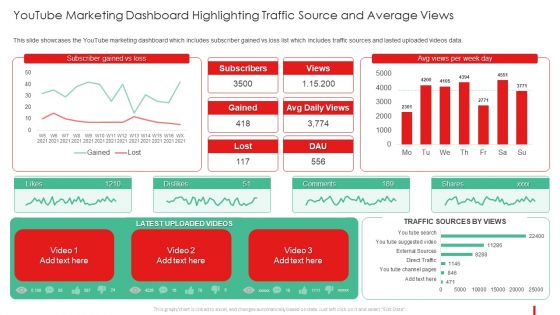
Promotion Guide To Advertise Brand On Youtube Youtube Marketing Dashboard Sample PDF
This slide showcases the YouTube marketing dashboard which includes subscriber gained vs loss list which includes traffic sources and lasted uploaded videos data.Deliver and pitch your topic in the best possible manner with this Promotion Guide To Advertise Brand On Youtube Youtube Marketing Dashboard Sample PDF Use them to share invaluable insights on Youtube Marketing Dashboard Highlighting Traffic Source And Average Views and impress your audience. This template can be altered and modified as per your expectations. So, grab it now.
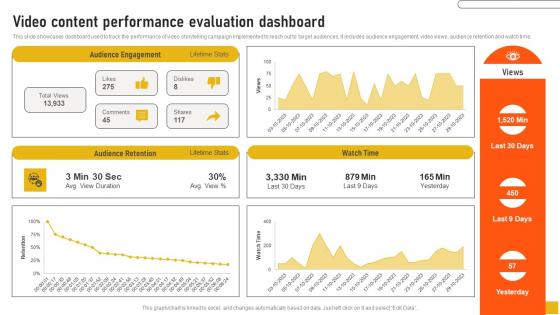
Video Content Performance Evaluation Dashboard Comprehensive Guide Clipart Pdf
This slide showcases dashboard used to track the performance of video storytelling campaign implemented to reach out to target audiences. It includes audience engagement, video views, audience retention and watch time. Here you can discover an assortment of the finest PowerPoint and Google Slides templates. With these templates, you can create presentations for a variety of purposes while simultaneously providing your audience with an eye-catching visual experience. Download Video Content Performance Evaluation Dashboard Comprehensive Guide Clipart Pdf to deliver an impeccable presentation. These templates will make your job of preparing presentations much quicker, yet still, maintain a high level of quality. Slidegeeks has experienced researchers who prepare these templates and write high-quality content for you. Later on, you can personalize the content by editing the Video Content Performance Evaluation Dashboard Comprehensive Guide Clipart Pdf This slide showcases dashboard used to track the performance of video storytelling campaign implemented to reach out to target audiences. It includes audience engagement, video views, audience retention and watch time.
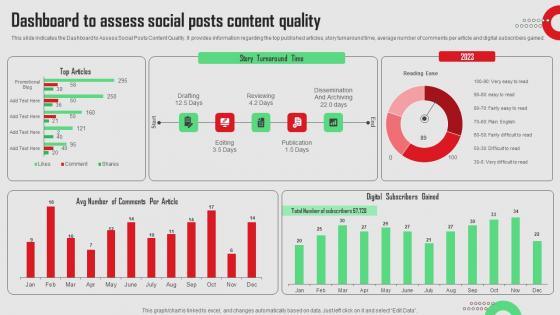
Dashboard To Assess Social Posts Content Quality Social Media Platforms Performance Designs Pdf
This slide indicates the Dashboard to Assess Social Posts Content Quality. It provides information regarding the top published articles, story turnaround time, average number of comments per article and digital subscribers gained.Want to ace your presentation in front of a live audience Our Dashboard To Assess Social Posts Content Quality Social Media Platforms Performance Designs Pdf can help you do that by engaging all the users towards you.. Slidegeeks experts have put their efforts and expertise into creating these impeccable powerpoint presentations so that you can communicate your ideas clearly. Moreover, all the templates are customizable, and easy-to-edit and downloadable. Use these for both personal and commercial use. This slide indicates the Dashboard to Assess Social Posts Content Quality. It provides information regarding the top published articles, story turnaround time, average number of comments per article and digital subscribers gained.
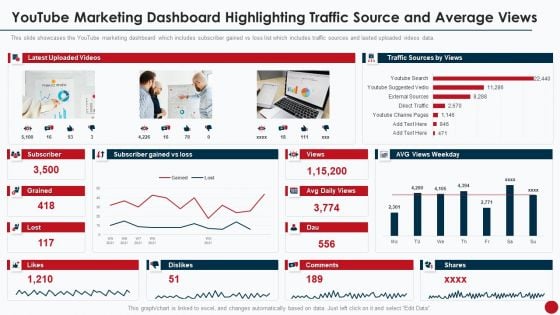
Marketing Manual For Product Promotion On Youtube Channel Youtube Marketing Dashboard Highlighting Traffic Professional PDF
This slide showcases the YouTube marketing dashboard which includes subscriber gained vs loss list which includes traffic sources and lasted uploaded videos data.Deliver an awe inspiring pitch with this creative Marketing Manual For Product Promotion On Youtube Channel Youtube Marketing Dashboard Highlighting Traffic Professional PDF bundle. Topics like Direct Traffic, External Sources, Suggested Video can be discussed with this completely editable template. It is available for immediate download depending on the needs and requirements of the user.
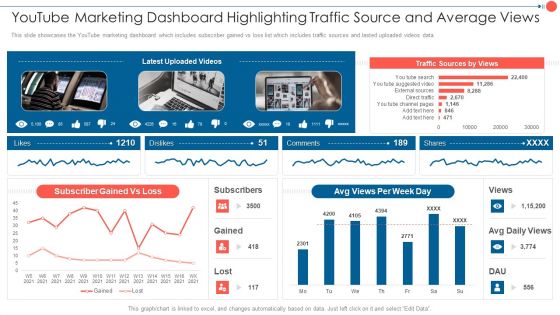
Youtube Advertising Techniques Youtube Marketing Dashboard Highlighting Traffic Source Summary PDF
This slide showcases the YouTube marketing dashboard which includes subscriber gained vs loss list which includes traffic sources and lasted uploaded videos data. Deliver an awe inspiring pitch with this creative Youtube Advertising Techniques Youtube Marketing Dashboard Highlighting Traffic Source Summary PDF bundle. Topics like Subscriber Gained, Traffic Sources, Avg Views can be discussed with this completely editable template. It is available for immediate download depending on the needs and requirements of the user.
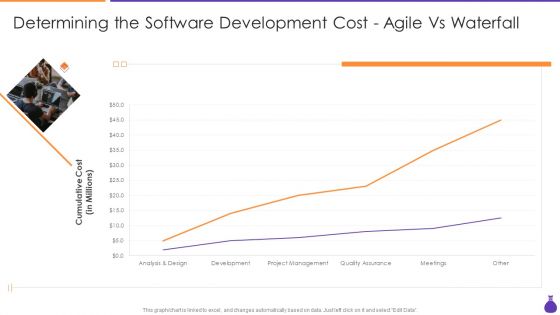
Why Is Agile Cost Effective IT Determining The Software Development Cost Agile Demonstration PDF
This graph or chart is linked to excel, and changes automatically based on data. Just left click on it and select Edit Data. Deliver and pitch your topic in the best possible manner with this Why Is Agile Cost Effective IT Determining The Software Development Cost Agile Demonstration PDF. Use them to share invaluable insights on Analysis And Design, Development, Project Management, Quality Assurance and impress your audience. This template can be altered and modified as per your expectations. So, grab it now.
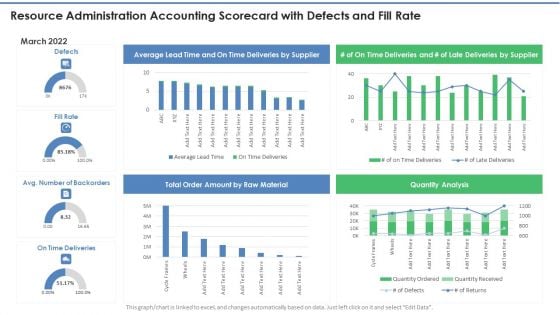
Resource Administration Accounting Scorecard With Defects And Fill Rate Mockup PDF
This graph or chart is linked to excel, and changes automatically based on data. Just left click on it and select Edit Data. Deliver and pitch your topic in the best possible manner with this Resource Administration Accounting Scorecard With Defects And Fill Rate Mockup PDF. Use them to share invaluable insights on Total Order Amount, Raw Material, Quantity Analysis and impress your audience. This template can be altered and modified as per your expectations. So, grab it now.
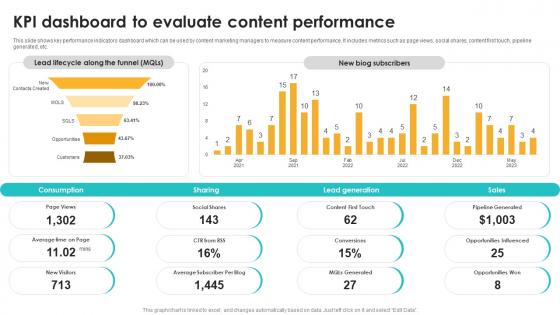
Kpi Dashboard To Evaluate Content Performance Seo Content Plan To Drive Strategy SS V
This slide shows key performance indicators dashboard which can be used by content marketing managers to measure content performance. It includes metrics such as page views, social shares, content first touch, pipeline generated, etc. This Kpi Dashboard To Evaluate Content Performance Seo Content Plan To Drive Strategy SS V is perfect for any presentation, be it in front of clients or colleagues. It is a versatile and stylish solution for organizing your meetings. The Kpi Dashboard To Evaluate Content Performance Seo Content Plan To Drive Strategy SS V features a modern design for your presentation meetings. The adjustable and customizable slides provide unlimited possibilities for acing up your presentation. Slidegeeks has done all the homework before launching the product for you. So, do not wait, grab the presentation templates today This slide shows key performance indicators dashboard which can be used by content marketing managers to measure content performance. It includes metrics such as page views, social shares, content first touch, pipeline generated, etc.
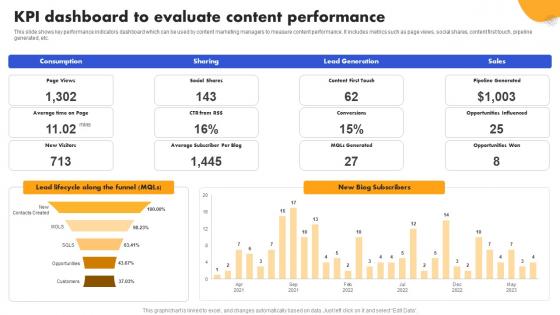
SEO Strategy To Improve ROI KPI Dashboard To Evaluate Content Strategy SS V
This slide shows key performance indicators dashboard which can be used by content marketing managers to measure content performance. It includes metrics such as page views, social shares, content first touch, pipeline generated, etc. Welcome to our selection of the SEO Strategy To Improve ROI KPI Dashboard To Evaluate Content Strategy SS V. These are designed to help you showcase your creativity and bring your sphere to life. Planning and Innovation are essential for any business that is just starting out. This collection contains the designs that you need for your everyday presentations. All of our PowerPoints are 100Percent editable, so you can customize them to suit your needs. This multi-purpose template can be used in various situations. Grab these presentation templates today. This slide shows key performance indicators dashboard which can be used by content marketing managers to measure content performance. It includes metrics such as page views, social shares, content first touch, pipeline generated, etc.
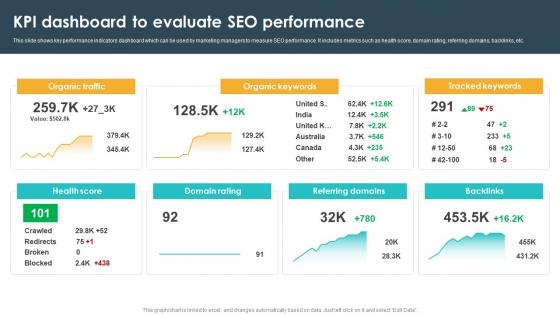
Kpi Dashboard To Evaluate Seo Performance Seo Content Plan To Drive Strategy SS V
This slide shows key performance indicators dashboard which can be used by marketing managers to measure SEO performance. It includes metrics such as health score, domain rating, referring domains, backlinks, etc. Welcome to our selection of the Kpi Dashboard To Evaluate Seo Performance Seo Content Plan To Drive Strategy SS V These are designed to help you showcase your creativity and bring your sphere to life. Planning and Innovation are essential for any business that is just starting out. This collection contains the designs that you need for your everyday presentations. All of our PowerPoints are 100Percent editable, so you can customize them to suit your needs. This multi-purpose template can be used in various situations. Grab these presentation templates today. This slide shows key performance indicators dashboard which can be used by marketing managers to measure SEO performance. It includes metrics such as health score, domain rating, referring domains, backlinks, etc.
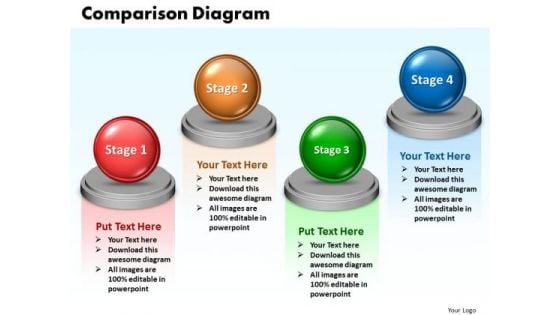
Ppt Comparison Network Diagram PowerPoint Template 4 Phase Templates
PPT comparison network diagram powerpoint template 4 phase Templates-This PowerPoint diagram slide shows four opposing views. You can use the This PowerPoint diagram slide to represent views from different functions on an issue.-PPT comparison network diagram powerpoint template 4 phase Templates-Abstract, Achievement, Business, Chart, Comparison, Concepts, Data, Descriptive, Design, Development, Diagram, Element, Figure, Finance, Financial, Graph, Graphic, Growth, Icon, Ideas, Improvement, Investment, Market, Money, Progress, Raise, Real, Report, Revenue, Sale, Shape, Sign, Silhouette, Stock, Success, Symbol, Technology Reveal the depth of your knowledge. Showcase your erudition on our Ppt Comparison Network Diagram PowerPoint Template 4 Phase Templates.
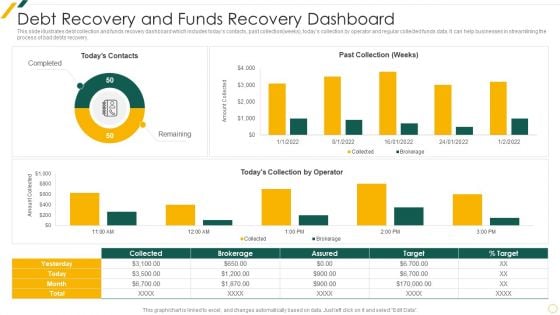
Debt Recovery And Funds Recovery Dashboard Structure PDF
This slide illustrates debt collection and funds recovery dashboard which includes todays contacts, past collectionweeks todays collection by operator and regular collected funds data. It can help businesses in streamlining the process of bad debts recovery.Showcasing this set of slides titled Debt Recovery And Funds Recovery Dashboard Structure PDF The topics addressed in these templates are Debt Recovery, Funds Recovery Dashboard All the content presented in this PPT design is completely editable. Download it and make adjustments in color, background, font etc. as per your unique business setting.
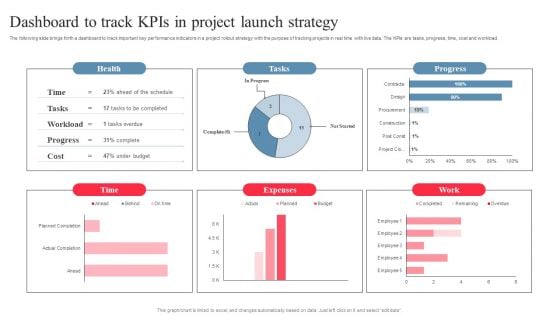
Dashboard To Track Kpis In Project Launch Strategy Pictures PDF
The following slide brings forth a dashboard to track important key performance indicators in a project rollout strategy with the purpose of tracking projects in real time with live data. The KPIs are tasks, progress, time, cost and workload. Showcasing this set of slides titled Dashboard To Track Kpis In Project Launch Strategy Pictures PDF. The topics addressed in these templates are Expenses, Project Launch Strategy, Dashboard To Track Kpis. All the content presented in this PPT design is completely editable. Download it and make adjustments in color, background, font etc. as per your unique business setting.
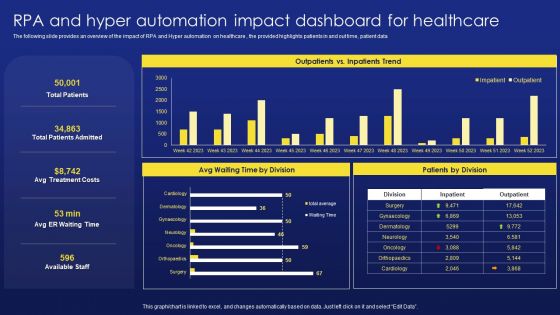
Deployment Procedure Of Hyper Automation RPA And Hyper Automation Impact Dashboard For Healthcare Formats PDF
The following slide provides an overview of the impact of RPA and Hyper automation on healthcare , the provided highlights patients in and out time, patient data. There are so many reasons you need a Deployment Procedure Of Hyper Automation RPA And Hyper Automation Impact Dashboard For Healthcare Formats PDF. The first reason is you can not spend time making everything from scratch, Thus, Slidegeeks has made presentation templates for you too. You can easily download these templates from our website easily.
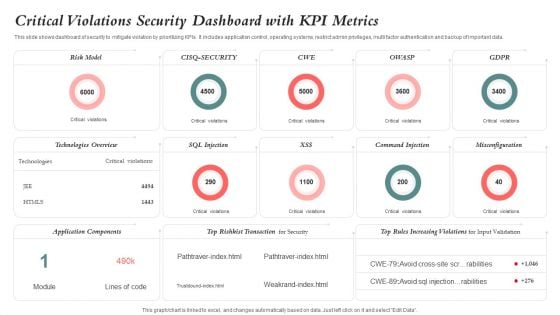
Critical Violations Security Dashboard With KPI Metrics Graphics PDF
This slide shows dashboard of security to mitigate violation by prioritizing KPIs. It includes application control, operating systems, restrict admin privileges, multi factor authentication and backup of important data. Showcasing this set of slides titled Critical Violations Security Dashboard With KPI Metrics Graphics PDF. The topics addressed in these templates are Risk Model, Application Components, Technologies Overview. All the content presented in this PPT design is completely editable. Download it and make adjustments in color, background, font etc. as per your unique business setting.
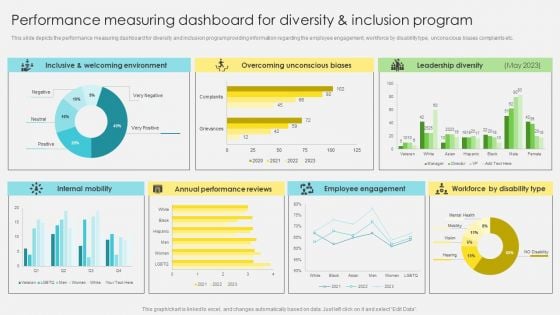
Performance Measuring Dashboard For Diversity And Inclusion Program Template PDF
This slide depicts the performance measuring dashboard for diversity and inclusion program providing information regarding the employee engagement, workforce by disability type, unconscious biases complaints etc. The Performance Measuring Dashboard For Diversity And Inclusion Program Template PDF is a compilation of the most recent design trends as a series of slides. It is suitable for any subject or industry presentation, containing attractive visuals and photo spots for businesses to clearly express their messages. This template contains a variety of slides for the user to input data, such as structures to contrast two elements, bullet points, and slides for written information. Slidegeeks is prepared to create an impression.
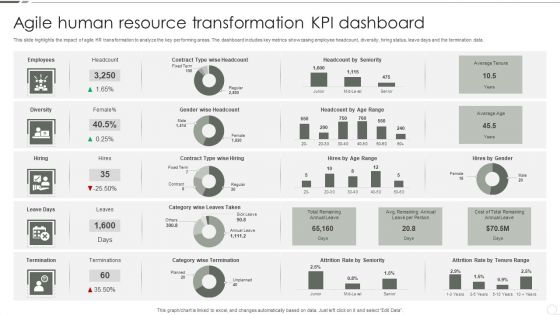
Agile Human Resource Transformation KPI Dashboard Microsoft PDF
This slide highlights the impact of agile HR transformation to analyze the key performing areas. The dashboard includes key metrics showcasing employee headcount, diversity, hiring status, leave days and the termination data. Showcasing this set of slides titled Agile Human Resource Transformation KPI Dashboard Microsoft PDF. The topics addressed in these templates are Employees, Diversity, Hiring, Leave Days, Termination. All the content presented in this PPT design is completely editable. Download it and make adjustments in color, background, font etc. as per your unique business setting.
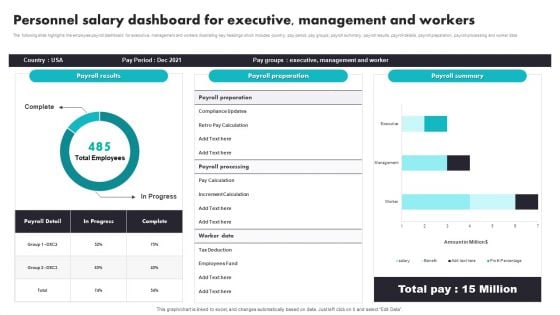
Personnel Salary Dashboard For Executive Management And Workers Rules PDF
The following slide highlights the employee payroll dashboard for executive, management and workers illustrating key headings which includes country, pay period, pay groups, payroll summary, payroll results, payroll details, payroll preparation, payroll processing and worker data. Showcasing this set of slides titled Personnel Salary Dashboard For Executive Management And Workers Rules PDF. The topics addressed in these templates are Management, Executive, Employees Fund. All the content presented in this PPT design is completely editable. Download it and make adjustments in color, background, font etc. as per your unique business setting.
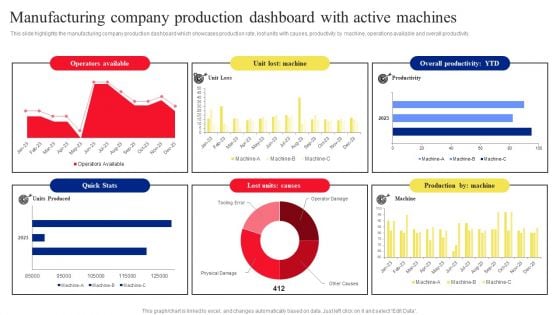
Manufacturing Company Production Dashboard With Active Machines Microsoft PDF
This slide highlights the manufacturing company production dashboard which showcases production rate, lost units with causes, productivity by machine, operations available and overall productivity. The Manufacturing Company Production Dashboard With Active Machines Microsoft PDF is a compilation of the most recent design trends as a series of slides. It is suitable for any subject or industry presentation, containing attractive visuals and photo spots for businesses to clearly express their messages. This template contains a variety of slides for the user to input data, such as structures to contrast two elements, bullet points, and slides for written information. Slidegeeks is prepared to create an impression.
Social Media Performance Tracking And Monitoring Dashboard Graphics PDF
The following slide showcases a dashboard to track and measure social media platforms performance. It includes key elements such as website traffic, social media referral rate, site revenue, social media site revenue, etc. The Social Media Performance Tracking And Monitoring Dashboard Graphics PDF is a compilation of the most recent design trends as a series of slides. It is suitable for any subject or industry presentation, containing attractive visuals and photo spots for businesses to clearly express their messages. This template contains a variety of slides for the user to input data, such as structures to contrast two elements, bullet points, and slides for written information. Slidegeeks is prepared to create an impression.
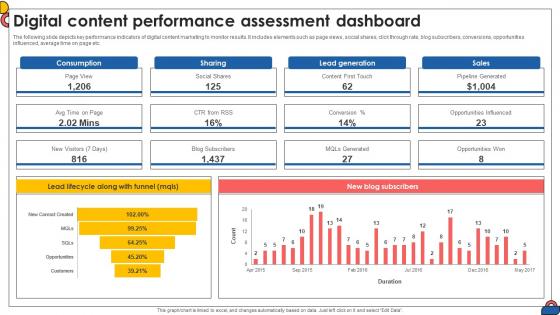
Digital Content Performance Assessment Dashboard Comprehensive Guide To Implement Strategy SS V
The following slide depicts key performance indicators of digital content marketing to monitor results. It includes elements such as page views, social shares, click through rate, blog subscribers, conversions, opportunities influenced, average time on page etc.If your project calls for a presentation, then Slidegeeks is your go-to partner because we have professionally designed, easy-to-edit templates that are perfect for any presentation. After downloading, you can easily edit Digital Content Performance Assessment Dashboard Comprehensive Guide To Implement Strategy SS V and make the changes accordingly. You can rearrange slides or fill them with different images. Check out all the handy templates The following slide depicts key performance indicators of digital content marketing to monitor results. It includes elements such as page views, social shares, click through rate, blog subscribers, conversions, opportunities influenced, average time on page etc.
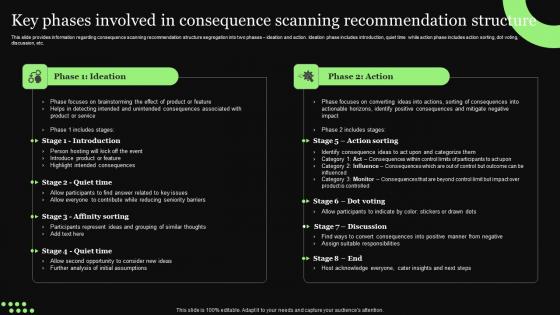
Ethical Technology Utilization Key Phases Involved In Consequence Scanning Background Pdf
This slide provides information regarding consequence scanning recommendation structure segregation into two phases ideation and action. Ideation phase includes introduction, quiet time while action phase includes action sorting, dot voting, discussion, etc. The Ethical Technology Utilization Key Phases Involved In Consequence Scanning Background Pdf is a compilation of the most recent design trends as a series of slides. It is suitable for any subject or industry presentation, containing attractive visuals and photo spots for businesses to clearly express their messages. This template contains a variety of slides for the user to input data, such as structures to contrast two elements, bullet points, and slides for written information. Slidegeeks is prepared to create an impression. This slide provides information regarding consequence scanning recommendation structure segregation into two phases ideation and action. Ideation phase includes introduction, quiet time while action phase includes action sorting, dot voting, discussion, etc.
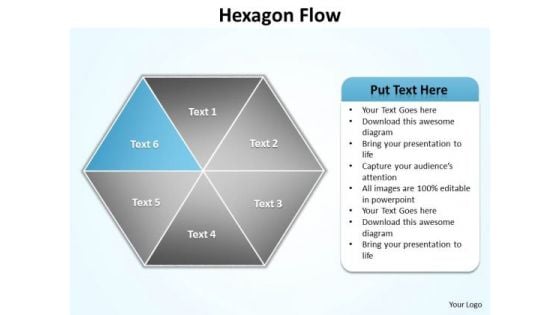
Ppt Blue Factor Hexagon Angles Spider Diagram PowerPoint Template Editable Templates
PPT blue factor hexagon angles spider diagram PowerPoint template editable Templates-You can easily collaborate this PowerPoint diagram with colleagues to create detailed process diagrams and use them as a key element in streamlining your processes. Use this graphical approach to represent global business issues such as financial data, stock market Exchange, increase in sales, corporate presentations and more. -PPT blue factor hexagon angles spider diagram PowerPoint template editable Templates-attached, backgrounds, blue, cell, color, component, connect, connection, diagram, elements, geometric, graphic, group, hexagon, honeycomb, icon, illustration, intricacy, lines, link, map, mesh, model, network, science, shape, shiny, strategy, structure, symbol, teamwork, technology Out Ppt Blue Factor Hexagon Angles Spider Diagram PowerPoint Template Editable Templates embody the contemporary. They are always at the forefront of fashion.
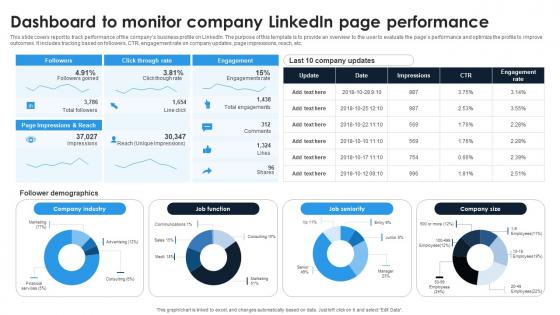
Linkedin Content Strategies Dashboard To Monitor Company Linkedin Page MKT SS V
This slide covers report to track performance of the compans business profile on LinkedIn. The purpose of this template is to provide an overview to the user to evaluate the pages performance and optimize the profile to improve outcomes. It includes tracking based on followers, CTR, engagement rate on company updates, page impressions, reach, etc. Slidegeeks is here to make your presentations a breeze with Linkedin Content Strategies Dashboard To Monitor Company Linkedin Page MKT SS V With our easy-to-use and customizable templates, you can focus on delivering your ideas rather than worrying about formatting. With a variety of designs to choose from, you are sure to find one that suits your needs. And with animations and unique photos, illustrations, and fonts, you can make your presentation pop. So whether you are giving a sales pitch or presenting to the board, make sure to check out Slidegeeks first This slide covers report to track performance of the compans business profile on LinkedIn. The purpose of this template is to provide an overview to the user to evaluate the pages performance and optimize the profile to improve outcomes. It includes tracking based on followers, CTR, engagement rate on company updates, page impressions, reach, etc.
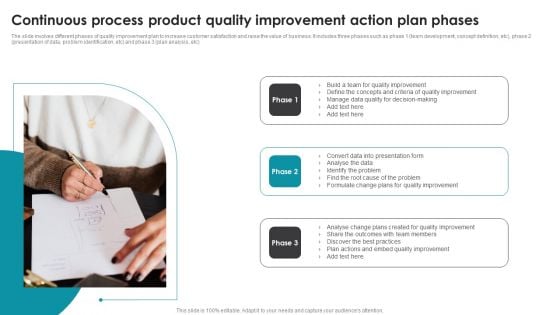
Continuous Process Product Quality Improvement Action Plan Phases Introduction PDF
The slide involves different phases of quality improvement plan to increase customer satisfaction and raise the value of business. It includes three phases such as phase 1 team development, concept definition, etc, phase 2 presentation of data, problem identification, etc and phase 3 plan analysis, etc.
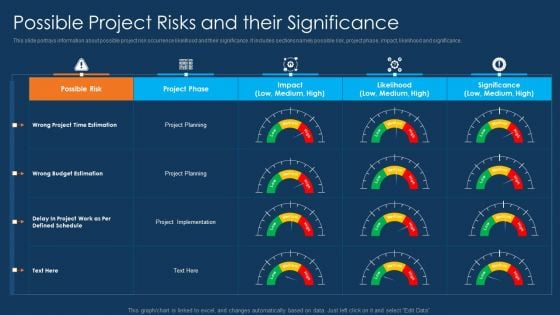
Information Technology Project Initiation Possible Project Risks And Their Significance Clipart PDF
This slide portrays information about possible project risk occurrence likelihood and their significance. It includes sections namely possible risk, project phase, impact, likelihood and significance. Deliver an awe inspiring pitch with this creative information technology project initiation possible project risks and their significance clipart pdf bundle. Topics like possible risk, project phase, project planning can be discussed with this completely editable template. It is available for immediate download depending on the needs and requirements of the user.

Human Resource Monthly Employee Engagement Report PPT Example SS
This slide represents the employee engagement report prepared by the human resource team. It includes details related to response rate, highlights, factors, questions, factor and question summary etc. The Human Resource Monthly Employee Engagement Report PPT Example SS is a compilation of the most recent design trends as a series of slides. It is suitable for any subject or industry presentation, containing attractive visuals and photo spots for businesses to clearly express their messages. This template contains a variety of slides for the user to input data, such as structures to contrast two elements, bullet points, and slides for written information. Slidegeeks is prepared to create an impression. This slide represents the employee engagement report prepared by the human resource team. It includes details related to response rate, highlights, factors, questions, factor and question summary etc.
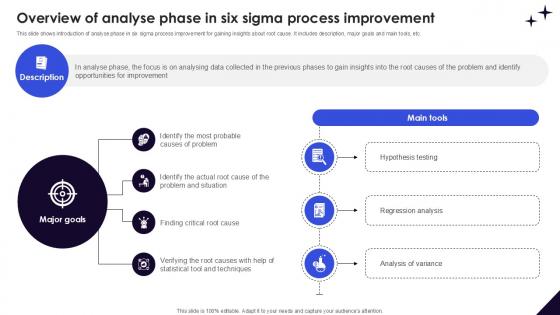
Overview Of Analyse Phase In DMAIC Methodology To Maintain PPT Sample
This slide shows introduction of analyse phase in six sigma process improvement for gaining insights about root cause. It includes description, major goals and main tools, etc. The Overview Of Analyse Phase In DMAIC Methodology To Maintain PPT Sample is a compilation of the most recent design trends as a series of slides. It is suitable for any subject or industry presentation, containing attractive visuals and photo spots for businesses to clearly express their messages. This template contains a variety of slides for the user to input data, such as structures to contrast two elements, bullet points, and slides for written information. Slidegeeks is prepared to create an impression. This slide shows introduction of analyse phase in six sigma process improvement for gaining insights about root cause. It includes description, major goals and main tools, etc.
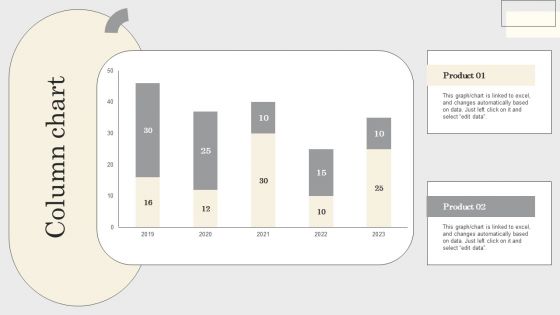
Steps To Conduct Competitor Analysis Column Chart Ppt Model Gridlines PDF
This graph or chart is linked to excel, and changes automatically based on data. Just left click on it and select edit data. If your project calls for a presentation, then Slidegeeks is your go-to partner because we have professionally designed, easy-to-edit templates that are perfect for any presentation. After downloading, you can easily edit Steps To Conduct Competitor Analysis Column Chart Ppt Model Gridlines PDF and make the changes accordingly. You can rearrange slides or fill them with different images. Check out all the handy templates
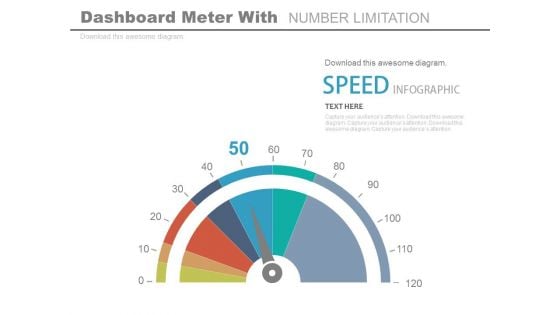
Dashboard To Impact The Performance Powerpoint Slides
This PowerPoint template graphics of meter chart. Download this PPT chart for business performance analysis. This PowerPoint slide is of great help in the business sector to make realistic presentations and provides effective way of presenting your newer thoughts.
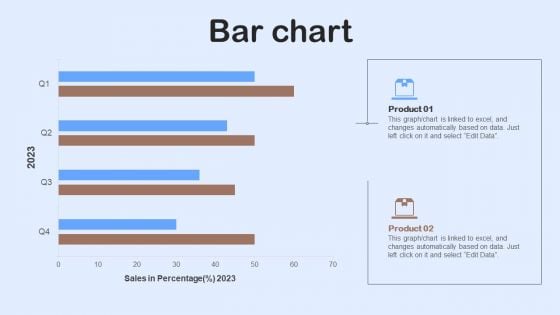
Nestle Performance Management Report Bar Chart Ppt Inspiration Shapes PDF
This graph or chart is linked to excel, and changes automatically based on data. Just left click on it and select Edit Data. Whether you have daily or monthly meetings, a brilliant presentation is necessary. Nestle Performance Management Report Bar Chart Ppt Inspiration Shapes PDF can be your best option for delivering a presentation. Represent everything in detail using Nestle Performance Management Report Bar Chart Ppt Inspiration Shapes PDF and make yourself stand out in meetings. The template is versatile and follows a structure that will cater to your requirements. All the templates prepared by Slidegeeks are easy to download and edit. Our research experts have taken care of the corporate themes as well. So, give it a try and see the results.
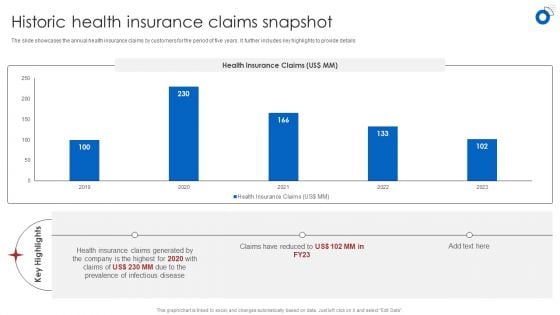
Insurance Business Financial Analysis Historic Health Insurance Claims Snapshot Diagrams PDF
The slide showcases the annual health insurance claims by customers for the period of five years. It further includes key highlights to provide details Boost your pitch with our creative Insurance Business Financial Analysis Historic Health Insurance Claims Snapshot Diagrams PDF. Deliver an awe-inspiring pitch that will mesmerize everyone. Using these presentation templates you will surely catch everyones attention. You can browse the ppts collection on our website. We have researchers who are experts at creating the right content for the templates. So you dont have to invest time in any additional work. Just grab the template now and use them.
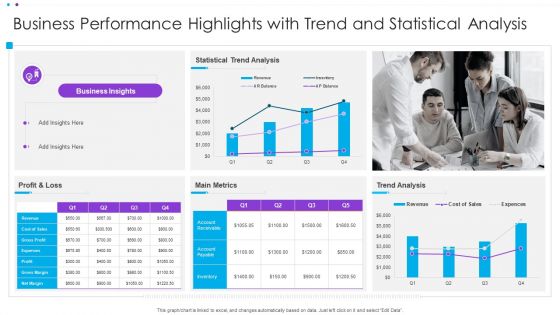
Business Performance Highlights With Trend And Statistical Analysis Ppt Infographic Template Display PDF
This graph or chart is linked to excel, and changes automatically based on data. Just left click on it and select Edit Data. Pitch your topic with ease and precision using this Business Performance Highlights With Trend And Statistical Analysis Ppt Infographic Template Display PDF. This layout presents information on Statistical Trend Analysis, Main Metrics, Profit And Loss. It is also available for immediate download and adjustment. So, changes can be made in the color, design, graphics or any other component to create a unique layout.
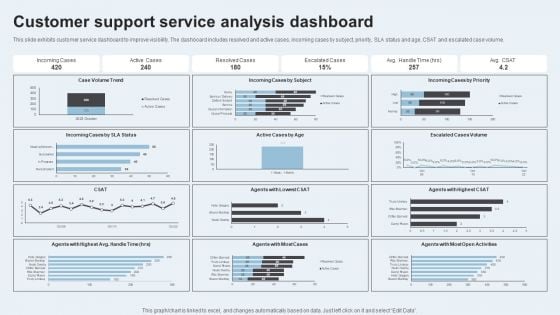
Action Plan To Enhance Client Service Customer Support Service Analysis Dashboard Graphics PDF
This slide exhibits customer service dashboard to improve visibility. The dashboard includes resolved and active cases, incoming cases by subject, priority, SLA status and age, CSAT and escalated case volume. The Action Plan To Enhance Client Service Customer Support Service Analysis Dashboard Graphics PDF is a compilation of the most recent design trends as a series of slides. It is suitable for any subject or industry presentation, containing attractive visuals and photo spots for businesses to clearly express their messages. This template contains a variety of slides for the user to input data, such as structures to contrast two elements, bullet points, and slides for written information. Slidegeeks is prepared to create an impression.
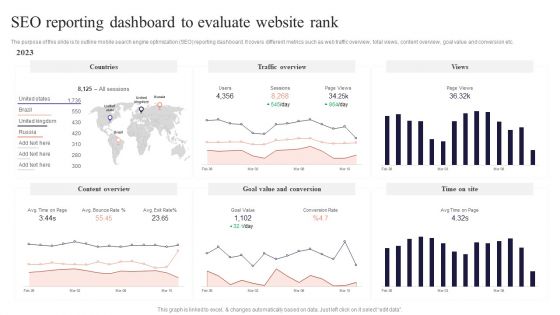
SEO Reporting Dashboard To Evaluate Website Rank Performing Mobile SEO Audit To Analyze Web Traffic Inspiration PDF
The purpose of this slide is to outline mobile search engine optimization SEO reporting dashboard. It covers different metrics such as web traffic overview, total views, content overview, goal value and conversion etc. The SEO Reporting Dashboard To Evaluate Website Rank Performing Mobile SEO Audit To Analyze Web Traffic Inspiration PDF is a compilation of the most recent design trends as a series of slides. It is suitable for any subject or industry presentation, containing attractive visuals and photo spots for businesses to clearly express their messages. This template contains a variety of slides for the user to input data, such as structures to contrast two elements, bullet points, and slides for written information. Slidegeeks is prepared to create an impression.
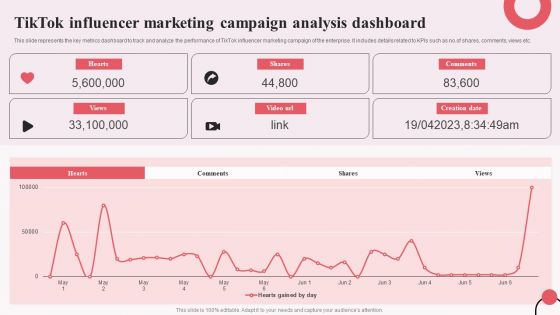
Tiktok Digital Marketing Campaign Tiktok Influencer Marketing Campaign Analysis Dashboard Brochure PDF
This slide represents the key metrics dashboard to track and analyze the performance of TikTok influencer marketing campaign of the enterprise. It includes details related to KPIs such as no.of shares, comments, views etc. The Tiktok Digital Marketing Campaign Tiktok Influencer Marketing Campaign Analysis Dashboard Brochure PDF is a compilation of the most recent design trends as a series of slides. It is suitable for any subject or industry presentation, containing attractive visuals and photo spots for businesses to clearly express their messages. This template contains a variety of slides for the user to input data, such as structures to contrast two elements, bullet points, and slides for written information. Slidegeeks is prepared to create an impression.
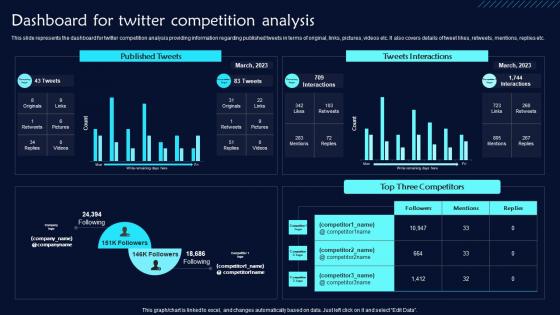
Dashboard For Twitter Competition Analysis Twitter Promotional Techniques Themes Pdf
This slide represents the dashboard for twitter competition analysis providing information regarding published tweets in terms of original, links, pictures, videos etc. It also covers details of tweet likes, retweets, mentions, replies etc. Get a simple yet stunning designed Dashboard For Twitter Competition Analysis Twitter Promotional Techniques Themes Pdf. It is the best one to establish the tone in your meetings. It is an excellent way to make your presentations highly effective. So, download this PPT today from Slidegeeks and see the positive impacts. Our easy-to-edit Dashboard For Twitter Competition Analysis Twitter Promotional Techniques Themes Pdf can be your go-to option for all upcoming conferences and meetings. So, what are you waiting for Grab this template today. This slide represents the dashboard for twitter competition analysis providing information regarding published tweets in terms of original, links, pictures, videos etc. It also covers details of tweet likes, retweets, mentions, replies etc.
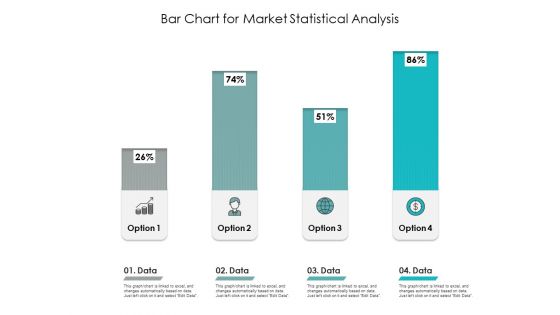
Bar Chart For Market Statistical Analysis Ppt PowerPoint Presentation Slides Good PDF
Presenting this set of slides with name bar chart for market statistical analysis ppt powerpoint presentation slides good pdf. The topics discussed in these slides are data, option, bar chart, market statistical, analysis. This is a completely editable PowerPoint presentation and is available for immediate download. Download now and impress your audience.
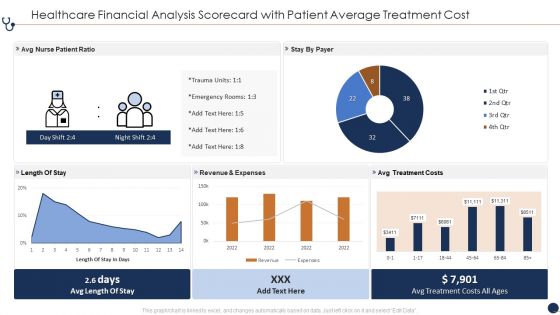
Healthcare Financial Analysis Scorecard With Patient Average Treatment Cost Ppt Infographic Template Slide Portrait PDF
This graph or chart is linked to excel, and changes automatically based on data. Just left click on it and select Edit Data. Deliver and pitch your topic in the best possible manner with this Healthcare Financial Analysis Scorecard With Patient Average Treatment Cost Ppt Infographic Template Slide Portrait PDF. Use them to share invaluable insights on Avg Nurse Patient, Revenue And Expenses, Avg Treatment Costs and impress your audience. This template can be altered and modified as per your expectations. So, grab it now.
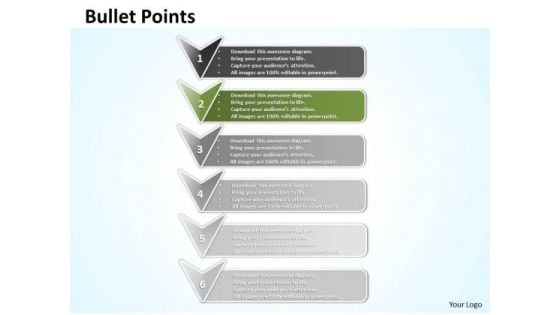
Ppt Arrows PowerPoint 2010 Pointing Vertical Downwards Templates
PPT arrows powerpoint 2010 pointing vertical downwards Templates-Arrows PowerPoint Diagram is nice for financial PowerPoint Diagram presentations as well as other analysis or business PowerPoint diagram needs. Use this graphical approach to represent global business issues such as financial data, stock market Exchange, increase in sales, corporate presentations and more.-PPT arrows powerpoint 2010 pointing vertical downwards Templates-advertising, arrow, bend, black, blue, bookmark, business, collection, control, corner, curl, customer, design, down, element, gold, green, icon, illustration, label, mark, marketing, message, new, origami, paper, product, service, set, shadow, shiny, shop, sign, site, sticker, symbol, tag Take care of your organizationwith our Ppt Arrows PowerPoint 2010 Pointing Vertical Downwards Templates. You'll deliver your best presentation yet.
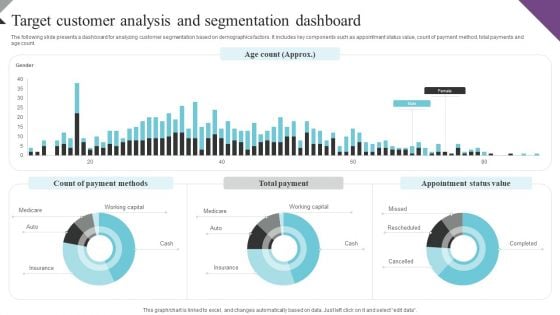
Customer Segmentation And Behavioral Analysis Target Customer Analysis Ideas PDF
The following slide presents a dashboard for analyzing customer segmentation based on demographics factors. It includes key components such as appointment status value, count of payment method, total payments and age count. The Customer Segmentation And Behavioral Analysis Target Customer Analysis Ideas PDF is a compilation of the most recent design trends as a series of slides. It is suitable for any subject or industry presentation, containing attractive visuals and photo spots for businesses to clearly express their messages. This template contains a variety of slides for the user to input data, such as structures to contrast two elements, bullet points, and slides for written information. Slidegeeks is prepared to create an impression.
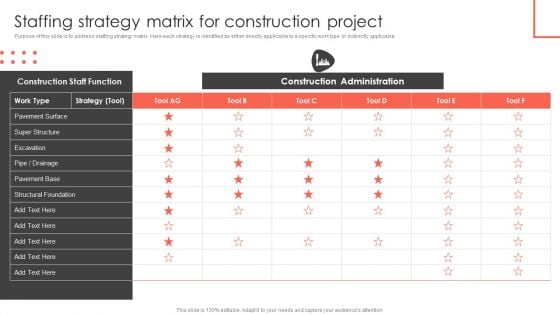
Staffing Strategy Matrix For Construction Project Construct Project Feasibility Analysis Report Themes PDF
Purpose of this slide is to address staffing strategy matrix. Here each strategy is identified as either directly applicable to a specific work type or indirectly applicable. The Staffing Strategy Matrix For Construction Project Construct Project Feasibility Analysis Report Themes PDF is a compilation of the most recent design trends as a series of slides. It is suitable for any subject or industry presentation, containing attractive visuals and photo spots for businesses to clearly express their messages. This template contains a variety of slides for the user to input data, such as structures to contrast two elements, bullet points, and slides for written information. Slidegeeks is prepared to create an impression.
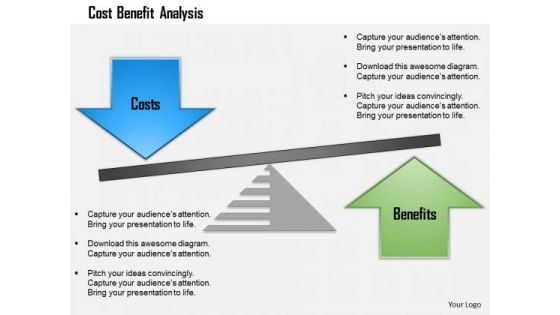
Business Framework Cost Benefit Analysis PowerPoint Presentation
Multistage concentric circle diagram has been used to decorate this power point template slide. This PPT slide contains the core and layer style which can be used for displaying various data. This PPT slide is useful for any business and marketing process representation.


 Continue with Email

 Home
Home


