Data Architecture Diagram
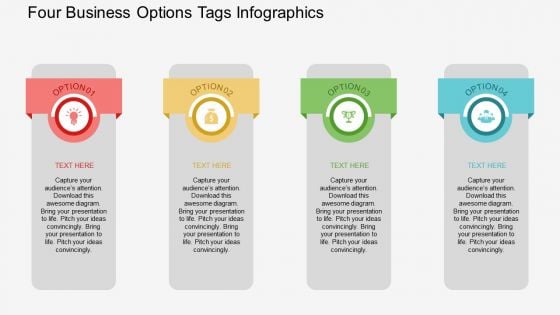
Four Business Options Tags Infographics Powerpoint Template
The above PowerPoint slide displays four options tags infographic. This PowerPoint diagram helps to summarize complex business data. Adjust the above diagram in your business presentations to visually support your content.
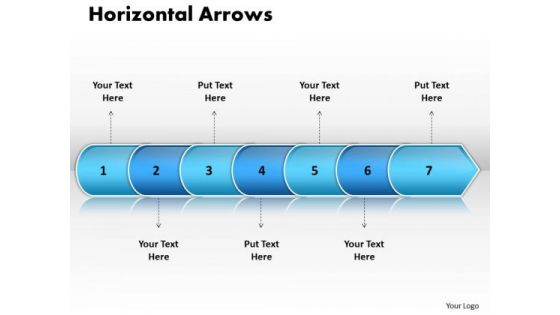
Ppt Linear Arrow 7 Power Point Stage PowerPoint Templates
PPT linear arrow 7 power point stage PowerPoint Templates-This Linear arrow data flow diagram conveys information about the events in the process clearly and efficiently-PPT linear arrow 7 power point stage PowerPoint Templates-Arrow, Background, Collection, Completed, Concept, Confirmation, Design, Flow, Graph, Graphic, Illustration, Indication, Indicator, Information, Instruction, Interface, Internet, Layout, Measurement, Order, Phase, Pointer, Process, Progress, Reflection, Scale, Shape, Sign Estabish the key factors of your scheme. Explain the crucial elements with our Ppt Linear Arrow 7 Power Point Stage PowerPoint Templates.
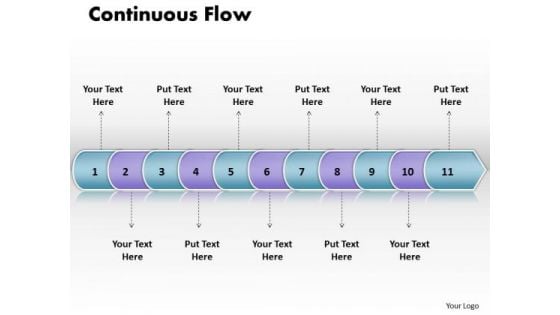
Ppt Linear Arrow 11 Stages PowerPoint Templates
PPT linear arrow 11 stages PowerPoint Templates-Use this PowerPoint diagram to define basic work and data flow and quality management processes to increase efficiency of your business.-PPT linear arrow 11 stages PowerPoint Templates-Arrow, Background, Collection, Completed, Concept, Confirmation, Design, Flow, Graph, Graphic, Illustration, Indication, Indicator, Information, Instruction, Interface, Internet, Layout, Measurement, Order, Phase, Pointer, Process, Progress, Reflection, Scale, Shape, Sign Use our Ppt Linear Arrow 11 Stages PowerPoint Templates and be carefree. They will bear the brunt for you.
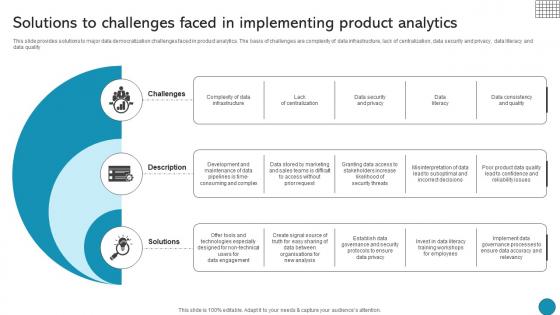
Solutions To Challenges Faced In Implementing Product Driving Business Success Integrating Product
This slide provides solutions to major data democratization challenges faced in product analytics. The basis of challenges are complexity of data infrastructure, lack of centralization, data security and privacy, data literacy and data quality If you are looking for a format to display your unique thoughts, then the professionally designed Solutions To Challenges Faced In Implementing Product Driving Business Success Integrating Product is the one for you. You can use it as a Google Slides template or a PowerPoint template. Incorporate impressive visuals, symbols, images, and other charts. Modify or reorganize the text boxes as you desire. Experiment with shade schemes and font pairings. Alter, share or cooperate with other people on your work. Download Solutions To Challenges Faced In Implementing Product Driving Business Success Integrating Product and find out how to give a successful presentation. Present a perfect display to your team and make your presentation unforgettable. This slide provides solutions to major data democratization challenges faced in product analytics. The basis of challenges are complexity of data infrastructure, lack of centralization, data security and privacy, data literacy and data quality
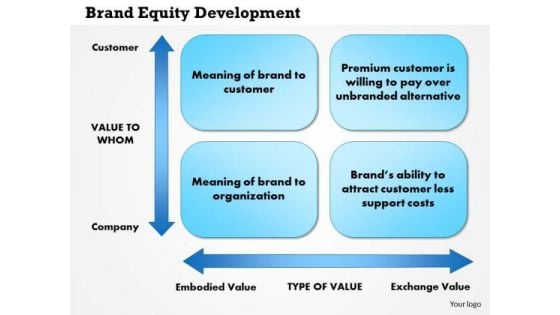
Business Framework Brand Equity Development PowerPoint Presentation
This power point diagram slide has been crafted with graphic of two axial flow chart. This chart refers to the concept of brand equity development. Display this concept in your presentations and get detailed information about brand architecture.
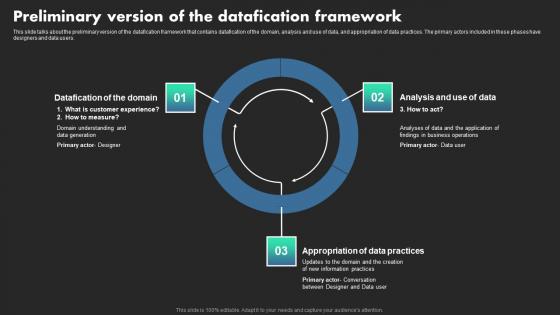
Preliminary Version Of The Datafication Framework Ethical Dimensions Of Datafication Formats Pdf
This slide talks about the preliminary version of the datafication framework that contains datafication of the domain, analysis and use of data, and appropriation of data practices. The primary actors included in these phases have designers and data users. Slidegeeks is one of the best resources for PowerPoint templates. You can download easily and regulate Preliminary Version Of The Datafication Framework Ethical Dimensions Of Datafication Formats Pdf for your personal presentations from our wonderful collection. A few clicks is all it takes to discover and get the most relevant and appropriate templates. Use our Templates to add a unique zing and appeal to your presentation and meetings. All the slides are easy to edit and you can use them even for advertisement purposes. This slide talks about the preliminary version of the datafication framework that contains datafication of the domain, analysis and use of data, and appropriation of data practices. The primary actors included in these phases have designers and data users.
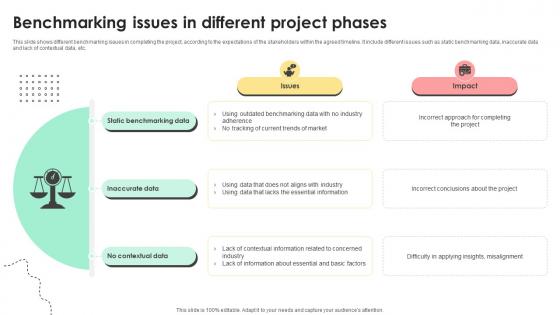
Administering Quality Assurance Benchmarking Issues In Different Project Phases PM SS V
This slide shows different benchmarking issues in completing the project, according to the expectations of the stakeholders within the agreed timeline. It include different issues such as static benchmarking data, inaccurate data and lack of contextual data, etc. Create an editable Administering Quality Assurance Benchmarking Issues In Different Project Phases PM SS V that communicates your idea and engages your audience. Whether you are presenting a business or an educational presentation, pre-designed presentation templates help save time. Administering Quality Assurance Benchmarking Issues In Different Project Phases PM SS V is highly customizable and very easy to edit, covering many different styles from creative to business presentations. Slidegeeks has creative team members who have crafted amazing templates. So, go and get them without any delay. This slide shows different benchmarking issues in completing the project, according to the expectations of the stakeholders within the agreed timeline. It include different issues such as static benchmarking data, inaccurate data and lack of contextual data, etc.
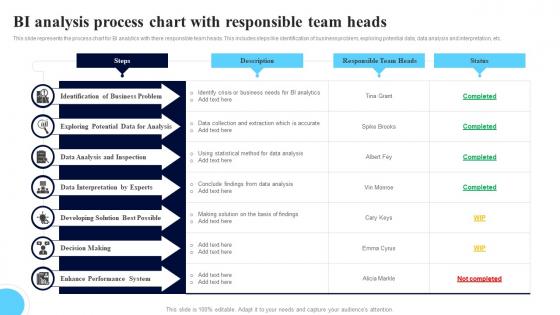
BI Analysis Process Chart With Responsible Team Heads Mockup Pdf
This slide represents the process chart for BI analytics with there responsible team heads. This includes steps like identification of business problem, exploring potential data, data analysis and interpretation, etc. Showcasing this set of slides titled BI Analysis Process Chart With Responsible Team Heads Mockup Pdf. The topics addressed in these templates are Identification Of Business, Data Analysis, Data Interpretation. All the content presented in this PPT design is completely editable. Download it and make adjustments in color, background, font etc. as per your unique business setting. This slide represents the process chart for BI analytics with there responsible team heads. This includes steps like identification of business problem, exploring potential data, data analysis and interpretation, etc.
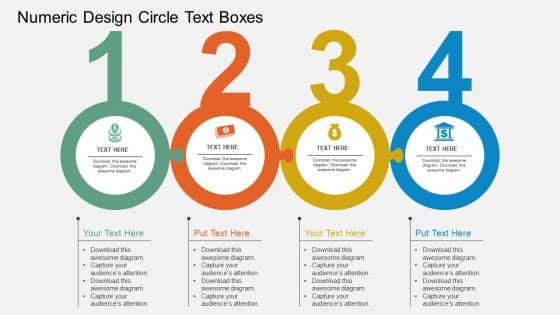
Numeric Design Circle Text Boxes Powerpoint Template
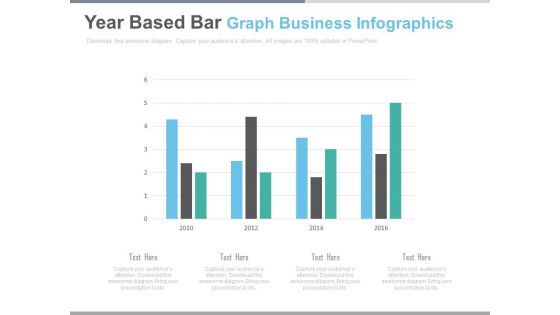
Bar Graph For Yearly Statistical Analysis Powerpoint Slides
This PowerPoint template has been designed with bar graph. This PowerPoint diagram is useful to exhibit yearly statistical analysis. This diagram slide can be used to make impressive presentations.
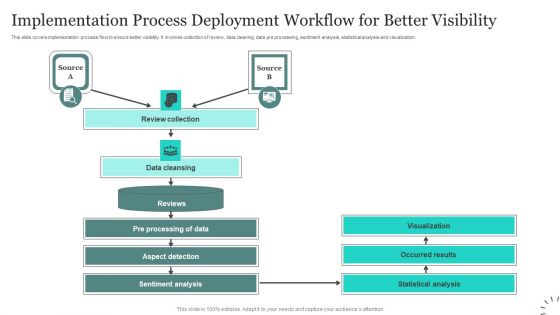
Implementation Process Deployment Workflow For Better Visibility Designs PDF
This slide covers implementation process flow to ensure better visibility. It involves collection of review, data cleaning, data pre processing, sentiment analysis, statistical analysis and visualization. Presenting Implementation Process Deployment Workflow For Better Visibility Designs PDF to dispense important information. This template comprises two stages. It also presents valuable insights into the topics including Review Collection, Data Cleansing, Aspect Detection. This is a completely customizable PowerPoint theme that can be put to use immediately. So, download it and address the topic impactfully.
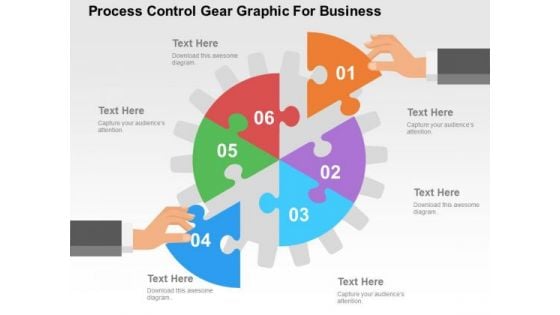
Process Control Gear Graphic For Business PowerPoint Template
Our professionally designed gear diagram is as an effective tool for communicating ideas. It contains graphics of gear with six segments. Convey your views with this diagram slide. It will amplify the strength of your logic.
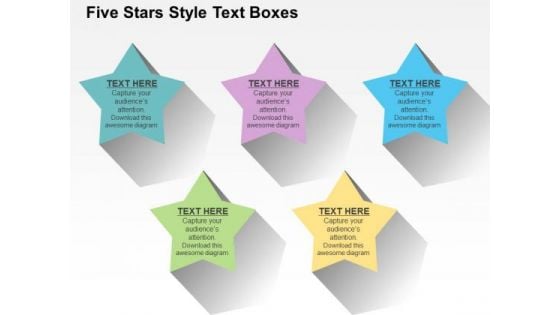
Five Stars Style Text Boxes PowerPoint Templates
This professional diagram slide has been designed with five colorful stars. You may use this diagram to present success steps. You can easily impart your information with help of this PowerPoint template.
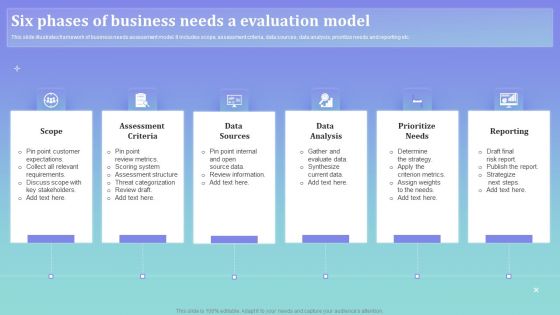
Six Phases Of Business Needs A Evaluation Model Ppt PowerPoint Presentation Gallery Portrait PDF
This slide illustrates framework of business needs assessment model. It includes scope, assessment criteria, data sources, data analysis, prioritize needs and reporting etc. Persuade your audience using this Six Phases Of Business Needs A Evaluation Model Ppt PowerPoint Presentation Gallery Portrait PDF. This PPT design covers six stages, thus making it a great tool to use. It also caters to a variety of topics including Assessment Criteria, Data Sources, Data Analysis. Download this PPT design now to present a convincing pitch that not only emphasizes the topic but also showcases your presentation skills.
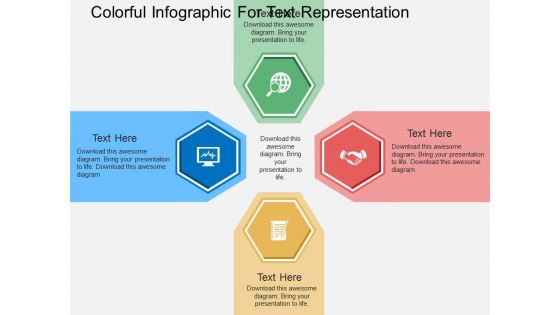
Colorful Infographic For Text Representation Powerpoint Templates
Our above business diagram has been designed with colorful circular tags with icons. This slide is suitable for text representation in visual manner. Use this business diagram to present your work in a more smart and precise manner.
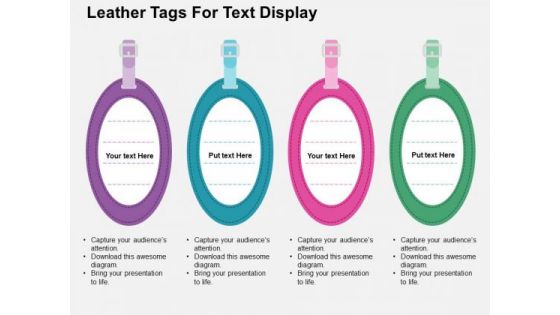
Leather Tags For Text Display PowerPoint Templates
Our professionally designed business diagram is as an effective tool to present text information. It contains graphics of leather tags. Convey your views with this diagram slide. It will amplify the strength of your logic.
Operational And Technical Assurance Confidential Computing Technologies Inspiration Pdf
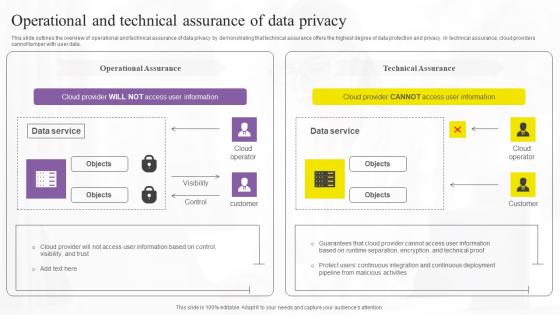
This slide outlines the overview of operational and technical assurance of data privacy by demonstrating that technical assurance offers the highest degree of data protection and privacy. In technical assurance, cloud providers cannot tamper with user data. Do you know about Slidesgeeks Operational And Technical Assurance Confidential Computing Technologies Inspiration Pdf These are perfect for delivering any kind od presentation. Using it, create PowerPoint presentations that communicate your ideas and engage audiences. Save time and effort by using our pre-designed presentation templates that are perfect for a wide range of topic. Our vast selection of designs covers a range of styles, from creative to business, and are all highly customizable and easy to edit. Download as a PowerPoint template or use them as Google Slides themes. This slide outlines the overview of operational and technical assurance of data privacy by demonstrating that technical assurance offers the highest degree of data protection and privacy. In technical assurance, cloud providers cannot tamper with user data.
Structure Of BI Semantic Framework Ppt PowerPoint Presentation Icon Example PDF
Pitch your topic with ease and precision using this structure of bi semantic framework ppt powerpoint presentation icon example pdf. This layout presents information on data model, data access, business logic and queries, multi dimensional, relational, data sources, bi applications. It is also available for immediate download and adjustment. So, changes can be made in the color, design, graphics or any other component to create a unique layout.
Statistical Technique Tags For Market Research Powerpoint Template
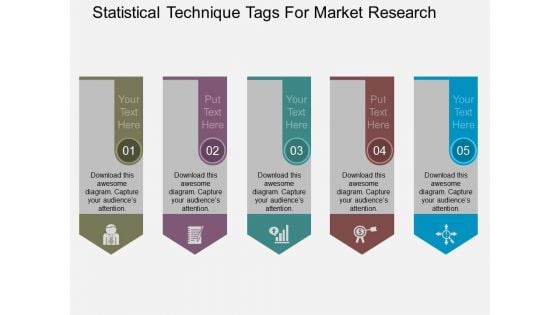
Graphic of arrows in linear flow has been used to design this business diagram. This diagram slide may be used to depict statistical techniques and market research. Use this editable slide to build quality presentation for your viewers.
Year 2016 Text With Icons Powerpoint Template
This PowerPoint template contains year 2016 text with icons. This diagram has been designed to exhibit concept of future planning. Use this diagram to set targets and to measure performance in your presentations.
Paint Brush Style Text Boxes Powerpoint Templates
Our above business diagram has been designed with graphics of paint brush style text boxes. This slide is suitable for text representation. Use this business diagram to present your work in a more smart and precise manner.
Business Daigram Abstract Hand Design Text Boxes Presentation Templets
This business slide contains graphics of hand diagram with five text boxes. This business diagram helps to depict five steps of any business process. Download this image to display information in visual manner.
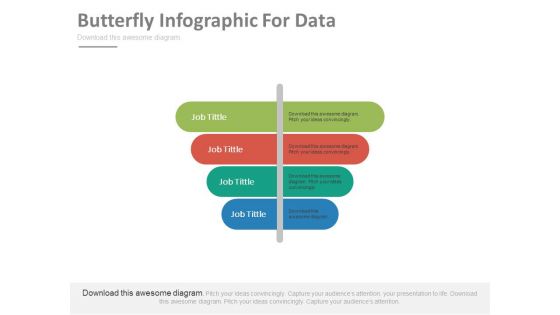
Four Butterfly Style Text Tags Powerpoint Template
This business slide contains butterfly style text tags. This diagram is suitable to present process steps. Visual effect of this diagram helps in maintaining the flow of the discussion and provides more clarity to the subject.
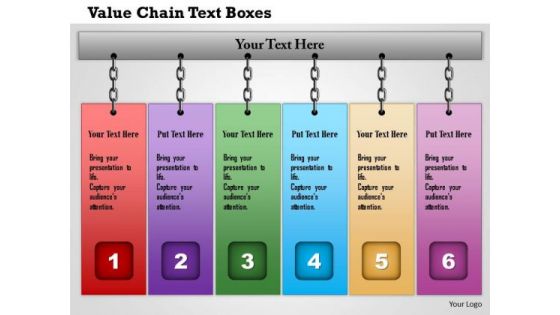
Business Framework Value Chain Text Boxes PowerPoint Presentation
This business diagram displays framework for value chain. This slide contains graphic of colorful tags in linear order. This editable diagram may be used for business and sales related presentations.
Marketing Mix Modelling Ppt PowerPoint Presentation Icon
This is a marketing mix modelling ppt powerpoint presentation icon. This is a nine stage process. The stages in this process are communication, modelling, data collection, budget allocation.
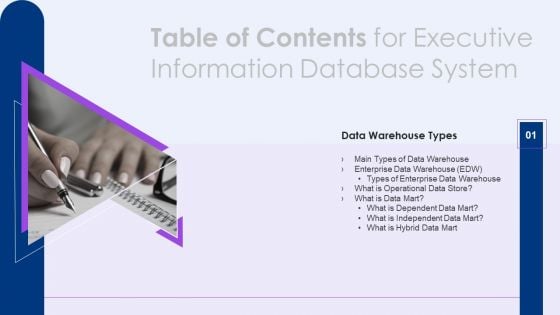
Table Of Contents For Executive Information Database System Slide Themes PDF
Presenting Table Of Contents For Executive Information Database System Slide Themes PDF to provide visual cues and insights. Share and navigate important information on one stage that need your due attention. This template can be used to pitch topics like Data Warehouse, Enterprise Data, Operational Data. In addtion, this PPT design contains high resolution images, graphics, etc, that are easily editable and available for immediate download.
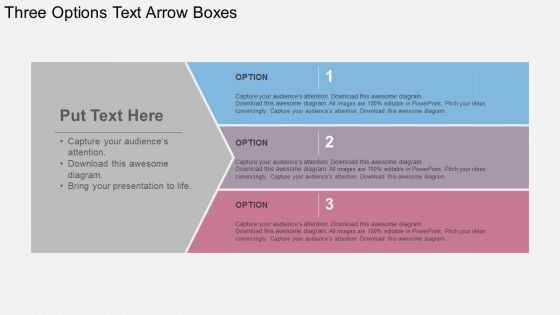
Three Options Text Arrow Boxes Powerpoint Templates
This business diagram displays graphic of arrows with icons. This power point template contains the concept of business analysis and research. Use this diagram to build unique presentation for your viewers.
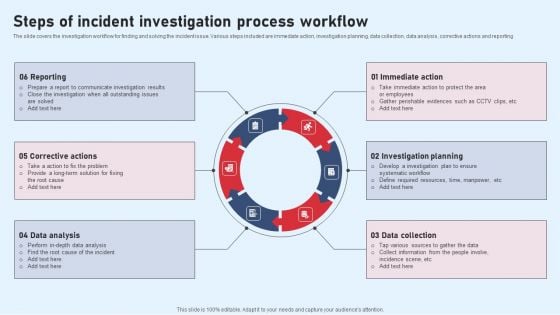
Steps Of Incident Investigation Process Workflow Designs PDF
The slide covers the investigation workflow for finding and solving the incident issue. Various steps included are immediate action, investigation planning, data collection, data analysis, corrective actions and reporting Presenting Steps Of Incident Investigation Process Workflow Designs PDF to dispense important information. This template comprises six stages. It also presents valuable insights into the topics including Reporting, Corrective Actions, Data Analysis. This is a completely customizable PowerPoint theme that can be put to use immediately. So, download it and address the topic impactfully.
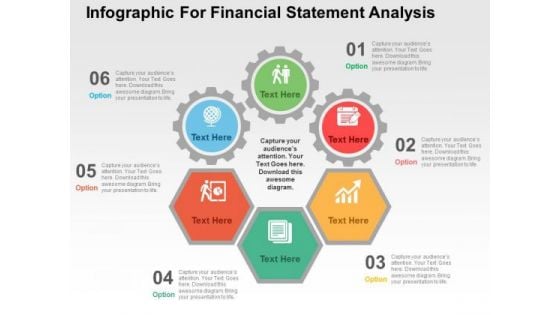
Infographic For Financial Statement Analysis PowerPoint Templates
This PowerPoint template contains infographic slide. This diagram has been designed with circular infographic to exhibit financial statement analysis. Use this diagram to set targets and to measure performance in your presentations.
Modern Text Boxes For Information Display PowerPoint Templates
Our professionally designed business diagram is as an effective tool to present text information. It contains graphics of text boxes. Convey your views with this diagram slide. It will amplify the strength of your logic.
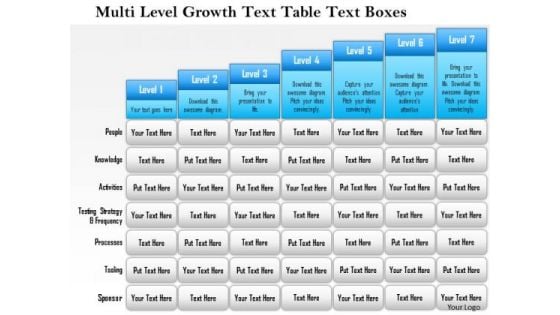
Business Framework Multi Level Growth Text Table Text Boxes 4 PowerPoint Presentation
Seven staged text box diagram has been used to decorate this Power Point template slide. This diagram slide contains the concept of multilevel growth. Use this template and build unique presentation for growth topic.
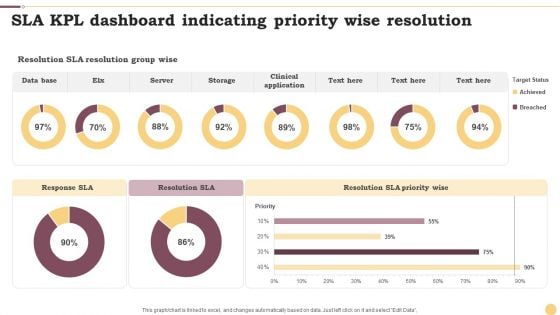
SLA KPL Dashboard Indicating Priority Wise Resolution Ppt Infographics Example File PDF
This graph or chart is linked to excel, and changes automatically based on data. Just left click on it and select Edit Data. Pitch your topic with ease and precision using this SLA KPL Dashboard Indicating Priority Wise Resolution Ppt Infographics Example File PDF. This layout presents information on Data Base, Server, Storage. It is also available for immediate download and adjustment. So, changes can be made in the color, design, graphics or any other component to create a unique layout.
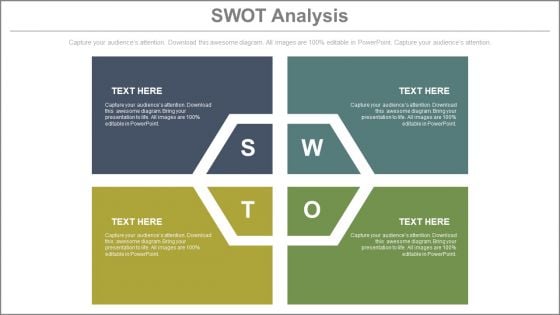
Four Text Boxes For Swot Analysis Powerpoint Slides
This PPT slide has been designed with graphics of four steps text boxes diagram. This business diagram helps to exhibit SWOT analysis. Use this PowerPoint template to build an exclusive presentation.
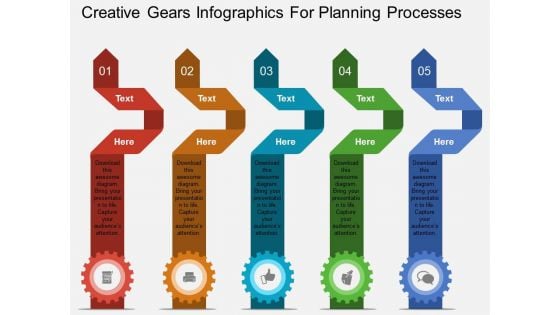
Creative Gears Infographics For Planning Processes Powerpoint Template
Our above diagram provides gears layout to display corporate planning. This diagram provides an effective way of displaying information you can edit text, color, shade and style as per you need.

Three Text Tags With Alphabets Powerpoint Templates
The above template displays a diagram of circular arrows with icons. This diagram has been professionally designed to display steps of financial planning. Capture the attention of your audience.
Collaborative Quality Control Process With Icons Ppt PowerPoint Presentation File Maker PDF
Persuade your audience using this collaborative quality control process with icons ppt powerpoint presentation file maker pdf. This PPT design covers four stages, thus making it a great tool to use. It also caters to a variety of topics including data reporting, data collection, data analysis. Download this PPT design now to present a convincing pitch that not only emphasizes the topic but also showcases your presentation skills.
Quality Audit Report Of Business With Icons Ppt PowerPoint Presentation Layouts Inspiration PDF
Pitch your topic with ease and precision using this quality audit report of business with icons ppt powerpoint presentation layouts inspiration pdf. This layout presents information on data quality audit, users and permissions audit, data cleansing performed, data migration permission received. It is also available for immediate download and adjustment. So, changes can be made in the color, design, graphics or any other component to create a unique layout.
Four Text Banners With Business Icons Powerpoint Template
This PowerPoint template has been designed with four text banners and business icons. This business diagram helps to exhibit sample marketing plan. Use this diagram to build an exclusive presentation.
Globe With Bars And Business Icons Powerpoint Templates
Bar graph with globe for statistical analysis has been displayed in this business slide. This business diagram helps to exhibit global statistical analysis and research. Use this diagram to build an exclusive presentation.
Mobile Style Text Boxes PowerPoint Templates
Our professionally designed business diagram is as an effective tool to present text information. It contains graphics of mobile style text boxes. Convey your views with this diagram slide. It will amplify the strength of your logic.

Internet Security Threat Analysis Report Chart Introduction PDF
Following slide exhibits security and data breach report chart it includes major statistics such as- loss or theft of data, failure to redirect data and data posting to incorrect recipient. Pitch your topic with ease and precision using this internet security threat analysis report chart introduction pdf. This layout presents information on internet security threat analysis report chart. It is also available for immediate download and adjustment. So, changes can be made in the color, design, graphics or any other component to create a unique layout.
Six Text Circles With Icons PowerPoint Templates
This creative PPT slide has been designed with graphics of circles. This business diagram is suitable for text representation. Use this diagram in business presentations to give better impact.
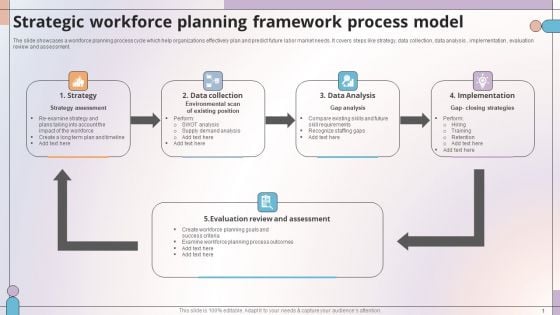
Strategic Workforce Planning Framework Process Model Summary PDF
The slide showcases a workforce planning process cycle which help organizations effectively plan and predict future labor market needs. It covers steps like strategy, data collection, data analysis , implementation , evaluation review and assessment. Presenting Strategic Workforce Planning Framework Process Model Summary PDF to dispense important information. This template comprises five stages. It also presents valuable insights into the topics including Strategy, Data Collection, Data Analysis. This is a completely customizable PowerPoint theme that can be put to use immediately. So, download it and address the topic impactfully.
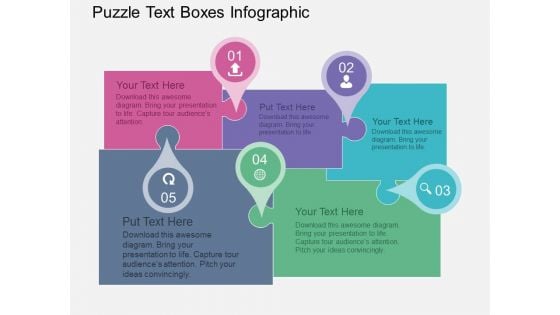
Puzzle Text Boxes Infographic Powerpoint Templates
Puzzle infographic has been used to design this power point template. This business diagram helps to depict concepts of marketing solution and strategy. Use this diagram to build unique presentation for your viewers.

Circle Of Four Text Boxes Powerpoint Templates
Our professionally designed circle diagram is as an effective tool for communicating ideas. It contains circle of four steps. Convey your views with this diagram slide. It will amplify the strength of your logic.
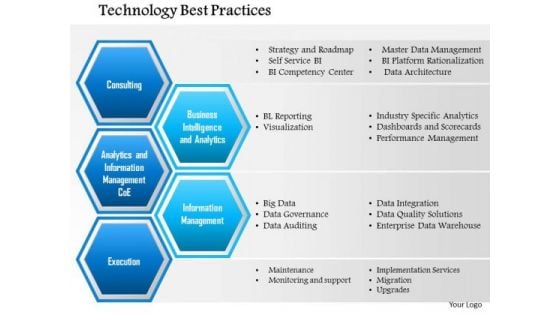
Business Framework Technology Best Practices PowerPoint Presentation
This business diagram displays framework for technology best practices. This slide contains graphic of five hexagons. These hexagons are used to show the best practices for technology. Use this editable diagram for your business and technology related presentations.
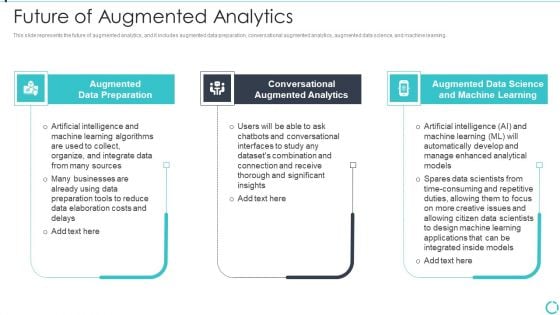
Augmented Analytics Implementation IT Future Of Augmented Analytics Brochure PDF
This slide represents the future of augmented analytics, and it includes augmented data preparation, conversational augmented analytics, augmented data science, and machine learning. Presenting Augmented Analytics Implementation IT Future Of Augmented Analytics Brochure PDF to provide visual cues and insights. Share and navigate important information on three stages that need your due attention. This template can be used to pitch topics like Augmented Data Preparation, Conversational Augmented Analytics, Augmented Data Science, Machine Learning. In addtion, this PPT design contains high resolution images, graphics, etc, that are easily editable and available for immediate download.
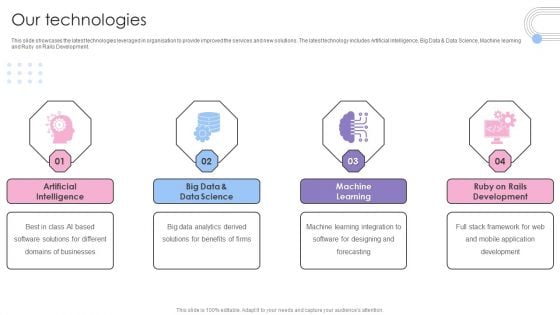
Software Products And Solutions Firm Details Our Technologies Inspiration PDF
This slide showcases the latest technologies leveraged in organisation to provide improved the services and new solutions. The latest technology includes Artificial Intelligence, Big Data and Data Science, Machine learning and Ruby on Rails Development. Presenting Software Products And Solutions Firm Details Our Technologies Inspiration PDF to provide visual cues and insights. Share and navigate important information on four stages that need your due attention. This template can be used to pitch topics like Artificial Intelligence, Big Data, Data Science, Machine Learning. In addtion, this PPT design contains high resolution images, graphics, etc, that are easily editable and available for immediate download.
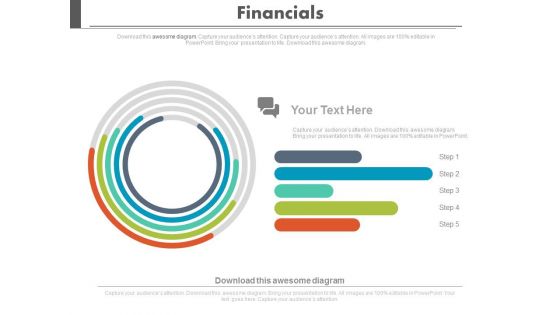
Financial Growth Analysis Circular Chart Powerpoint Slides
Visually support your presentation with our above template containing graphics of circular chart. This diagram slide helps to display financial growth analysis. Etch your views in the brains of your audience with this diagram slide.
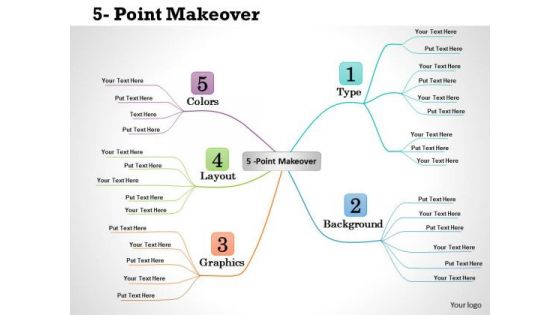
Business Framework Visual Information PowerPoint Presentation
This business power point template is designed with unique network diagram. This business diagram is useful to display visual information for any business process. Use this template for professional approach.
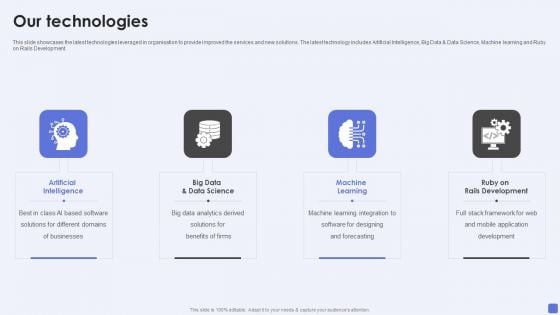
Software Services Business Profile Our Technologies Ppt PowerPoint Presentation Gallery Infographics PDF
This slide showcases the latest technologies leveraged in organisation to provide improved the services and new solutions. The latest technology includes Artificial Intelligence, Big Data and Data Science, Machine learning and Ruby on Rails Development. Presenting Software Services Business Profile Our Technologies Ppt PowerPoint Presentation Gallery Infographics PDF to provide visual cues and insights. Share and navigate important information on four stages that need your due attention. This template can be used to pitch topics like Artificial Intelligence, Big Data, Data Science, Machine Learning. In addtion, this PPT design contains high resolution images, graphics, etc, that are easily editable and available for immediate download.
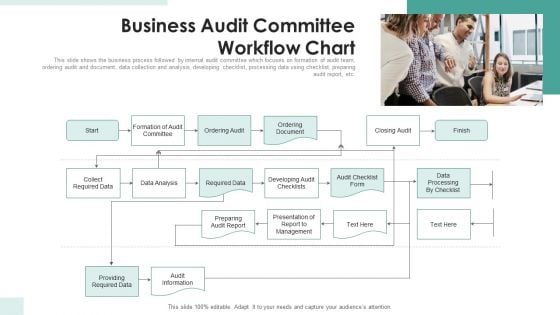
Business Audit Committee Workflow Chart Ppt PowerPoint Presentation Gallery Graphics Example PDF
This slide shows the business process followed by internal audit committee which focuses on formation of audit team, ordering audit and document, data collection and analysis, developing checklist, processing data using checklist, preparing audit report, etc. Persuade your audience using this business audit committee workflow chart ppt powerpoint presentation gallery graphics example pdf. This PPT design covers one stages, thus making it a great tool to use. It also caters to a variety of topics including data analysis, management, data processing. Download this PPT design now to present a convincing pitch that not only emphasizes the topic but also showcases your presentation skills.
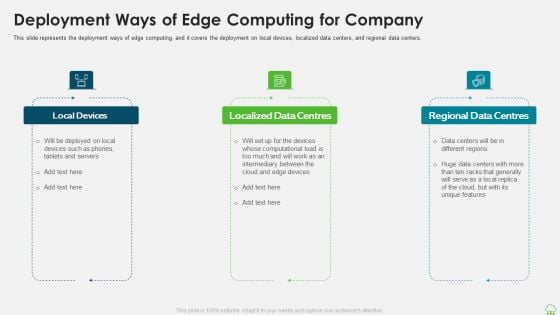
Distributed Computing IT Deployment Ways Of Edge Computing For Company Introduction PDF
This slide represents the deployment ways of edge computing, and it covers the deployment on local devices, localized data centers, and regional data centers. Presenting distributed computing it deployment ways of edge computing for company introduction pdf to provide visual cues and insights. Share and navigate important information on three stages that need your due attention. This template can be used to pitch topics like local devices, localized data centres, regional data centres. In addtion, this PPT design contains high resolution images, graphics, etc, that are easily editable and available for immediate download.
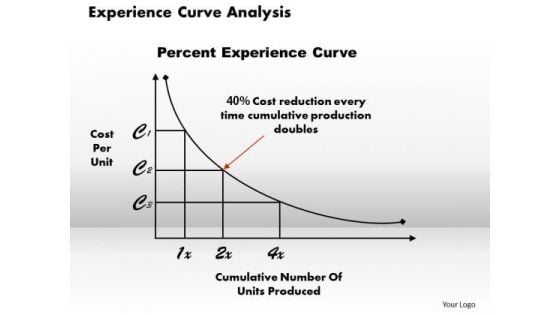
Business Framework Experience Curve Analysis PowerPoint Presentation
A two way linear curve has been used to design this PPT diagram. This business framework contains the concept of curve analysis and management. Use this PPT diagram for your business and management related topics.
Year 2016 Numbers With Icons Powerpoint Template
This PowerPoint template contains year 2016 numbers with icons. This diagram has been designed to exhibit concept of future planning. Use this diagram to set targets and to measure performance in your presentations.
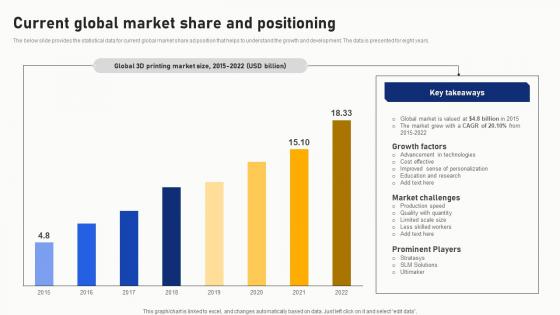
Current Global Market Share And Positioning Portrait Pdf
The below slide provides the statistical data for current global market share ad position that helps to understand the growth and development. The data is presented for eight years. Showcasing this set of slides titled Current Global Market Share And Positioning Portrait Pdf. The topics addressed in these templates are Current Global Market Share, Positioning. All the content presented in this PPT design is completely editable. Download it and make adjustments in color, background, font etc. as per your unique business setting. The below slide provides the statistical data for current global market share ad position that helps to understand the growth and development. The data is presented for eight years.
Iot And Digital Twin To Reduce Costs Post Covid Issues Arises While Implementing Iot Themes PDF
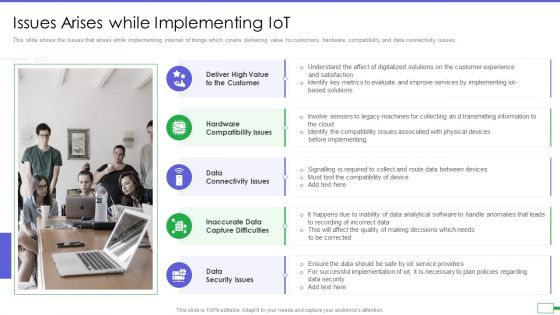
This slide shows the issues that arises while implementing internet of things which covers delivering value to customers, hardware compatibility and data connectivity issues. Presenting iot and digital twin to reduce costs post covid issues arises while implementing iot themes pdf to provide visual cues and insights. Share and navigate important information on five stages that need your due attention. This template can be used to pitch topics like high value to the customer, hardware compatibility issues, data connectivity issues, inaccurate data capture difficulties, data security issues. In addtion, this PPT design contains high resolution images, graphics, etc, that are easily editable and available for immediate download.
Business Framework Bond Prices And Yields PowerPoint Presentation
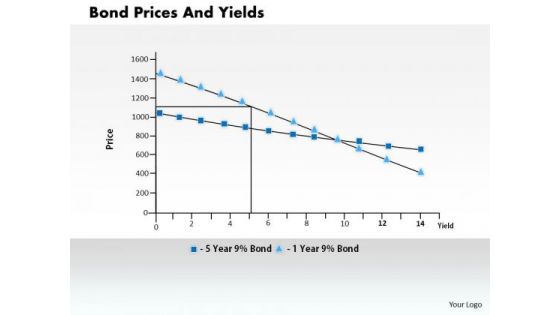
This power point diagram slide has been crafted with graphic of statistics of bond price and yields. Display the dependency in-between these two fields with this innovative diagram slide. This slide is very useful for financial presentations.
Business Framework Technology Strategies For A Sustainable 1 PowerPoint Presentation
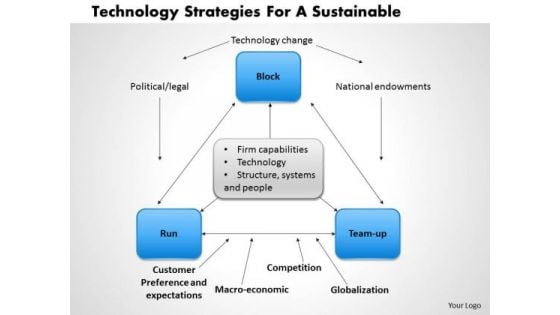
This business slide contains framework of technology strategies for a sustainable. It contains diagram of technology strategies depicting technology change for political, legal and national endowments. Download this diagram as a tool for business presentations.
Diamond Design For Swot Analysis Powerpoint Slides
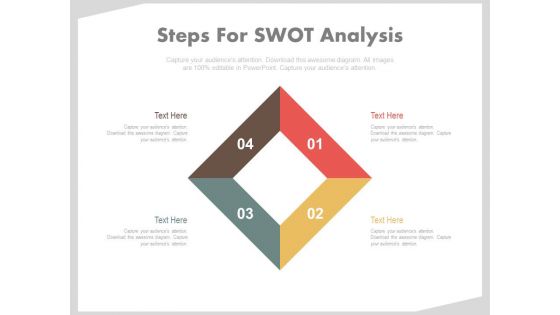
This PPT slide has been designed with graphics of four steps diamond diagram. This business diagram helps to exhibit SWOT analysis. Use this PowerPoint template to build an exclusive presentation.


 Continue with Email

 Home
Home


