Data Dashboard
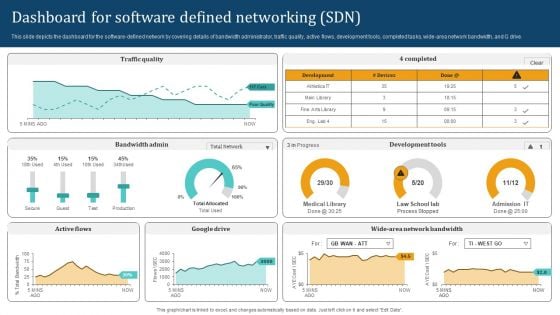
Empowering Network Agility Through SDN Dashboard For Software Defined Networking SDN Slides PDF
This slide depicts the dashboard for the software defined network by covering details of bandwidth administrator, traffic quality, active flows, development tools, completed tasks, wide area network bandwidth, and G drive. There are so many reasons you need a Empowering Network Agility Through SDN Dashboard For Software Defined Networking SDN Slides PDF. The first reason is you cannot spend time making everything from scratch, Thus, Slidegeeks has made presentation templates for you too. You can easily download these templates from our website easily.
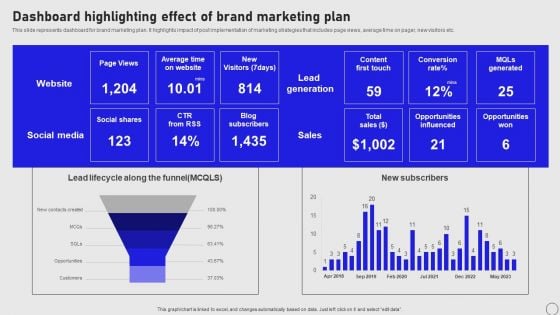
Implementing Annual Brand Marketing Strategy Dashboard Highlighting Effect Of Brand Marketing Plan Background PDF
This slide represents dashboard for brand marketing plan. It highlights impact of post implementation of marketing strategies that includes page views, average time on pager, new visitors etc. There are so many reasons you need a Implementing Annual Brand Marketing Strategy Dashboard Highlighting Effect Of Brand Marketing Plan Background PDF. The first reason is you cannot spend time making everything from scratch, Thus, Slidegeeks has made presentation templates for you too. You can easily download these templates from our website easily.
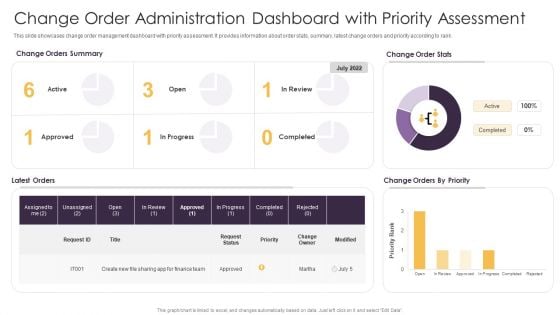
Change Order Administration Dashboard With Priority Assessment Ppt Portfolio Inspiration PDF
This slide showcases change order management dashboard with priority assessment. It provides information about order stats, summary, latest change orders and priority according to rank. Pitch your topic with ease and precision using this Change Order Administration Dashboard With Priority Assessment Ppt Portfolio Inspiration PDF. This layout presents information on Change Orders Priority, Change Order Stats, Change Orders Summary. It is also available for immediate download and adjustment. So, changes can be made in the color, design, graphics or any other component to create a unique layout.
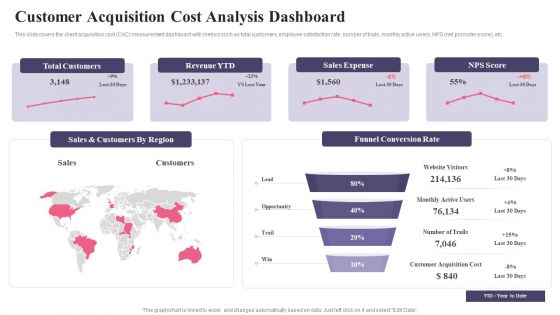
Comprehensive Guide To Acquire Customers Customer Acquisition Cost Analysis Dashboard Professional PDF
This slide covers the client acquisition cost CAC measurement dashboard with metrics such as total customers, employee satisfaction rate, number of trials, monthly active users, NPS net promoter score, etc.Find highly impressive Comprehensive Guide To Acquire Customers Customer Acquisition Cost Analysis Dashboard Professional PDF on Slidegeeks to deliver a meaningful presentation. You can save an ample amount of time using these presentation templates. No need to worry to prepare everything from scratch because Slidegeeks experts have already done a huge research and work for you. You need to download Comprehensive Guide To Acquire Customers Customer Acquisition Cost Analysis Dashboard Professional PDF for your upcoming presentation. All the presentation templates are 100 precent editable and you can change the color and personalize the content accordingly. Download now.
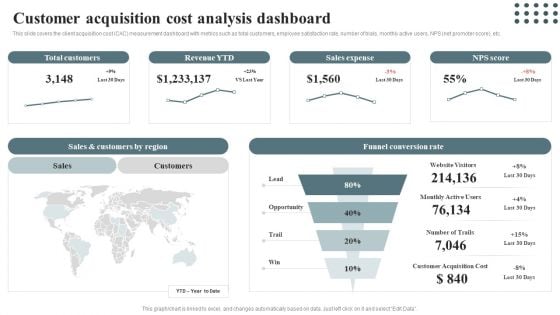
Techniques For Enhancing Buyer Acquisition Customer Acquisition Cost Analysis Dashboard Designs PDF
This slide covers the client acquisition cost CAC measurement dashboard with metrics such as total customers, employee satisfaction rate, number of trials, monthly active users, NPS net promoter score, etc.Explore a selection of the finest Techniques For Enhancing Buyer Acquisition Customer Acquisition Cost Analysis Dashboard Designs PDF here. With a plethora of professionally designed and pre-made slide templates, you can quickly and easily find the right one for your upcoming presentation. You can use our Techniques For Enhancing Buyer Acquisition Customer Acquisition Cost Analysis Dashboard Designs PDF to effectively convey your message to a wider audience. Slidegeeks has done a lot of research before preparing these presentation templates. The content can be personalized and the slides are highly editable. Grab templates today from Slidegeeks.
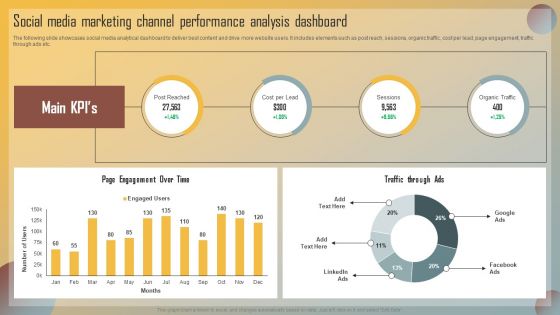
Guide For Marketing Analytics To Improve Decisions Social Media Marketing Channel Performance Analysis Dashboard Background PDF
The following slide showcases social media analytical dashboard to deliver best content and drive more website users. It includes elements such as post reach, sessions, organic traffic, cost per lead, page engagement, traffic through ads etc. Do you have an important presentation coming up Are you looking for something that will make your presentation stand out from the rest Look no further than Guide For Marketing Analytics To Improve Decisions Social Media Marketing Channel Performance Analysis Dashboard Background PDF. With our professional designs, you can trust that your presentation will pop and make delivering it a smooth process. And with Slidegeeks, you can trust that your presentation will be unique and memorable. So why wait Grab Guide For Marketing Analytics To Improve Decisions Social Media Marketing Channel Performance Analysis Dashboard Background PDF today and make your presentation stand out from the rest.
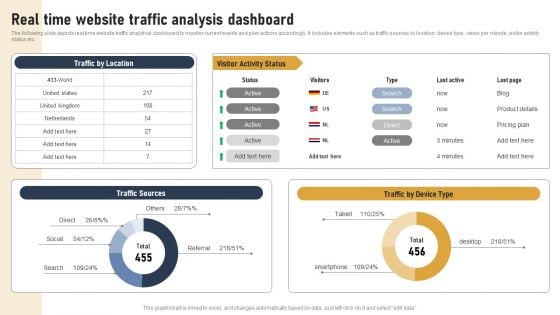
Incorporating Real Time Marketing For Improved Consumer Real Time Website Traffic Analysis Dashboard Elements PDF
The following slide depicts real time website traffic analytical dashboard to monitor current events and plan actions accordingly. It includes elements such as traffic sources by location, device type, views per minute, visitor activity status etc. Explore a selection of the finest Incorporating Real Time Marketing For Improved Consumer Real Time Website Traffic Analysis Dashboard Elements PDF here. With a plethora of professionally designed and pre made slide templates, you can quickly and easily find the right one for your upcoming presentation. You can use our Incorporating Real Time Marketing For Improved Consumer Real Time Website Traffic Analysis Dashboard Elements PDF to effectively convey your message to a wider audience. Slidegeeks has done a lot of research before preparing these presentation templates. The content can be personalized and the slides are highly editable. Grab templates today from Slidegeeks.
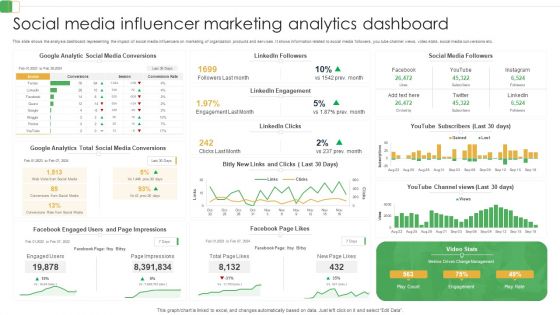
Social Media Influencer Marketing Analytics Dashboard Ppt PowerPoint Presentation File Inspiration PDF
This slide shows the analysis dashboard representing the impact of social media influencers on marketing of organization products and services. It shows information related to social media followers, you tube channel views, video stats, social media conversions etc.Showcasing this set of slides titled Social Media Influencer Marketing Analytics Dashboard Ppt PowerPoint Presentation File Inspiration PDF. The topics addressed in these templates are Linkedin Engagement, Media Conversions, Facebook Engaged. All the content presented in this PPT design is completely editable. Download it and make adjustments in color, background, font etc. as per your unique business setting.
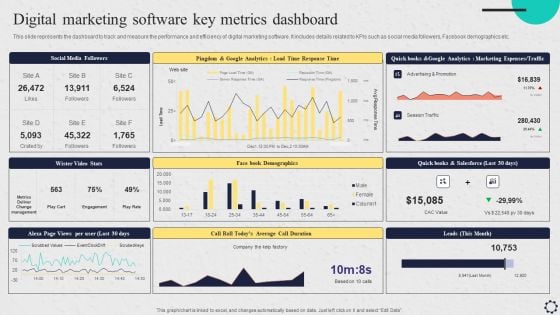
Software Implementation Strategy Digital Marketing Software Key Metrics Dashboard Template PDF
This slide represents the dashboard to track and measure the performance and efficiency of digital marketing software. It includes details related to KPIs such as social media followers, Facebook demographics etc. Crafting an eye catching presentation has never been more straightforward. Let your presentation shine with this tasteful yet straightforward Software Implementation Strategy Digital Marketing Software Key Metrics Dashboard Template PDF template. It offers a minimalistic and classy look that is great for making a statement. The colors have been employed intelligently to add a bit of playfulness while still remaining professional. Construct the idealSoftware Implementation Strategy Digital Marketing Software Key Metrics Dashboard Template PDF that effortlessly grabs the attention of your audience Begin now and be certain to wow your customers.
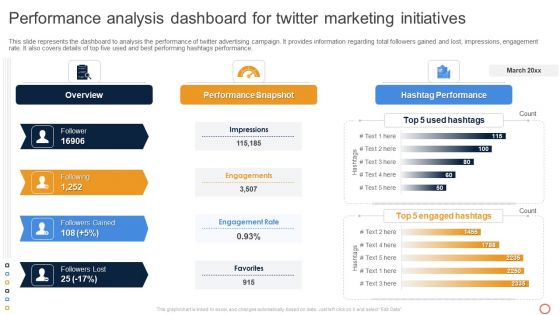
Leveraging Twitter For Social Performance Analysis Dashboard For Twitter Marketing Mockup PDF
This slide represents the dashboard to analysis the performance of twitter advertising campaign. It provides information regarding total followers gained and lost, impressions, engagement rate. It also covers details of top five used and best performing hashtags performance. Crafting an eye-catching presentation has never been more straightforward. Let your presentation shine with this tasteful yet straightforward Leveraging Twitter For Social Performance Analysis Dashboard For Twitter Marketing Mockup PDF template. It offers a minimalistic and classy look that is great for making a statement. The colors have been employed intelligently to add a bit of playfulness while still remaining professional. Construct the ideal Leveraging Twitter For Social Performance Analysis Dashboard For Twitter Marketing Mockup PDF that effortlessly grabs the attention of your audience Begin now and be certain to wow your customers
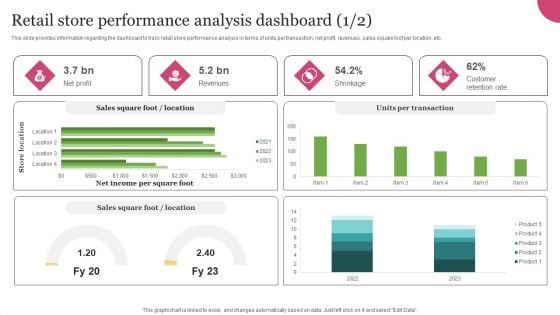
Experiential Retail Store Network Development Retail Store Performance Analysis Dashboard Themes PDF
This slide provides information regarding the dashboard to track retail store performance analysis in terms of units per transaction, net profit, revenues, sales square foot per location, etc. Crafting an eye-catching presentation has never been more straightforward. Let your presentation shine with this tasteful yet straightforward Experiential Retail Store Network Development Retail Store Performance Analysis Dashboard Themes PDF template. It offers a minimalistic and classy look that is great for making a statement. The colors have been employed intelligently to add a bit of playfulness while still remaining professional. Construct the ideal Experiential Retail Store Network Development Retail Store Performance Analysis Dashboard Themes PDF that effortlessly grabs the attention of your audience Begin now and be certain to wow your customers
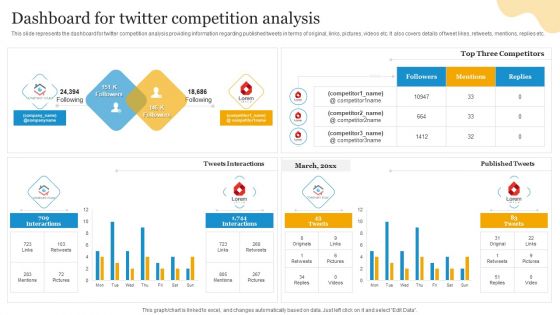
Social Media Advertising Through Twitter Dashboard For Twitter Competition Analysis Designs PDF
This slide represents the dashboard for twitter competition analysis providing information regarding published tweets in terms of original, links, pictures, videos etc. It also covers details of tweet likes, retweets, mentions, replies etc. Get a simple yet stunning designed Social Media Advertising Through Twitter Dashboard For Twitter Competition Analysis Designs PDF. It is the best one to establish the tone in your meetings. It is an excellent way to make your presentations highly effective. So, download this PPT today from Slidegeeks and see the positive impacts. Our easy to edit Social Media Advertising Through Twitter Dashboard For Twitter Competition Analysis Designs PDF can be your go to option for all upcoming conferences and meetings. So, what are you waiting for Grab this template today.
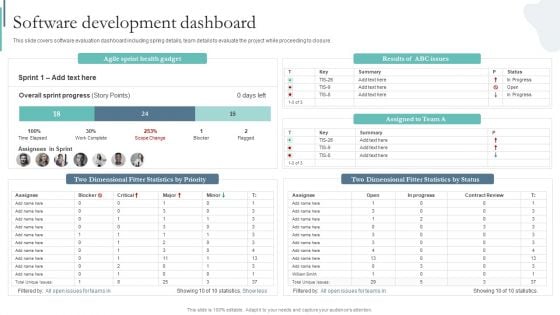
Agile Playbook For Program Designers Software Development Dashboard Ppt Infographics Brochure PDF
This slide covers software evaluation dashboard including spring details, team details to evaluate the project while proceeding to closure. If you are looking for a format to display your unique thoughts, then the professionally designed Agile Playbook For Program Designers Software Development Dashboard Ppt Infographics Brochure PDF is the one for you. You can use it as a Google Slides template or a PowerPoint template. Incorporate impressive visuals, symbols, images, and other charts. Modify or reorganize the text boxes as you desire. Experiment with shade schemes and font pairings. Alter, share or cooperate with other people on your work. Download Agile Playbook For Program Designers Software Development Dashboard Ppt Infographics Brochure PDF and find out how to give a successful presentation. Present a perfect display to your team and make your presentation unforgettable.
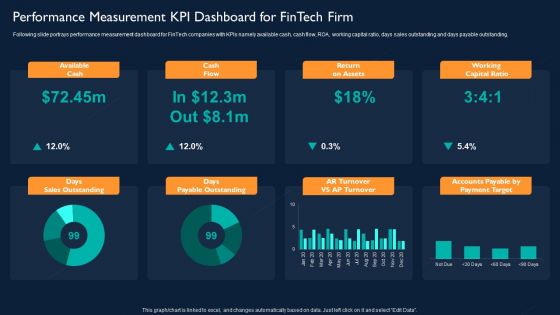
Technology Investment To Enhance Business Growth Performance Measurement KPI Dashboard For Fintech Firm Slides PDF
Following slide portrays performance measurement dashboard for FinTech companies with KPIs namely available cash, cash flow, ROA, working capital ratio, days sales outstanding and days payable outstanding. Deliver an awe inspiring pitch with this creative Technology Investment To Enhance Business Growth Performance Measurement KPI Dashboard For Fintech Firm Slides PDF bundle. Topics like Available Cash, Cash Flow, Return On Assets, Working Capital Ratio can be discussed with this completely editable template. It is available for immediate download depending on the needs and requirements of the user.
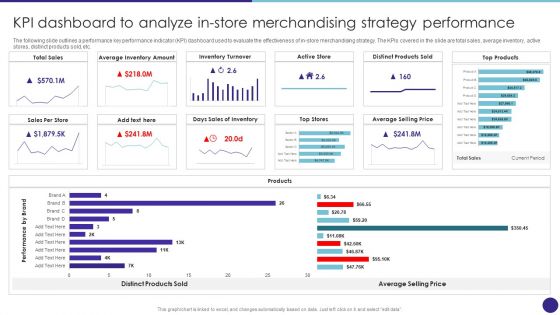
Kpi Dashboard To Analyze In Store Merchandising Strategy Performance Retail Merchandising Techniques Structure PDF
The following slide outlines a performance key performance indicator KPI dashboard used to evaluate the effectiveness of in-store merchandising strategy. The KPIs covered in the slide are total sales, average inventory, active stores, distinct products sold, etc.The Kpi Dashboard To Analyze In Store Merchandising Strategy Performance Retail Merchandising Techniques Structure PDF is a compilation of the most recent design trends as a series of slides. It is suitable for any subject or industry presentation, containing attractive visuals and photo spots for businesses to clearly express their messages. This template contains a variety of slides for the user to input data, such as structures to contrast two elements, bullet points, and slides for written information. Slidegeeks is prepared to create an impression.
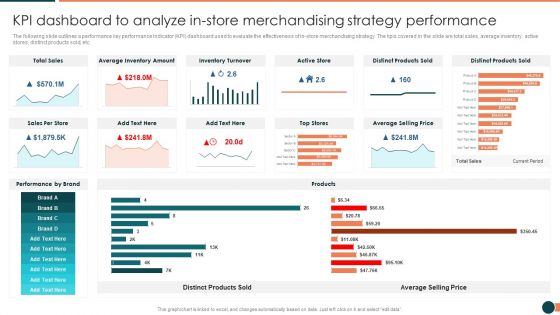
Developing Retail Marketing Strategies To Increase Revenue KPI Dashboard To Analyze Instore Information PDF
The following slide outlines a performance key performance indicator KPI dashboard used to evaluate the effectiveness of in store merchandising strategy. The kpis covered in the slide are total sales, average inventory, active stores, distinct products sold, etc.Deliver an awe inspiring pitch with this creative Developing Retail Marketing Strategies To Increase Revenue KPI Dashboard To Analyze Instore Information PDF bundle. Topics like Inventory Turnover, Distinct Products, Average Inventory can be discussed with this completely editable template. It is available for immediate download depending on the needs and requirements of the user.
Robotic Process Automation Metrics Dashboard For Tracking Business Return On Investment Information PDF
This slide illustrates KPI Dashboard for measuring time and money saved after RPA deployment. It also include metrics for analysis such as productivity in robot hours, hours saved per process, money saved per process, etc. Pitch your topic with ease and precision using this Robotic Process Automation Metrics Dashboard For Tracking Business Return On Investment Information PDF. This layout presents information on Management, Goal, Productivity. It is also available for immediate download and adjustment. So, changes can be made in the color, design, graphics or any other component to create a unique layout.
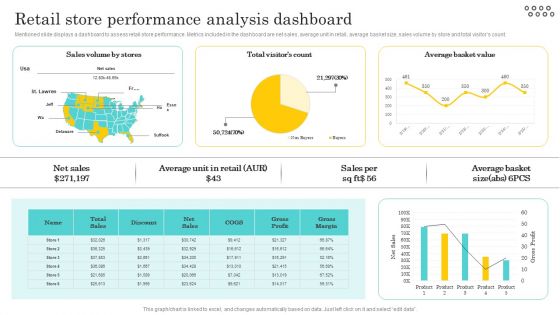
Optimizing And Managing Retail Retail Store Performance Analysis Dashboard Rules PDF
Mentioned slide displays a dashboard to assess retail store performance. Metrics included in the dashboard are net sales, average unit in retail, average basket size, sales volume by store and total visitors count. This Optimizing And Managing Retail Retail Store Performance Analysis Dashboard Rules PDF from Slidegeeks makes it easy to present information on your topic with precision. It provides customization options, so you can make changes to the colors, design, graphics, or any other component to create a unique layout. It is also available for immediate download, so you can begin using it right away. Slidegeeks has done good research to ensure that you have everything you need to make your presentation stand out. Make a name out there for a brilliant performance.
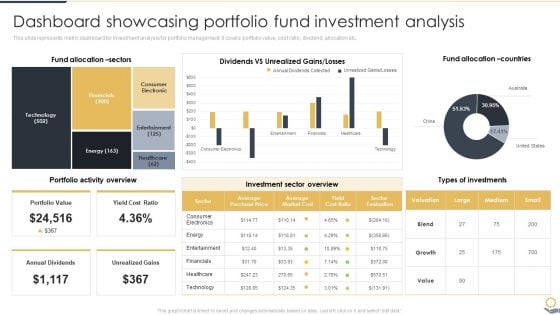
Dashboard Showcasing Portfolio Fund Investment Analysis Portfolio Investment Analysis Designs PDF
This slide represents metric dashboard for investment analysis for portfolio management. It covers portfolio value, cost ratio, dividend, allocation etc.Slidegeeks is one of the best resources for PowerPoint templates. You can download easily and regulate Dashboard Showcasing Portfolio Fund Investment Analysis Portfolio Investment Analysis Designs PDF for your personal presentations from our wonderful collection. A few clicks is all it takes to discover and get the most relevant and appropriate templates. Use our Templates to add a unique zing and appeal to your presentation and meetings. All the slides are easy to edit and you can use them even for advertisement purposes.
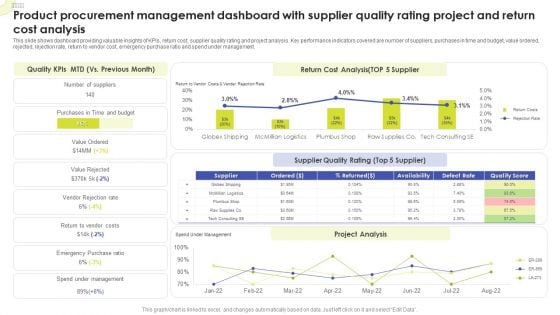
Product Procurement Management Dashboard With Supplier Quality Rating Project And Return Cost Analysis Sample PDF
This slide shows dashboard providing valuable insights of KPIs, return cost, supplier quality rating and project analysis. Key performance indicators covered are number of suppliers, purchases in time and budget, value ordered, rejected, rejection rate, return to vendor cost, emergency purchase ratio and spend under management. Pitch your topic with ease and precision using this Product Procurement Management Dashboard With Supplier Quality Rating Project And Return Cost Analysis Sample PDF. This layout presents information on Quality KPIs, Return Cost Analysis, Supplier Quality Rating. It is also available for immediate download and adjustment. So, changes can be made in the color, design, graphics or any other component to create a unique layout.
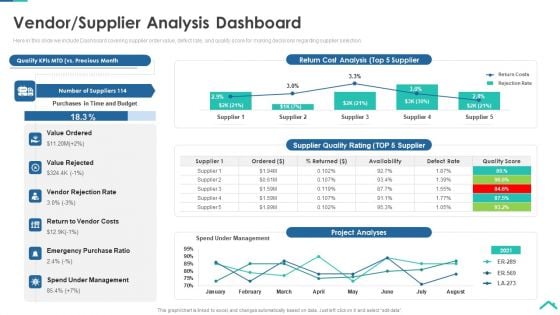
Risk Analysis Strategies For Real Estate Construction Project Vendor Supplier Analysis Dashboard Sample PDF
Here in this slide we include Dashboard covering supplier order value, defect rate, and quality score for making decisions regarding supplier selection. Deliver an awe inspiring pitch with this creative risk analysis strategies for real estate construction project vendor supplier analysis dashboard sample pdf bundle. Topics like value ordered, value rejected, vendor rejection rate, return to vendor costs, emergency purchase ratio, spend under management can be discussed with this completely editable template. It is available for immediate download depending on the needs and requirements of the user.
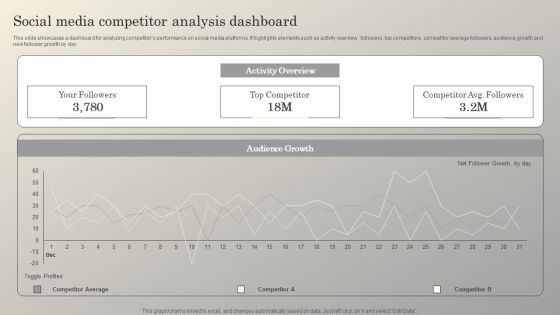
Steps To Conduct Competitor Analysis Social Media Competitor Analysis Dashboard Brochure PDF
This slide showcases a dashboard for analyzing competitors performance on social media platforms. It highlights elements such as activity overview, followers, top competitors, competitor average followers, audience growth and new follower growth by day. Find a pre-designed and impeccable Steps To Conduct Competitor Analysis Social Media Competitor Analysis Dashboard Brochure PDF. The templates can ace your presentation without additional effort. You can download these easy-to-edit presentation templates to make your presentation stand out from others. So, what are you waiting for Download the template from Slidegeeks today and give a unique touch to your presentation.
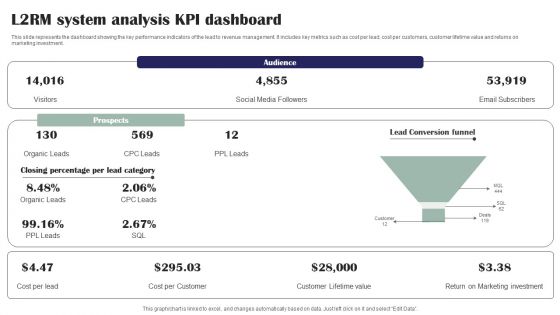
L2RM System Analysis KPI Dashboard Ppt PowerPoint Presentation File Microsoft PDF
This slide represents the dashboard showing the key performance indicators of the lead to revenue management. It includes key metrics such as cost per lead, cost per customers, customer lifetime value and returns on marketing investment. Presenting L2RM System Analysis KPI Dashboard Ppt PowerPoint Presentation File Microsoft PDF to dispense important information. This template comprises one stages. It also presents valuable insights into the topics including Audience, Prospects, Lead Conversion Funnel. This is a completely customizable PowerPoint theme that can be put to use immediately. So, download it and address the topic impactfully.
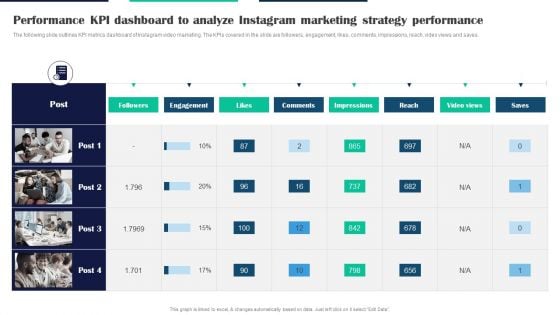
Executing Video Promotional Performance KPI Dashboard To Analyze Instagram Marketing Download PDF
The following slide outlines KPI metrics dashboard of Instagram video marketing. The KPIs covered in the slide are followers, engagement, likes, comments, impressions, reach, video views and saves. Are you searching for a Executing Video Promotional Performance KPI Dashboard To Analyze Instagram Marketing Download PDF that is uncluttered, straightforward, and original Its easy to edit, and you can change the colors to suit your personal or business branding. For a presentation that expresses how much effort youve put in, this template is ideal With all of its features, including tables, diagrams, statistics, and lists, its perfect for a business plan presentation. Make your ideas more appealing with these professional slides. Download Executing Video Promotional Performance KPI Dashboard To Analyze Instagram Marketing Download PDF from Slidegeeks today.
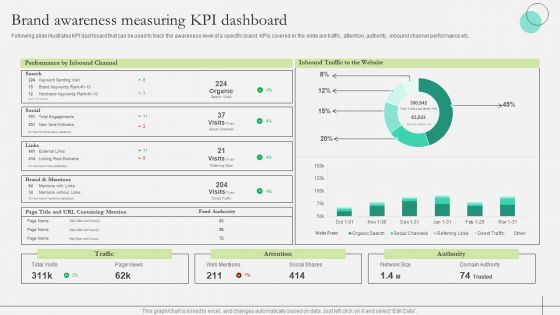
Comprehensive Guide To Strengthen Brand Equity Brand Awareness Measuring KPI Dashboard Rules PDF
Following slide illustrates KPI dashboard that can be used to track the awareness level of a specific brand. KPIs covered in the slide are traffic, attention, authority, inbound channel performance etc. Are you searching for a Comprehensive Guide To Strengthen Brand Equity Brand Awareness Measuring KPI Dashboard Rules PDF that is uncluttered, straightforward, and original Its easy to edit, and you can change the colors to suit your personal or business branding. For a presentation that expresses how much effort you have put in, this template is ideal With all of its features, including tables, diagrams, statistics, and lists, its perfect for a business plan presentation. Make your ideas more appealing with these professional slides. Download Comprehensive Guide To Strengthen Brand Equity Brand Awareness Measuring KPI Dashboard Rules PDF from Slidegeeks today.
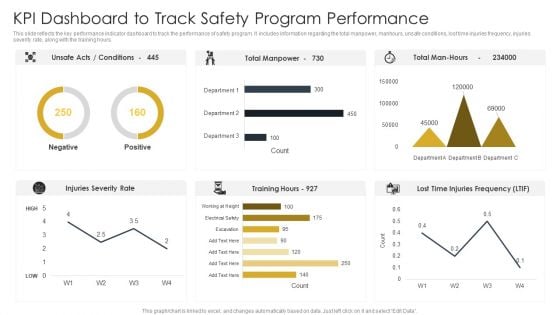
Kpi Dashboard To Track Safety Program Performance Construction Site Safety Plan Summary PDF
This slide reflects the key performance indicator dashboard to track the performance of safety program. It includes information regarding the total manpower, manhours, unsafe conditions, lost time injuries frequency, injuries severity rate, along with the training hours. The Kpi Dashboard To Track Safety Program Performance Construction Site Safety Plan Summary PDF is a compilation of the most recent design trends as a series of slides. It is suitable for any subject or industry presentation, containing attractive visuals and photo spots for businesses to clearly express their messages. This template contains a variety of slides for the user to input data, such as structures to contrast two elements, bullet points, and slides for written information. Slidegeeks is prepared to create an impression.
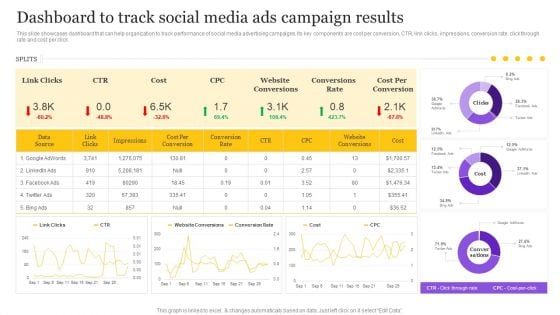
Digital Marketing Strategy Dashboard To Track Social Media Ads Campaign Results Introduction PDF
This slide showcases dashboard that can help organization to track performance of social media advertising campaigns. Its key components are cost per conversion, CTR, link clicks, impressions, conversion rate, click through rate and cost per click. The Digital Marketing Strategy Dashboard To Track Social Media Ads Campaign Results Introduction PDF is a compilation of the most recent design trends as a series of slides. It is suitable for any subject or industry presentation, containing attractive visuals and photo spots for businesses to clearly express their messages. This template contains a variety of slides for the user to input data, such as structures to contrast two elements, bullet points, and slides for written information. Slidegeeks is prepared to create an impression.
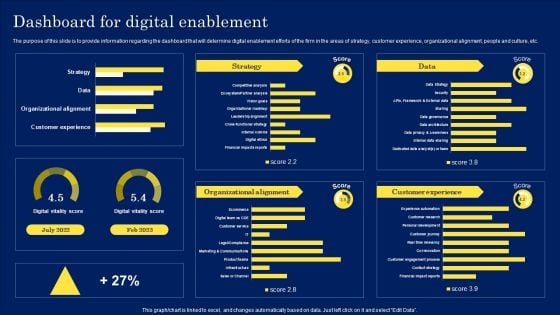
Digitization Framework For Technology Advancement Dashboard For Digital Enablement Ideas PDF
The purpose of this slide is to provide information regarding the dashboard that will determine digital enablement efforts of the firm in the areas of strategy, customer experience, organizational alignment, people and culture, etc. There are so many reasons you need a Digitization Framework For Technology Advancement Dashboard For Digital Enablement Ideas PDF. The first reason is you can not spend time making everything from scratch, Thus, Slidegeeks has made presentation templates for you too. You can easily download these templates from our website easily.
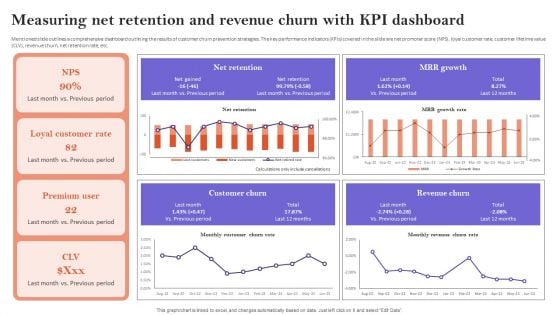
Measuring Net Retention And Revenue Churn With Kpi Dashboard Ideas PDF
Mentioned slide outlines a comprehensive dashboard outlining the results of customer churn prevention strategies. The key performance indicators KPIs covered in the slide are net promoter score NPS, loyal customer rate, customer lifetime value CLV, revenue churn, net retention rate, etc. The Measuring Net Retention And Revenue Churn With Kpi Dashboard Ideas PDF is a compilation of the most recent design trends as a series of slides. It is suitable for any subject or industry presentation, containing attractive visuals and photo spots for businesses to clearly express their messages. This template contains a variety of slides for the user to input data, such as structures to contrast two elements, bullet points, and slides for written information. Slidegeeks is prepared to create an impression.
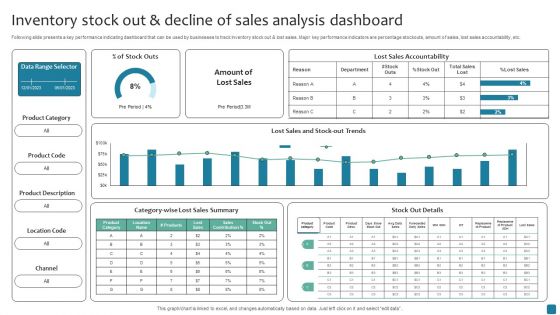
Inventory Stock Out And Decline Of Sales Analysis Dashboard Inspiration PDF
Following slide presents a key performance indicating dashboard that can be used by businesses to track Inventory stock out and lost sales. Major key performance indicators are percentage stockouts, amount of sales, lost sales accountability, etc. Pitch your topic with ease and precision using this Inventory Stock Out And Decline Of Sales Analysis Dashboard Inspiration PDF. This layout presents information on Lost Sales Summary, Stock Out Details It is also available for immediate download and adjustment. So, changes can be made in the color, design, graphics or any other component to create a unique layout.
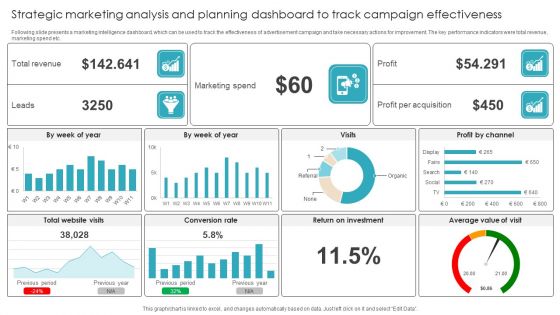
Strategic Marketing Analysis And Planning Dashboard To Track Campaign Effectiveness Summary PDF
Following slide presents a marketing intelligence dashboard, which can be used to track the effectiveness of advertisement campaign and take necessary actions for improvement. The key performance indicators were total revenue, marketing spend etc. Showcasing this set of slides titled Strategic Marketing Analysis And Planning Dashboard To Track Campaign Effectiveness Summary PDF. The topics addressed in these templates are Marketing Spend, Conversion Rate, Return Investment. All the content presented in this PPT design is completely editable. Download it and make adjustments in color, background, font etc. as per your unique business setting.
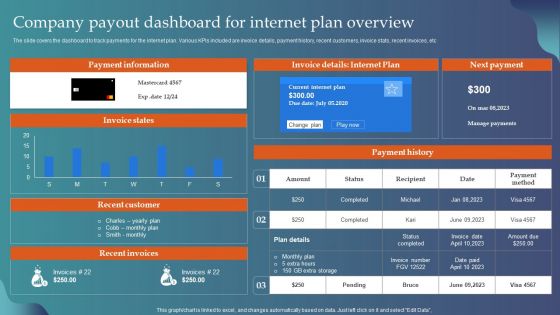
Company Payout Dashboard For Internet Plan Overview Ppt Layouts Templates PDF
The slide covers the dashboard to track payments for the internet plan. Various KPIs included are invoice details, payment history, recent customers, invoice stats, recent invoices, etc. Showcasing this set of slides titled Company Payout Dashboard For Internet Plan Overview Ppt Layouts Templates PDF. The topics addressed in these templates are Payment Information, Invoice Details, Internet Plan, Next Payment. All the content presented in this PPT design is completely editable. Download it and make adjustments in color, background, font etc. as per your unique business setting.
Monthly Project Progress Report Dashboard With Execution Timeline Ppt Icon Graphics Tutorials PDF
This slide showcases monthly project status dashboard with execution timeline. It provides information about sponsor, financials, budget, key risks and issues, work stream , etc. Presenting Monthly Project Progress Report Dashboard With Execution Timeline Ppt Icon Graphics Tutorials PDF to dispense important information. This template comprises one stages. It also presents valuable insights into the topics including Execution Timeline, Project Status, Project Manager. This is a completely customizable PowerPoint theme that can be put to use immediately. So, download it and address the topic impactfully.
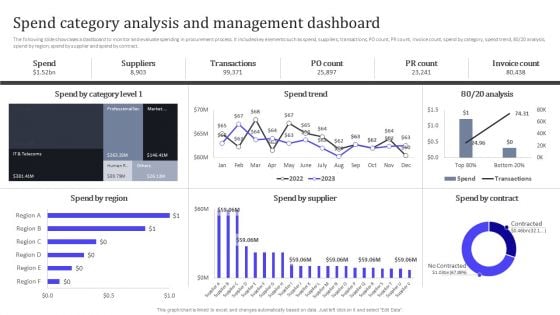
Spend Category Analysis And Management Dashboard Ppt PowerPoint Presentation Diagram PDF
The following slide showcases a dashboard to monitor and evaluate spending in procurement process. It includes key elements such as spend, suppliers, transactions, PO count, PR count, invoice count, spend by category, spend trend, 80 or 20 analysis, spend by region, spend by supplier and spend by contract. Do you have to make sure that everyone on your team knows about any specific topic I yes, then you should give Spend Category Analysis And Management Dashboard Ppt PowerPoint Presentation Diagram PDF a try. Our experts have put a lot of knowledge and effort into creating this impeccable Spend Category Analysis And Management Dashboard Ppt PowerPoint Presentation Diagram PDF. You can use this template for your upcoming presentations, as the slides are perfect to represent even the tiniest detail. You can download these templates from the Slidegeeks website and these are easy to edit. So grab these today.
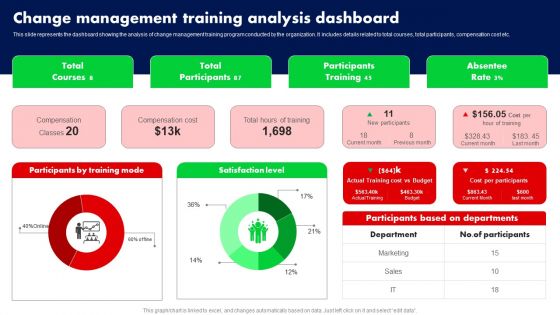
Change Management Training Analysis Dashboard Ppt PowerPoint Presentation File Layouts PDF
This slide represents the dashboard showing the analysis of change management training program conducted by the organization. It includes details related to total courses, total participants, compensation cost etc. Do you have to make sure that everyone on your team knows about any specific topic I yes, then you should give Change Management Training Analysis Dashboard Ppt PowerPoint Presentation File Layouts PDF a try. Our experts have put a lot of knowledge and effort into creating this impeccable Change Management Training Analysis Dashboard Ppt PowerPoint Presentation File Layouts PDF. You can use this template for your upcoming presentations, as the slides are perfect to represent even the tiniest detail. You can download these templates from the Slidegeeks website and these are easy to edit. So grab these today.
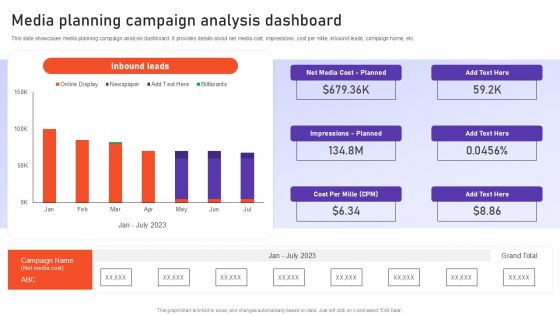
Media Planning Campaign Analysis Dashboard Ppt PowerPoint Presentation File Background Images PDF
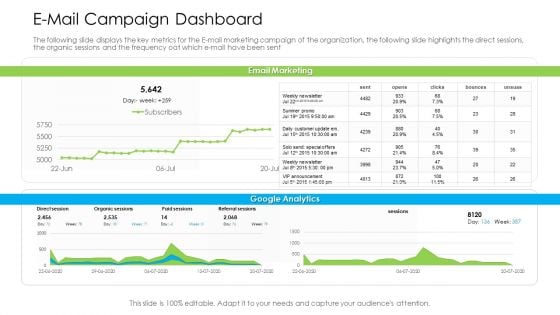
Marketing Techniques Online Offline Commercial Activities E Mail Campaign Dashboard Information PDF
The following slide displays the key metrics for the E-mail marketing campaign of the organization, the following slide highlights the direct sessions, the organic sessions and the frequency oat which e-mail have been sent Deliver an awe inspiring pitch with this creative marketing techniques online offline commercial activities e mail campaign dashboard information pdf bundle. Topics like e mail campaign dashboard can be discussed with this completely editable template. It is available for immediate download depending on the needs and requirements of the user.
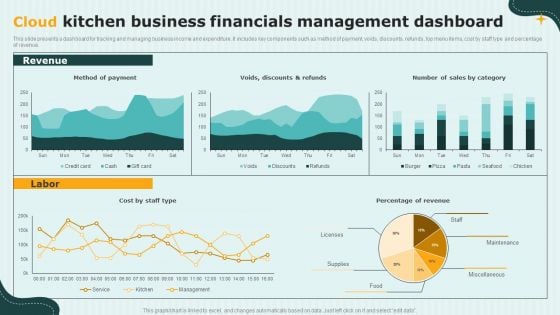
International Cloud Kitchen Industry Analysis Cloud Kitchen Business Financials Management Dashboard Template PDF
This slide presents a dashboard for tracking and managing business income and expenditure. It includes key components such as method of payment, voids, discounts, refunds, top menu items, cost by staff type and percentage of revenue. Do you have to make sure that everyone on your team knows about any specific topic I yes, then you should give International Cloud Kitchen Industry Analysis Cloud Kitchen Business Financials Management Dashboard Template PDF a try. Our experts have put a lot of knowledge and effort into creating this impeccable International Cloud Kitchen Industry Analysis Cloud Kitchen Business Financials Management Dashboard Template PDF. You can use this template for your upcoming presentations, as the slides are perfect to represent even the tiniest detail. You can download these templates from the Slidegeeks website and these are easy to edit. So grab these today
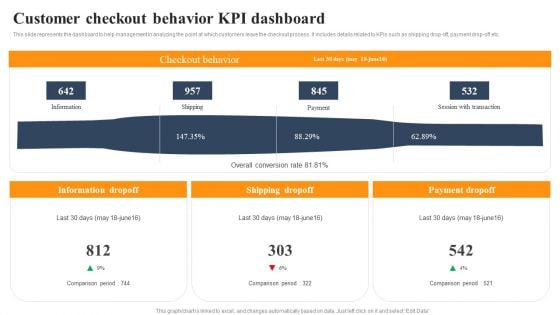
Implementing An Effective Ecommerce Management Framework Customer Checkout Behavior KPI Dashboard Designs PDF
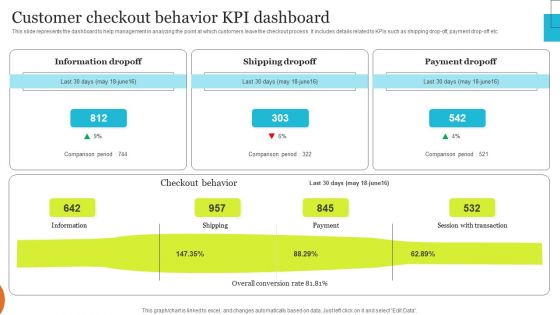
Implementing Effective Ecommerce Managemnet Platform Customer Checkout Behavior KPI Dashboard Sample PDF
This slide represents the dashboard to help management in analyzing the point at which customers leave the checkout process. It includes details related to KPIs such as shipping drop off, payment drop-off etc. Crafting an eye catching presentation has never been more straightforward. Let your presentation shine with this tasteful yet straightforward Implementing Effective Ecommerce Managemnet Platform Customer Checkout Behavior KPI Dashboard Sample PDF template. It offers a minimalistic and classy look that is great for making a statement. The colors have been employed intelligently to add a bit of playfulness while still remaining professional. Construct the ideal Implementing Effective Ecommerce Managemnet Platform Customer Checkout Behavior KPI Dashboard Sample PDF that effortlessly grabs the attention of your audience. Begin now and be certain to wow your customers.
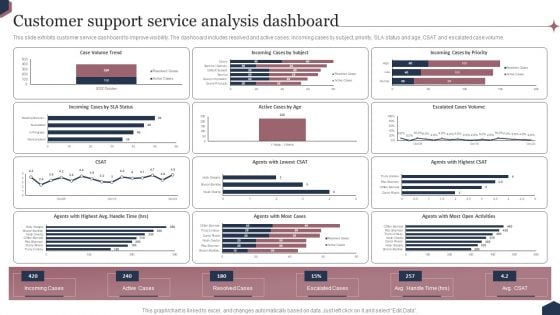
Enhance Customer Engagement Through After Sales Activities Customer Support Service Analysis Dashboard Diagrams Introduction PDF
This slide exhibits customer service dashboard to improve visibility. The dashboard includes resolved and active cases, incoming cases by subject, priority, SLA status and age, CSAT and escalated case volume. Slidegeeks is one of the best resources for PowerPoint templates. You can download easily and regulate Enhance Customer Engagement Through After Sales Activities Customer Support Service Analysis Dashboard Diagrams Introduction PDF for your personal presentations from our wonderful collection. A few clicks is all it takes to discover and get the most relevant and appropriate templates. Use our Templates to add a unique zing and appeal to your presentation and meetings. All the slides are easy to edit and you can use them even for advertisement purposes.
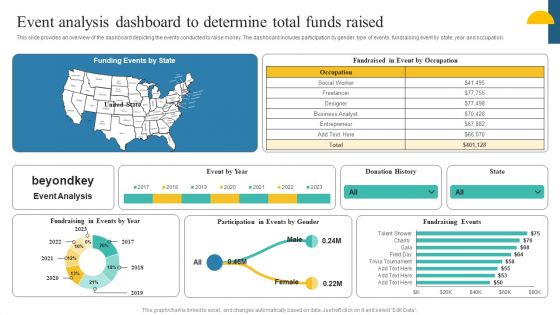
Charity Fundraising Marketing Plan Event Analysis Dashboard To Determine Total Guidelines PDF
This slide provides an overview of the dashboard depicting the events conducted to raise money. The dashboard includes participation by gender, type of events, fundraising event by state, year and occupation. This modern and well-arranged Charity Fundraising Marketing Plan Event Analysis Dashboard To Determine Total Guidelines PDF provides lots of creative possibilities. It is very simple to customize and edit with the Powerpoint Software. Just drag and drop your pictures into the shapes. All facets of this template can be edited with Powerpoint, no extra software is necessary. Add your own material, put your images in the places assigned for them, adjust the colors, and then you can show your slides to the world, with an animated slide included.
Effective NPO Promotional Strategies For Recruit Volunteers Event Analysis Dashboard Determine Total Funds Raised Icons PDF
This slide provides an overview of the dashboard depicting the events conducted to raise money. The dashboard includes participation by gender, type of events, fundraising event by state, year and occupation. This modern and well-arranged Effective NPO Promotional Strategies For Recruit Volunteers Event Analysis Dashboard Determine Total Funds Raised Icons PDF provides lots of creative possibilities. It is very simple to customize and edit with the Powerpoint Software. Just drag and drop your pictures into the shapes. All facets of this template can be edited with Powerpoint, no extra software is necessary. Add your own material, put your images in the places assigned for them, adjust the colors, and then you can show your slides to the world, with an animated slide included.
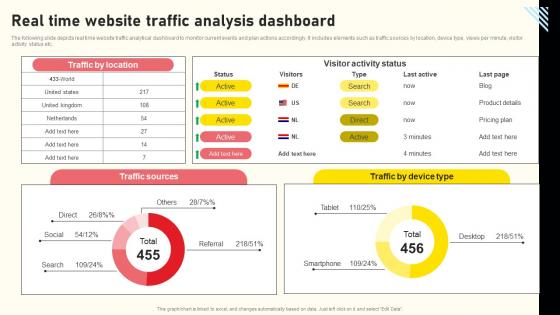
Effective Real Time Marketing Principles Real Time Website Traffic Analysis Dashboard Graphics Pdf
The following slide depicts real time website traffic analytical dashboard to monitor current events and plan actions accordingly. It includes elements such as traffic sources by location, device type, views per minute, visitor activity status etc. Present like a pro with Effective Real Time Marketing Principles Real Time Website Traffic Analysis Dashboard Graphics Pdf Create beautiful presentations together with your team, using our easy-to-use presentation slides. Share your ideas in real-time and make changes on the fly by downloading our templates. So whether you are in the office, on the go, or in a remote location, you can stay in sync with your team and present your ideas with confidence. With Slidegeeks presentation got a whole lot easier. Grab these presentations today. The following slide depicts real time website traffic analytical dashboard to monitor current events and plan actions accordingly. It includes elements such as traffic sources by location, device type, views per minute, visitor activity status etc.
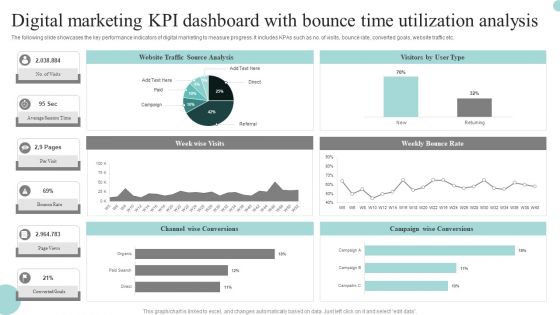
Digital Marketing Kpi Dashboard With Bounce Time Utilization Analysis Graphics PDF
The following slide showcases the key performance indicators of digital marketing to measure progress. It includes KPAs such as no. of visits, bounce rate, converted goals, website traffic etc. Pitch your topic with ease and precision using this Digital Marketing Kpi Dashboard With Bounce Time Utilization Analysis Graphics PDF. This layout presents information on Digital Marketing, KPI Dashboard, Bounce Time Utilization Analysis. It is also available for immediate download and adjustment. So, changes can be made in the color, design, graphics or any other component to create a unique layout.
B2B Marketing Content Administration Playbook Sales Management Activities Tracking Dashboard Brochure PDF
This slide provides information regarding sales meeting plan playing vital role in sales operation effectiveness, motivating sales team and improve overall productivity.Presenting b2b marketing content administration playbook sales management activities tracking dashboard brochure pdf to provide visual cues and insights. Share and navigate important information on three stages that need your due attention. This template can be used to pitch topics like sales management activities tracking dashboard In addtion, this PPT design contains high resolution images, graphics, etc, that are easily editable and available for immediate download.
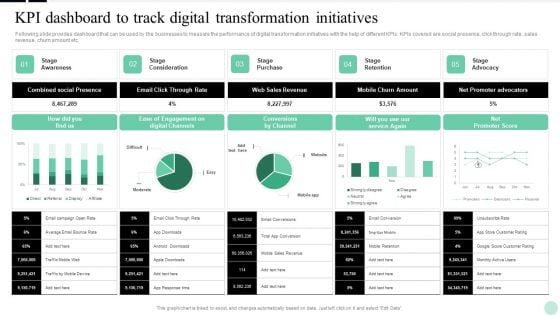
Implementing Digital Transformation Kpi Dashboard To Track Digital Transformation Initiatives Structure PDF
Following slide provides dashboard that can be used by the businesses to measure the performance of digital transformation initiatives with the help of different KPIs. KPIs covered are social presence, click through rate, sales revenue, churn amount etc. The Implementing Digital Transformation Kpi Dashboard To Track Digital Transformation Initiatives Structure PDF is a compilation of the most recent design trends as a series of slides. It is suitable for any subject or industry presentation, containing attractive visuals and photo spots for businesses to clearly express their messages. This template contains a variety of slides for the user to input data, such as structures to contrast two elements, bullet points, and slides for written information. Slidegeeks is prepared to create an impression.
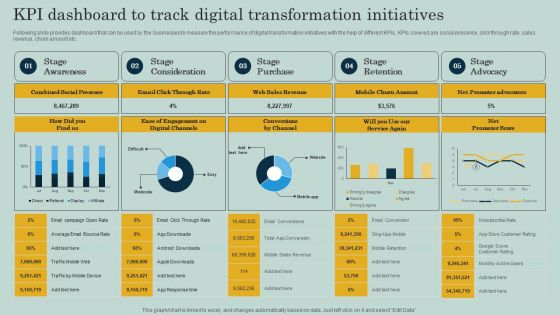
KPI Dashboard To Track Digital Transformation Initiatives Ppt Show Backgrounds PDF
Following slide provides dashboard that can be used by the businesses to measure the performance of digital transformation initiatives with the help of different KPIs. KPIs covered are social presence, click through rate, sales revenue, churn amount etc. The KPI Dashboard To Track Digital Transformation Initiatives Ppt Show Backgrounds PDF is a compilation of the most recent design trends as a series of slides. It is suitable for any subject or industry presentation, containing attractive visuals and photo spots for businesses to clearly express their messages. This template contains a variety of slides for the user to input data, such as structures to contrast two elements, bullet points, and slides for written information. Slidegeeks is prepared to create an impression.

Domestic Budget Plan Income And Expenditure Analysis Dashboard Ppt PowerPoint Presentation Layouts Clipart Images PDF
The slide presents a dashboard to analyze and monitor income and expenses for formulating savings plan. It includes income, expenses, savings, top five expenses and unplanned expenses.Pitch your topic with ease and precision using this Domestic Budget Plan Income And Expenditure Analysis Dashboard Ppt PowerPoint Presentation Layouts Clipart Images PDF. This layout presents information on Unplanned Expenses, Expenses, Key Metrics. It is also available for immediate download and adjustment. So, changes can be made in the color, design, graphics or any other component to create a unique layout.
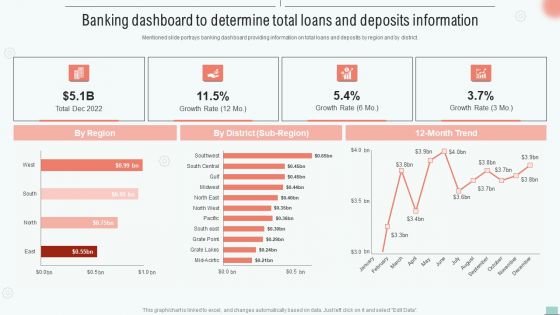
Banking Dashboard To Determine Total Loans And Deposits Information Elements PDF
Mentioned slide portrays banking dashboard providing information on total loans and deposits by region and by district.Boost your pitch with our creative Banking Dashboard To Determine Total Loans And Deposits Information Elements PDF. Deliver an awe-inspiring pitch that will mesmerize everyone. Using these presentation templates you will surely catch everyones attention. You can browse the ppts collection on our website. We have researchers who are experts at creating the right content for the templates. So you do not have to invest time in any additional work. Just grab the template now and use them.
Banking Dashboard To Determine Total Loans And Deposits Information Icons PDF
Mentioned slide portrays banking dashboard providing information on total loans and deposits by region and by district. Boost your pitch with our creative Banking Dashboard To Determine Total Loans And Deposits Information Icons PDF. Deliver an awe inspiring pitch that will mesmerize everyone. Using these presentation templates you will surely catch everyones attention. You can browse the ppts collection on our website. We have researchers who are experts at creating the right content for the templates. So you do not have to invest time in any additional work. Just grab the template now and use them.
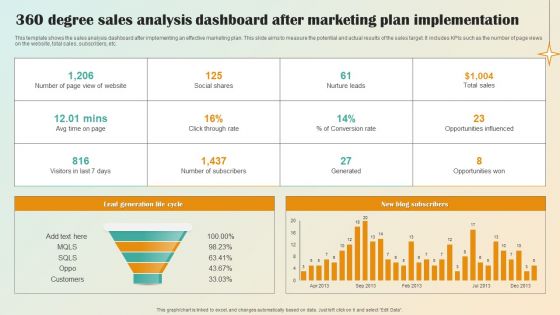
360 Degree Sales Analysis Dashboard After Marketing Plan Implementation Pictures PDF
This template shows the sales analysis dashboard after implementing an effective marketing plan. This slide aims to measure the potential and actual results of the sales target. It includes KPIs such as the number of page views on the website, total sales, subscribers, etc.Pitch your topic with ease and precision using this 360 Degree Sales Analysis Dashboard After Marketing Plan Implementation Pictures PDF. This layout presents information on Lead Generation Life, Conversion Rate. It is also available for immediate download and adjustment. So, changes can be made in the color, design, graphics or any other component to create a unique layout.
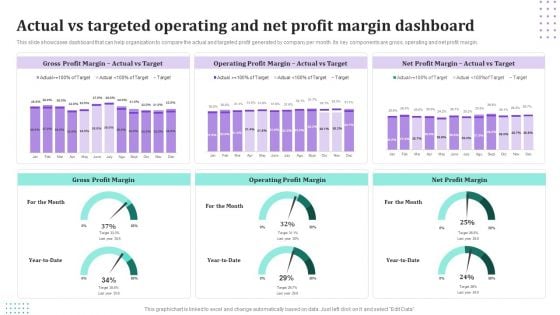
Actual Vs Targeted Operating And Net Profit Margin Dashboard Information PDF
This slide showcases dashboard that can help organization to compare the actual and targeted profit generated by company per month. Its key components are gross, operating and net profit margin. Showcasing this set of slides titled Actual Vs Targeted Operating And Net Profit Margin Dashboard Information PDF. The topics addressed in these templates are Gross Profit Margin, Operating Profit Margin, Net Profit Margin. All the content presented in this PPT design is completely editable. Download it and make adjustments in color, background, font etc. as per your unique business setting.
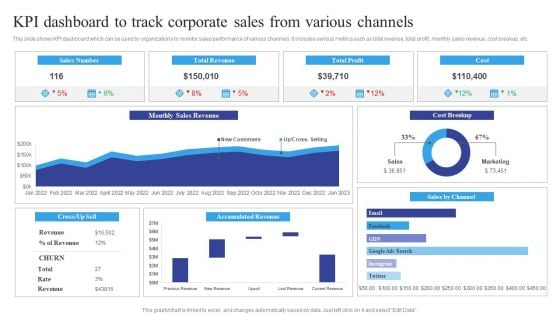
KPI Dashboard To Track Corporate Sales From Various Channels Information PDF
This slide shows KPI dashboard which can be used by organizations to monitor sales performance of various channels. It includes various metrics such as total revenue, total profit, monthly sales revenue, cost breakup, etc. Showcasing this set of slides titled KPI Dashboard To Track Corporate Sales From Various Channels Information PDF. The topics addressed in these templates are Track Corporate Sales, Various Channels. All the content presented in this PPT design is completely editable. Download it and make adjustments in color, background, font etc. as per your unique business setting.
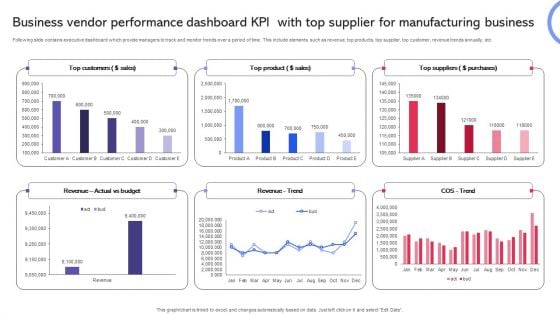
Business Vendor Performance Dashboard KPI With Top Supplier For Manufacturing Business Information PDF
Following slide contains executive dashboard which provide managers to track and monitor trends over a period of time. This include elements such as revenue, top products, top supplier, top customer, revenue trends annually, etc. Showcasing this set of slides titled Business Vendor Performance Dashboard KPI With Top Supplier For Manufacturing Business Information PDF. The topics addressed in these templates are Customers, Product, Sales. All the content presented in this PPT design is completely editable. Download it and make adjustments in color, background, font etc. as per your unique business setting.
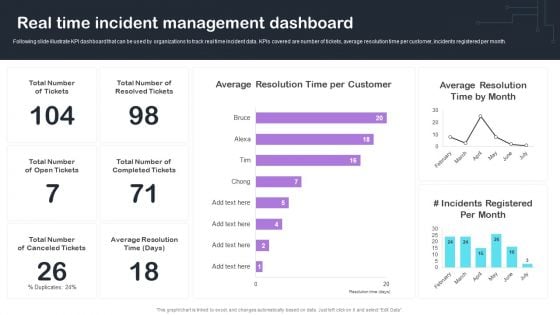
Cyber Risks And Incident Response Playbook Real Time Incident Management Dashboard Guidelines PDF
Following slide illustrate KPI dashboard that can be used by organizations to track real time incident data. KPIs covered are number of tickets, average resolution time per customer, incidents registered per month. This Cyber Risks And Incident Response Playbook Real Time Incident Management Dashboard Guidelines PDF from Slidegeeks makes it easy to present information on your topic with precision. It provides customization options, so you can make changes to the colors, design, graphics, or any other component to create a unique layout. It is also available for immediate download, so you can begin using it right away. Slidegeeks has done good research to ensure that you have everything you need to make your presentation stand out. Make a name out there for a brilliant performance.
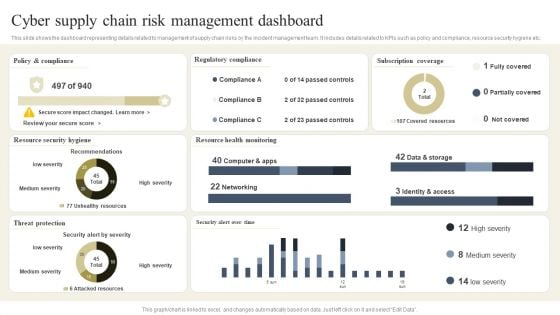
CYBER Security Breache Response Strategy Cyber Supply Chain Risk Management Dashboard Inspiration PDF
This slide shows the dashboard representing details related to management of supply chain risks by the incident management team. It includes details related to KPIs such as policy and compliance, resource security hygiene etc. The CYBER Security Breache Response Strategy Cyber Supply Chain Risk Management Dashboard Inspiration PDF is a compilation of the most recent design trends as a series of slides. It is suitable for any subject or industry presentation, containing attractive visuals and photo spots for businesses to clearly express their messages. This template contains a variety of slides for the user to input data, such as structures to contrast two elements, bullet points, and slides for written information. Slidegeeks is prepared to create an impression.
Recommender Systems Performance Tracking Dashboard Integrating Recommender System To Enhance Guidelines PDF
This slide shows the dashboard to keep a track of the performance of recommender systems. The purpose of this slide is to provide a graphical representation of recommendation engines performance to enhance the accuracy and effectiveness of the system.Find highly impressive Recommender Systems Performance Tracking Dashboard Integrating Recommender System To Enhance Guidelines PDF on Slidegeeks to deliver a meaningful presentation. You can save an ample amount of time using these presentation templates. No need to worry to prepare everything from scratch because Slidegeeks experts have already done a huge research and work for you. You need to download Recommender Systems Performance Tracking Dashboard Integrating Recommender System To Enhance Guidelines PDF for your upcoming presentation. All the presentation templates are 100 precent editable and you can change the color and personalize the content accordingly. Download now.
Enhanced Lead Performance Tracking Dashboard Enhancing Client Lead Conversion Rates Ideas PDF
This slide covers the KPI dashboard for tracking improved lead management system performance. It includes metrics such as visitors, social media followers, email subscribers, organic leads, etc. Explore a selection of the finest Enhanced Lead Performance Tracking Dashboard Enhancing Client Lead Conversion Rates Ideas PDF here. With a plethora of professionally designed and pre made slide templates, you can quickly and easily find the right one for your upcoming presentation. You can use our Enhanced Lead Performance Tracking Dashboard Enhancing Client Lead Conversion Rates Ideas PDF to effectively convey your message to a wider audience. Slidegeeks has done a lot of research before preparing these presentation templates. The content can be personalized and the slides are highly editable. Grab templates today from Slidegeeks.
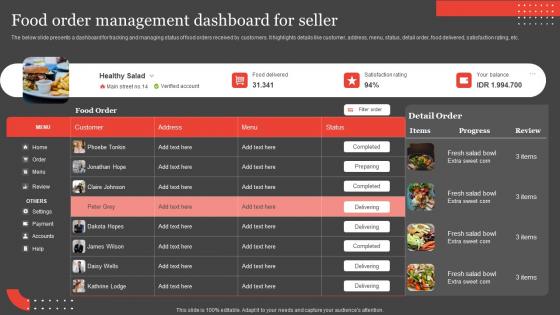
International Food Delivery Market Food Order Management Dashboard For Seller Graphics Pdf
The below slide presents a dashboard for tracking and managing status of food orders received by customers. It highlights details like customer, address, menu, status, detail order, food delivered, satisfaction rating, etc. Coming up with a presentation necessitates that the majority of the effort goes into the content and the message you intend to convey. The visuals of a PowerPoint presentation can only be effective if it supplements and supports the story that is being told. Keeping this in mind our experts created International Food Delivery Market Food Order Management Dashboard For Seller Graphics Pdf to reduce the time that goes into designing the presentation. This way, you can concentrate on the message while our designers take care of providing you with the right template for the situation. The below slide presents a dashboard for tracking and managing status of food orders received by customers. It highlights details like customer, address, menu, status, detail order, food delivered, satisfaction rating, etc.


 Continue with Email

 Home
Home


