Data Dashboard
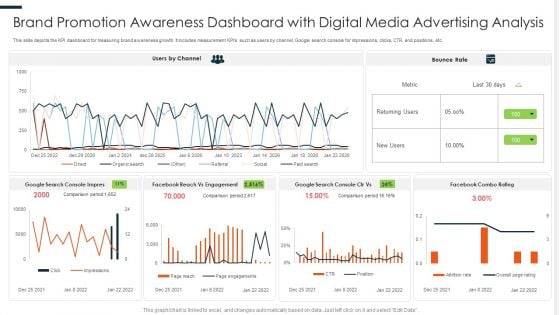
Brand Promotion Awareness Dashboard With Digital Media Advertising Analysis Ppt PowerPoint Presentation Design Ideas PDF
This slide depicts the KPI dashboard for measuring brand awareness growth. It includes measurement KPIs such as users by channel, Google search console for impressions, clicks, CTR, and positions, etc. Pitch your topic with ease and precision using this Brand Promotion Awareness Dashboard With Digital Media Advertising Analysis Ppt PowerPoint Presentation Design Ideas PDF. This layout presents information on Console Impress, Reach Engagement, Combo Rating. It is also available for immediate download and adjustment. So, changes can be made in the color, design, graphics or any other component to create a unique layout.
Performance Tracking Dashboard For 5G Technology Difference Between 4G And 5G Network Introduction PDF
This slide describes the performance tracking dashboard for 5G technology by covering the details of subscribers, qoe, consumption, customer support, coverage, devices, and dimensions.Find a pre-designed and impeccable Performance Tracking Dashboard For 5G Technology Difference Between 4G And 5G Network Introduction PDF. The templates can ace your presentation without additional effort. You can download these easy-to-edit presentation templates to make your presentation stand out from others. So, what are you waiting for Download the template from Slidegeeks today and give a unique touch to your presentation.
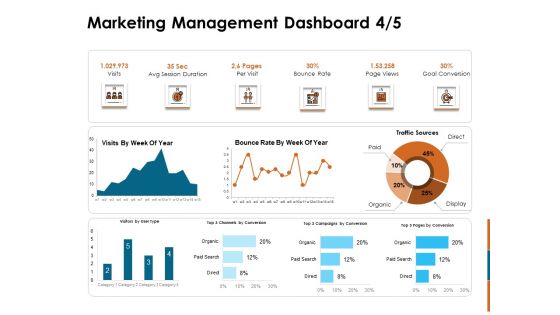
Key Statistics Of Marketing Marketing Management Dashboard Rate Ppt PowerPoint Presentation Show Graphics Template PDF
Deliver and pitch your topic in the best possible manner with this key statistics of marketing marketing management dashboard rate ppt powerpoint presentation show graphics template pdf. Use them to share invaluable insights on visits, avg session duration, per visit, bounce rate, page views, goal conversion and impress your audience. This template can be altered and modified as per your expectations. So, grab it now.
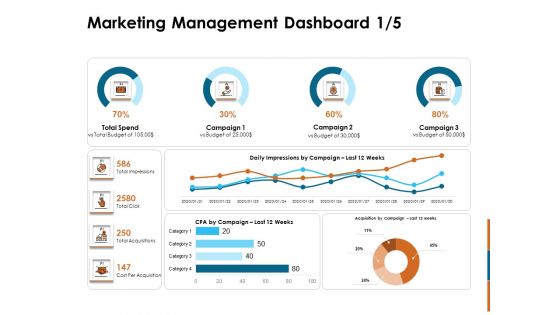
Key Statistics Of Marketing Marketing Management Dashboard Ppt PowerPoint Presentation Slides Templates PDF
Deliver and pitch your topic in the best possible manner with this key statistics of marketing marketing management dashboard ppt powerpoint presentation slides templates pdf. Use them to share invaluable insights on total impressions, total click, total acquisitions, cost per acquisition, total spend, acquisition campaign last 12 weeks and impress your audience. This template can be altered and modified as per your expectations. So, grab it now.
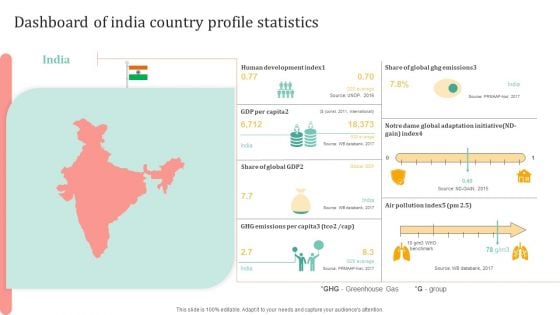
Dashboard Of India Country Profile Statistics Ppt Ideas Format Ideas PDF
Persuade your audience using this Dashboard Of India Country Profile Statistics Ppt Ideas Format Ideas PDF. This PPT design covers one stages, thus making it a great tool to use. It also caters to a variety of topics including Human Development Index, Global Ghg Emissions, GDP Per Capita. Download this PPT design now to present a convincing pitch that not only emphasizes the topic but also showcases your presentation skills.
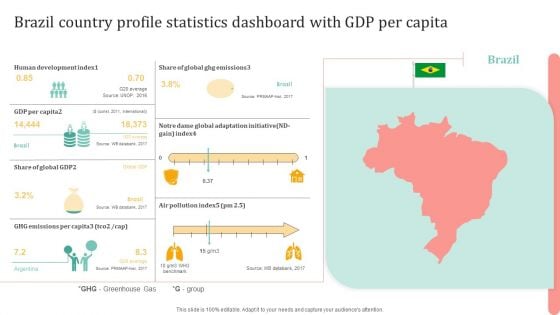
Brazil Country Profile Statistics Dashboard With GDP Per Capita Mockup PDF
Persuade your audience using this Brazil Country Profile Statistics Dashboard With GDP Per Capita Mockup PDF. This PPT design covers one stages, thus making it a great tool to use. It also caters to a variety of topics including Global Ghg Emissions, Human Development Index, GDP Per Capita. Download this PPT design now to present a convincing pitch that not only emphasizes the topic but also showcases your presentation skills.
Technology Upgradation Action Plan Dashboard For Issues Tracking Ppt Portfolio Graphics Pictures PDF
This slide shows the issues tracking the dashboard for the business transition project. It provides details of multiple issues faced by users to keep records for effective management of the project. Deliver an awe inspiring pitch with this creative Technology Upgradation Action Plan Dashboard For Issues Tracking Ppt Portfolio Graphics Pictures PDF bundle. Topics like Issues Failed Verification, Immediate Issues, High Churn Issues, Suspect Requirements, Failed Test Runs can be discussed with this completely editable template. It is available for immediate download depending on the needs and requirements of the user.
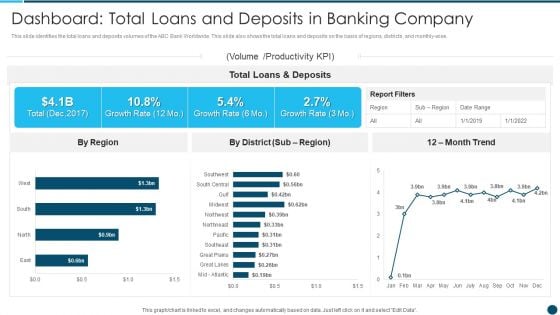
Digital Technology Adoption In Banking Industry Case Competition Dashboard Total Download PDF
This slide identifies the total loans and deposits volumes of the ABC Bank Worldwide. This slide also shows the total loans and deposits on the basis of regions, districts, and monthly wise.Deliver and pitch your topic in the best possible manner with this Digital Technology Adoption In Banking Industry Case Competition Dashboard Total Download PDF Use them to share invaluable insights on Dashboard Total, Loans And Deposits, Banking Company and impress your audience. This template can be altered and modified as per your expectations. So, grab it now.
Metaverse Technology IT Dashboard For Tracking Metaverse Environment Ppt Outline Elements PDF
This slide represents the dashboard for tracking the metaverse environment. It covers the details of daily revenue, the total number of users, the number of new users, and total sales. Deliver and pitch your topic in the best possible manner with this Metaverse Technology IT Dashboard For Tracking Metaverse Environment Ppt Outline Elements PDF. Use them to share invaluable insights on Digital Spot, Satisfaction Rate, All Metaverses, Transaction Details and impress your audience. This template can be altered and modified as per your expectations. So, grab it now.
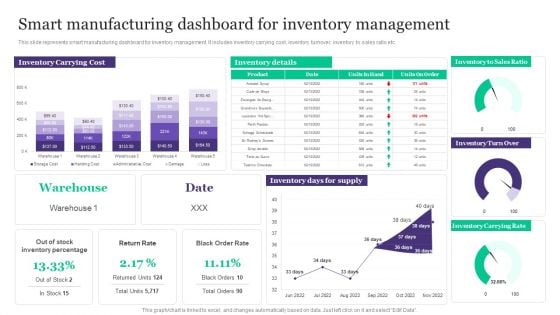
Deployment Of Automated Production Technology Smart Manufacturing Dashboard For Inventory Management Brochure PDF
This slide represents smart manufacturing dashboard for inventory management. It includes inventory carrying cost, inventory turnover, inventory to sales ratio etc.Welcome to our selection of the Deployment Of Automated Production Technology Smart Manufacturing Dashboard For Inventory Management Brochure PDF. These are designed to help you showcase your creativity and bring your sphere to life. Planning and Innovation are essential for any business that is just starting out. This collection contains the designs that you need for your everyday presentations. All of our PowerPoints are 100 precent editable, so you can customize them to suit your needs. This multi-purpose template can be used in various situations. Grab these presentation templates today.
Corporate Branding Performance Tracking Dashboard Corporate Branding Strategy To Revitalize Business Identity Slides PDF
This slide provides information regarding corporate branding performance tracking dashboard in terms of leads, conversion metrics, web traffic, etc. If you are looking for a format to display your unique thoughts, then the professionally designed Corporate Branding Performance Tracking Dashboard Corporate Branding Strategy To Revitalize Business Identity Slides PDF is the one for you. You can use it as a Google Slides template or a PowerPoint template. Incorporate impressive visuals, symbols, images, and other charts. Modify or reorganize the text boxes as you desire. Experiment with shade schemes and font pairings. Alter, share or cooperate with other people on your work. Download Corporate Branding Performance Tracking Dashboard Corporate Branding Strategy To Revitalize Business Identity Slides PDF and find out how to give a successful presentation. Present a perfect display to your team and make your presentation unforgettable.
Dashboard For Tracking Customer Service Team Performance Consumer Contact Point Guide Diagrams PDF
This slide covers the KPI dashboard for analyzing the performance of client support department. It includes metrics such as first call resolution, unresolved calls, average response rate, the best day to call, average time to solve issues, etc. The Dashboard For Tracking Customer Service Team Performance Consumer Contact Point Guide Diagrams PDF is a compilation of the most recent design trends as a series of slides. It is suitable for any subject or industry presentation, containing attractive visuals and photo spots for businesses to clearly express their messages. This template contains a variety of slides for the user to input data, such as structures to contrast two elements, bullet points, and slides for written information. Slidegeeks is prepared to create an impression.
Dashboard For Tracking Brand Communication Campaign Results Executing Brand Communication Strategy Clipart PDF
This slide covers the dashboard for monitoring various audience segments. It includes metrics such as ad mentions, engagement, top occupation of the audience, top interest of the audience, age, language, etc. The Dashboard For Tracking Brand Communication Campaign Results Executing Brand Communication Strategy Clipart PDF is a compilation of the most recent design trends as a series of slides. It is suitable for any subject or industry presentation, containing attractive visuals and photo spots for businesses to clearly express their messages. This template contains a variety of slides for the user to input data, such as structures to contrast two elements, bullet points, and slides for written information. Slidegeeks is prepared to create an impression.
Dashboard For Tracking Business And IT Alignment Ppt PowerPoint Presentation File Background Images PDF
This slide depicts the dashboard for business and IT alignment by covering details of total sales, customer support service, percentage of business operations aligned IT, usage of communication channels, and top performer associates. The Dashboard For Tracking Business And IT Alignment Ppt PowerPoint Presentation File Background Images PDF is a compilation of the most recent design trends as a series of slides. It is suitable for any subject or industry presentation, containing attractive visuals and photo spots for businesses to clearly express their messages. This template contains a variety of slides for the user to input data, such as structures to contrast two elements, bullet points, and slides for written information. Slidegeeks is prepared to create an impression.
Inbound Lead Performance Tracking Dashboard Enhancing Client Lead Conversion Rates Structure PDF
This slide covers the KPI dashboard for evaluating inbound lead performance. It includes metrics such as lead to opportunity ratio, opportunity to win ratio, lead conversion ratio, inbound leads, and leads in the sales funnel. The Inbound Lead Performance Tracking Dashboard Enhancing Client Lead Conversion Rates Structure PDF is a compilation of the most recent design trends as a series of slides. It is suitable for any subject or industry presentation, containing attractive visuals and photo spots for businesses to clearly express their messages. This template contains a variety of slides for the user to input data, such as structures to contrast two elements, bullet points, and slides for written information. Slidegeeks is prepared to create an impression.
Inbound Lead Performance Tracking Dashboard Improving Lead Generation Process Pictures PDF
This slide covers the KPI dashboard for evaluating inbound lead performance. It includes metrics such as lead to opportunity ratio, opportunity to win ratio, lead conversion ratio, inbound leads, and leads in the sales funnel. The Inbound Lead Performance Tracking Dashboard Improving Lead Generation Process Pictures PDF is a compilation of the most recent design trends as a series of slides. It is suitable for any subject or industry presentation, containing attractive visuals and photo spots for businesses to clearly express their messages. This template contains a variety of slides for the user to input data, such as structures to contrast two elements, bullet points, and slides for written information. Slidegeeks is prepared to create an impression.
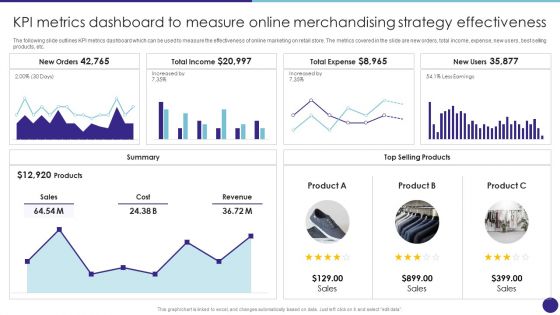
Kpi Metrics Dashboard To Measure Online Merchandising Strategy Effectiveness Retail Merchandising Techniques Sample PDF
The following slide outlines KPI metrics dashboard which can be used to measure the effectiveness of online marketing on retail store. The metrics covered in the slide are new orders, total income, expense, new users, best selling products, etc.Are you searching for a Kpi Metrics Dashboard To Measure Online Merchandising Strategy Effectiveness Retail Merchandising Techniques Sample PDF that is uncluttered, straightforward, and original Its easy to edit, and you can change the colors to suit your personal or business branding. For a presentation that expresses how much effort you ve put in, this template is ideal With all of its features, including tables, diagrams, statistics, and lists, its perfect for a business plan presentation. Make your ideas more appealing with these professional slides. Download Kpi Metrics Dashboard To Measure Online Merchandising Strategy Effectiveness Retail Merchandising Techniques Sample PDF from Slidegeeks today.
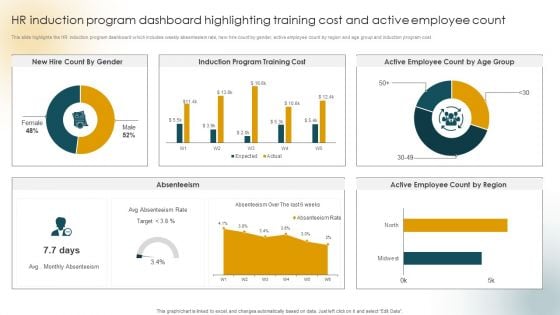
HR Induction Program Dashboard Highlighting Training Cost And Active Employee Count Themes PDF
This slide highlights the HR induction program dashboard which includes weekly absenteeism rate, new hire count by gender, active employee count by region and age group and induction program cost. Are you searching for a HR Induction Program Dashboard Highlighting Training Cost And Active Employee Count Themes PDF that is uncluttered, straightforward, and original Its easy to edit, and you can change the colors to suit your personal or business branding. For a presentation that expresses how much effort you have put in, this template is ideal With all of its features, including tables, diagrams, statistics, and lists, its perfect for a business plan presentation. Make your ideas more appealing with these professional slides. Download HR Induction Program Dashboard Highlighting Training Cost And Active Employee Count Themes PDF from Slidegeeks today.
Increasing Customer Dashboard For Tracking Aftersales Customer Services Team Ideas PDF
This slide covers the KPI dashboard for ticket tracking. It includes metrics such as tickets by month, service level, and details of customer service department agents. Are you searching for a Increasing Customer Dashboard For Tracking Aftersales Customer Services Team Ideas PDF that is uncluttered, straightforward, and original Its easy to edit, and you can change the colors to suit your personal or business branding. For a presentation that expresses how much effort youve put in, this template is ideal With all of its features, including tables, diagrams, statistics, and lists, its perfect for a business plan presentation. Make your ideas more appealing with these professional slides. Download Increasing Customer Dashboard For Tracking Aftersales Customer Services Team Ideas PDF from Slidegeeks today.
5G Network Operations Performance Tracking Dashboard For 5G Architecture Demonstration PDF
This slide describes the performance tracking dashboard for 5G architecture by covering the details of subscribers, quality of experience, consumption, customer support, coverage, devices, and dimensions. Are you searching for a 5G Network Operations Performance Tracking Dashboard For 5G Architecture Demonstration PDF that is uncluttered, straightforward, and original. Its easy to edit, and you can change the colors to suit your personal or business branding. For a presentation that expresses how much effort youve put in, this template is ideal With all of its features, including tables, diagrams, statistics, and lists, its perfect for a business plan presentation. Make your ideas more appealing with these professional slides. Download 5G Network Operations Performance Tracking Dashboard For 5G Architecture Demonstration PDF from Slidegeeks today.
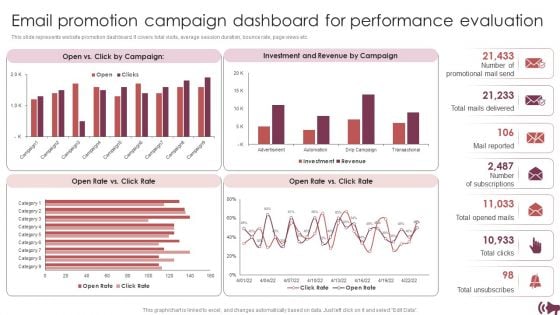
Guide Digital Advertising Optimize Lead Targeting Email Promotion Campaign Dashboard For Performance Sample PDF
This slide represents website promotion dashboard. It covers total visits, average session duration, bounce rate, page views etc. Are you searching for a Guide Digital Advertising Optimize Lead Targeting Email Promotion Campaign Dashboard For Performance Sample PDF that is uncluttered, straightforward, and original Its easy to edit, and you can change the colors to suit your personal or business branding. For a presentation that expresses how much effort you have put in, this template is ideal. With all of its features, including tables, diagrams, statistics, and lists, its perfect for a business plan presentation. Make your ideas more appealing with these professional slides. Download Guide Digital Advertising Optimize Lead Targeting Email Promotion Campaign Dashboard For Performance Sample PDF from Slidegeeks today.
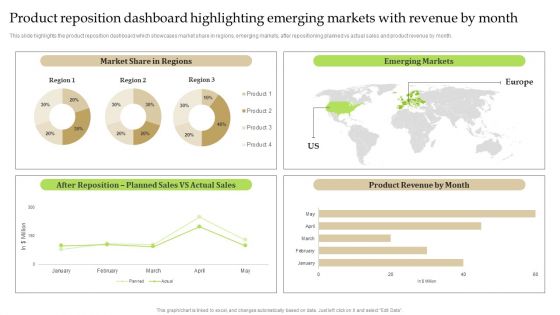
Product Reposition Dashboard Highlighting Emerging Markets With Revenue By Month Brochure PDF
This slide highlights the product reposition dashboard which showcases market share in regions, emerging markets, after repositioning planned vs actual sales and product revenue by month. Are you searching for a Product Reposition Dashboard Highlighting Emerging Markets With Revenue By Month Brochure PDF that is uncluttered, straightforward, and original Its easy to edit, and you can change the colors to suit your personal or business branding. For a presentation that expresses how much effort you have put in, this template is ideal. With all of its features, including tables, diagrams, statistics, and lists, its perfect for a business plan presentation. Make your ideas more appealing with these professional slides. Download Product Reposition Dashboard Highlighting Emerging Markets With Revenue By Month Brochure PDF from Slidegeeks today.
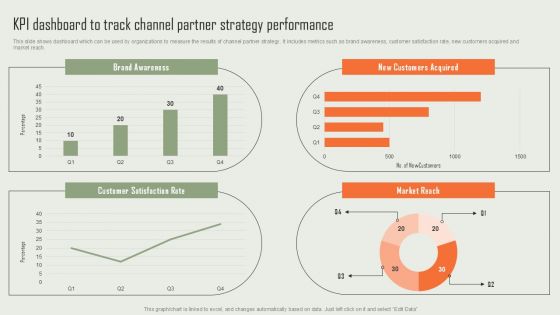
Product Marketing And Sales Expansion Through Channel KPI Dashboard To Track Channel Partner Strategy Diagrams PDF
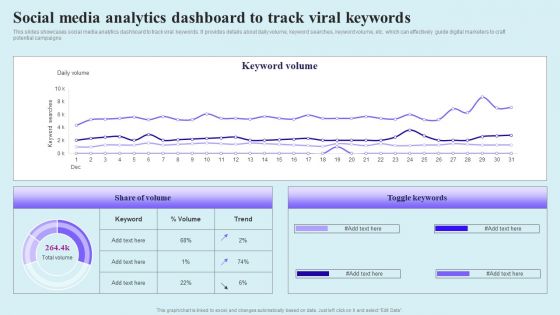
Go Viral Campaign Strategies To Increase Engagement Social Media Analytics Dashboard Track Viral Graphics PDF
This slides showcases social media analytics dashboard to track viral keywords. It provides details about daily volume, keyword searches, keyword volume, etc. which can effectively guide digital marketers to craft potential campaigns Are you searching for a Go Viral Campaign Strategies To Increase Engagement Social Media Analytics Dashboard Track Viral Graphics PDF that is uncluttered, straightforward, and original Its easy to edit, and you can change the colors to suit your personal or business branding. For a presentation that expresses how much effort you have put in, this template is ideal. With all of its features, including tables, diagrams, statistics, and lists, its perfect for a business plan presentation. Make your ideas more appealing with these professional slides. Download Go Viral Campaign Strategies To Increase Engagement Social Media Analytics Dashboard Track Viral Graphics PDF from Slidegeeks today.
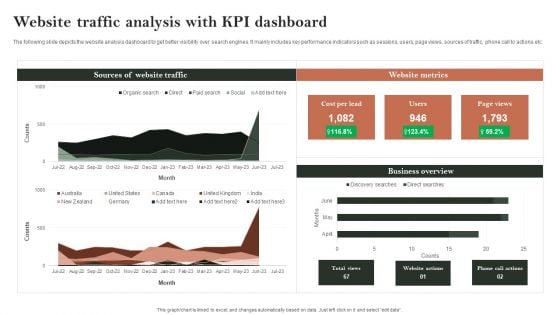
Search Engine Marketing Website Traffic Analysis With KPI Dashboard Brochure PDF
The following slide depicts the website analysis dashboard to get better visibility over search engines. It mainly includes key performance indicators such as sessions, users, page views, sources of traffic, phone call to actions etc. Want to ace your presentation in front of a live audience Our Search Engine Marketing Website Traffic Analysis With KPI Dashboard Brochure PDF can help you do that by engaging all the users towards you.. Slidegeeks experts have put their efforts and expertise into creating these impeccable powerpoint presentations so that you can communicate your ideas clearly. Moreover, all the templates are customizable, and easy-to-edit and downloadable. Use these for both personal and commercial use.
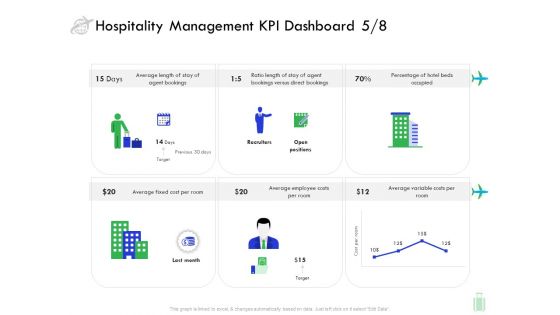
Travel And Leisure Industry Analysis Hospitality Management KPI Dashboard Fixed Information PDF
Presenting this set of slides with name travel and leisure industry analysis hospitality management kpi dashboard fixed information pdf. The topics discussed in these slides are agent, recruiters, cost, average, employee. This is a completely editable PowerPoint presentation and is available for immediate download. Download now and impress your audience.
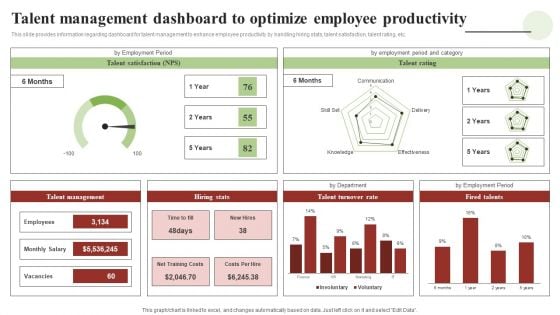
Transforming Human Resource Service Delivery Procedure Talent Management Dashboard To Optimize Themes PDF
This slide provides information regarding dashboard for talent management to enhance employee productivity by handling hiring stats, talent satisfaction, talent rating, etc. Whether you have daily or monthly meetings, a brilliant presentation is necessary. Transforming Human Resource Service Delivery Procedure Talent Management Dashboard To Optimize Themes PDF can be your best option for delivering a presentation. Represent everything in detail using Transforming Human Resource Service Delivery Procedure Talent Management Dashboard To Optimize Themes PDF and make yourself stand out in meetings. The template is versatile and follows a structure that will cater to your requirements. All the templates prepared by Slidegeeks are easy to download and edit. Our research experts have taken care of the corporate themes as well. So, give it a try and see the results.
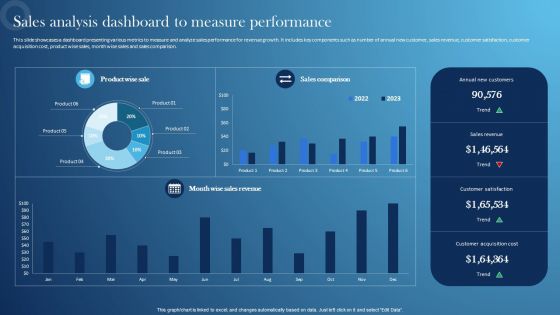
Inspecting Sales Optimization Areas Sales Analysis Dashboard To Measure Performance Demonstration PDF
This slide showcases a dashboard presenting various metrics to measure and analyze sales performance for revenue growth. It includes key components such as number of annual new customer, sales revenue, customer satisfaction, customer acquisition cost, product wise sales, month wise sales and sales comparison. From laying roadmaps to briefing everything in detail, our templates are perfect for you. You can set the stage with your presentation slides. All you have to do is download these easy-to-edit and customizable templates. Inspecting Sales Optimization Areas Sales Analysis Dashboard To Measure Performance Demonstration PDF will help you deliver an outstanding performance that everyone would remember and praise you for. Do download this presentation today.
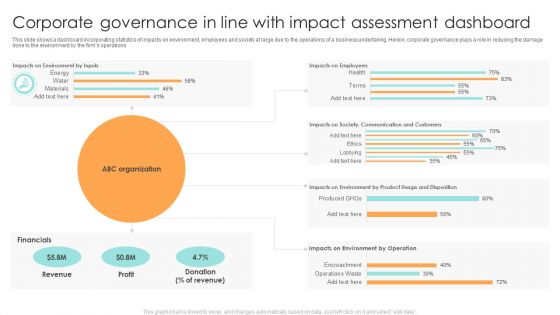
Corporate Governance In Line With Impact Assessment Dashboard Ppt File Backgrounds PDF
This slide shows a dashboard incorporating statistics of impacts on environment, employees and society at large due to the operations of a business undertaking. Herein, corporate governance plays a role in reducing the damage done to the environment by the firms operations. Pitch your topic with ease and precision using this Corporate Governance In Line With Impact Assessment Dashboard Ppt File Backgrounds PDF. This layout presents information on Financials, Profit, ABC Organization. It is also available for immediate download and adjustment. So, changes can be made in the color, design, graphics or any other component to create a unique layout.
Consumer Journey Mapping Techniques Dashboard For Tracking Digital Content Performance Clipart PDF
This slide covers the KPI dashboard for analyzing online content. It includes metrics such as blog visitors, pageviews, newsletter conversion rate, new signups, new customers, etc. Showcasing this set of slides titled Consumer Journey Mapping Techniques Dashboard For Tracking Digital Content Performance Clipart PDF. The topics addressed in these templates are Purchase Amount, Customers, Tracking Digital Content Performance. All the content presented in this PPT design is completely editable. Download it and make adjustments in color, background, font etc. as per your unique business setting.
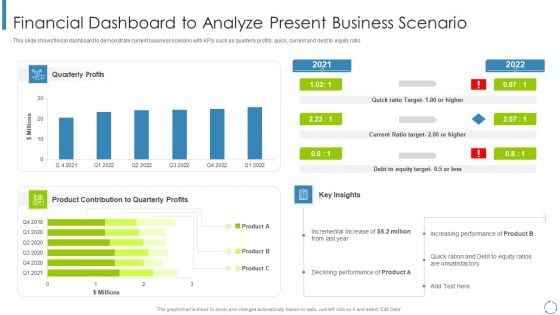
Internal And External Business Environment Analysis Financial Dashboard To Analyze Present Business Scenario Topics PDF
This slide shows finical dashboard to demonstrate current business scenario with KPIs such as quarterly profits, quick, current and debt to equity ratio Deliver and pitch your topic in the best possible manner with this internal and external business environment analysis financial dashboard to analyze present business scenario topics pdf Use them to share invaluable insights on product contribution to quarterly, incremental increase, declining performance and impress your audience. This template can be altered and modified as per your expectations. So, grab it now.
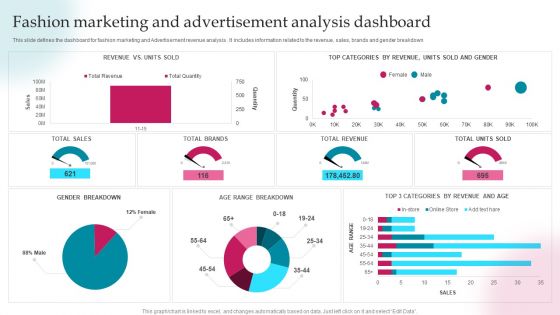
Fashion Marketing And Advertisement Analysis Dashboard Ppt PowerPoint Presentation Gallery Topics PDF
This slide defines the dashboard for fashion marketing and Advertisement revenue analysis . It includes information related to the revenue, sales, brands and gender breakdown. Pitch your topic with ease and precision using this Fashion Marketing And Advertisement Analysis Dashboard Ppt PowerPoint Presentation Gallery Topics PDF. This layout presents information on Total Revenue, Total Brands, Total Sales. It is also available for immediate download and adjustment. So, changes can be made in the color, design, graphics or any other component to create a unique layout.
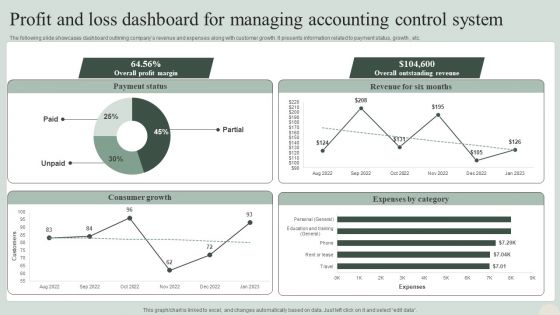
Profit And Loss Dashboard For Managing Accounting Control System Information PDF
The following slide showcases dashboard outlining companys revenue and expenses along with customer growth. It presents information related to payment status, growth , etc. Pitch your topic with ease and precision using this Profit And Loss Dashboard For Managing Accounting Control System Information PDF. This layout presents information on Consumer Growth, Expenses By Category, Overall Outstanding Revenue. It is also available for immediate download and adjustment. So, changes can be made in the color, design, graphics or any other component to create a unique layout.
Umbrella Branding Measures To Boost Brand Awareness Product Branding Performance Tracking Dashboard Information PDF
This slide provides information regarding product branding performance tracking dashboard in terms of revenues, new customers, customer satisfaction rate. This Umbrella Branding Measures To Boost Brand Awareness Product Branding Performance Tracking Dashboard Information PDF from Slidegeeks makes it easy to present information on your topic with precision. It provides customization options, so you can make changes to the colors, design, graphics, or any other component to create a unique layout. It is also available for immediate download, so you can begin using it right away. Slidegeeks has done good research to ensure that you have everything you need to make your presentation stand out. Make a name out there for a brilliant performance.
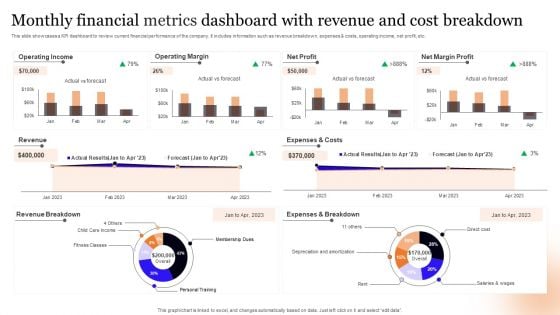
Monthly Financial Metrics Dashboard With Revenue And Cost Breakdown Information PDF
This slide showcases a KPI dashboard to review current financial performance of the company. It includes information such as revenue breakdown, expenses and costs, operating income, net profit, etc. Pitch your topic with ease and precision using this Monthly Financial Metrics Dashboard With Revenue And Cost Breakdown Information PDF. This layout presents information on Operating Income, Operating Margin, Net Profit. It is also available for immediate download and adjustment. So, changes can be made in the color, design, graphics or any other component to create a unique layout.
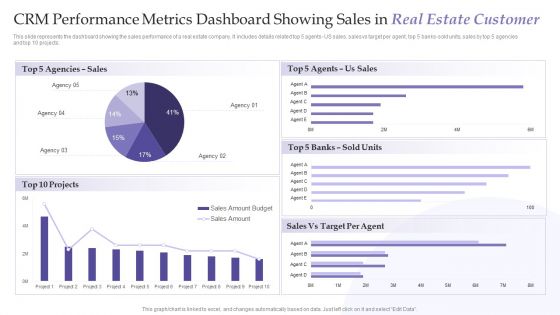
CRM Performance Metrics Dashboard Showing Sales In Real Estate Customer Information PDF
This slide represents the dashboard showing the sales performance of a real estate company. It includes details related top 5 agents US sales, sales vs target per agent, top 5 banks-sold units, sales by top 5 agencies. Pitch your topic with ease and precision using this CRM Performance Metrics Dashboard Showing Sales In Real Estate Customer Information PDF. This layout presents information on Us Sales, Sold Units, Target Per Agent. It is also available for immediate download and adjustment. So, changes can be made in the color, design, graphics or any other component to create a unique layout.
Customer Tracking Dashboard To Monitor Brand Loyalty Brand Administration Information PDF
This slide provides information brand loyalty tracking dashboard in order to monitor customer engagement, average revenues, new vs. returning visitors performance, etc. The best PPT templates are a great way to save time, energy, and resources. Slidegeeks have 100precent editable powerpoint slides making them incredibly versatile. With these quality presentation templates, you can create a captivating and memorable presentation by combining visually appealing slides and effectively communicating your message. Download Customer Tracking Dashboard To Monitor Brand Loyalty Brand Administration Information PDF from Slidegeeks and deliver a wonderful presentation.
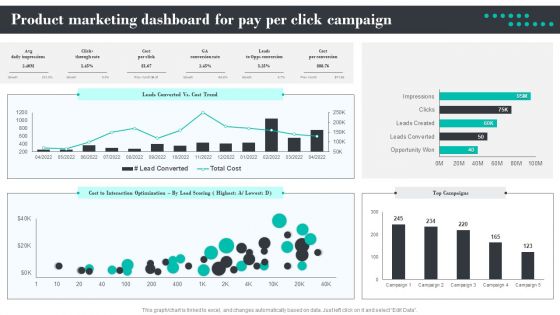
Efficient Product Marketing Techniques Product Marketing Dashboard For Pay Per Click Campaign Information PDF
Crafting an eye catching presentation has never been more straightforward. Let your presentation shine with this tasteful yet straightforward Efficient Product Marketing Techniques Product Marketing Dashboard For Pay Per Click Campaign Information PDF template. It offers a minimalistic and classy look that is great for making a statement. The colors have been employed intelligently to add a bit of playfulness while still remaining professional. Construct the ideal Efficient Product Marketing Techniques Product Marketing Dashboard For Pay Per Click Campaign Information PDF that effortlessly grabs the attention of your audience Begin now and be certain to wow your customers.
Key Elements Of Strategic Brand Administration Customer Tracking Dashboard To Monitor Brand Loyalty Information PDF
This slide provides information brand loyalty tracking dashboard in order to monitor customer engagement, average revenues, new vs. returning visitors performance, etc. Make sure to capture your audiences attention in your business displays with our gratis customizable Key Elements Of Strategic Brand Administration Customer Tracking Dashboard To Monitor Brand Loyalty Information PDF. These are great for business strategies, office conferences, capital raising or task suggestions. If you desire to acquire more customers for your tech business and ensure they stay satisfied, create your own sales presentation with these plain slides.

Cyber Protection Incident And Privacy Analysis With KPI Dashboard Ideas PDF
The following slide highlights some kpas of cyber security incidents to evaluate and monitor threats. It includes elements such as open incidents, warnings by severity, average response time, warnings pending for inspection etc. Showcasing this set of slides titled Cyber Protection Incident And Privacy Analysis With KPI Dashboard Ideas PDF. The topics addressed in these templates are Cyber Protection Incident, Privacy Analysis, KPI Dashboard. All the content presented in this PPT design is completely editable. Download it and make adjustments in color, background, font etc. as per your unique business setting.
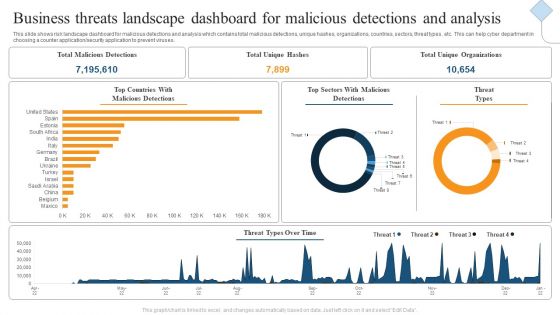
Business Threats Landscape Dashboard For Malicious Detections And Analysis Ppt Gallery Show PDF
This slide shows risk landscape dashboard for malicious detections and analysis which contains total malicious detections, unique hashes, organizations, countries, sectors, threat types, etc. This can help cyber department in choosing a counter application or security application to prevent viruses. Showcasing this set of slides titled Business Threats Landscape Dashboard For Malicious Detections And Analysis Ppt Gallery Show PDF. The topics addressed in these templates are Total Malicious Detections, Total Unique Hashes, Total Unique Organizations. All the content presented in this PPT design is completely editable. Download it and make adjustments in color, background, font etc. as per your unique business setting.
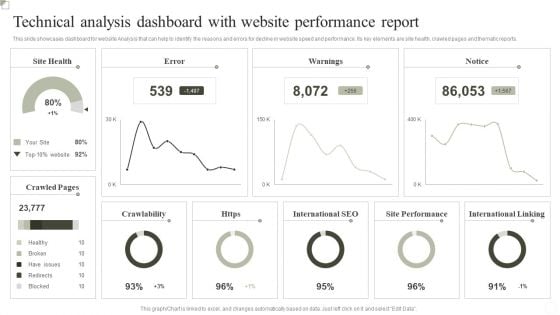
Technical Analysis Dashboard With Website Performance Report Ppt Inspiration Outline PDF
This slide showcases dashboard for website Analysis that can help to identify the reasons and errors for decline in website speed and performance. Its key elements are site health, crawled pages and thematic reports. Showcasing this set of slides titled Technical Analysis Dashboard With Website Performance Report Ppt Inspiration Outline PDF. The topics addressed in these templates are Crawlability, International SEO, Site Performance, International Linking. All the content presented in this PPT design is completely editable. Download it and make adjustments in color, background, font etc. as per your unique business setting.
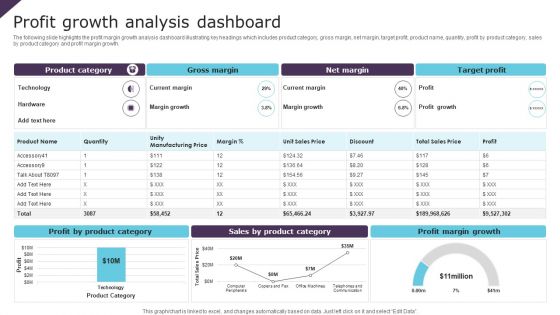
Profit Growth Analysis Dashboard Ppt PowerPoint Presentation File Design Templates PDF
The following slide highlights the profit margin growth analysis dashboard illustrating key headings which includes product category, gross margin, net margin, target profit, product name, quantity, profit by product category, sales by product category and profit margin growth. Showcasing this set of slides titled Profit Growth Analysis Dashboard Ppt PowerPoint Presentation File Design Templates PDF. The topics addressed in these templates are Gross Margin, Net Margin, Target Profit. All the content presented in this PPT design is completely editable. Download it and make adjustments in color, background, font etc. as per your unique business setting.
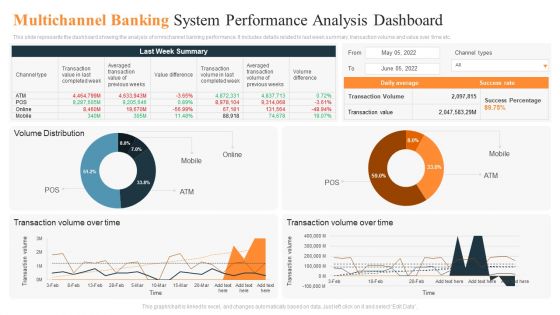
Multichannel Banking System Performance Analysis Dashboard Ppt Pictures Background Designs PDF
This slide represents the dashboard showing the analysis of omnichannel banking performance. It includes details related to last week summary, transaction volume and value over time etc. Showcasing this set of slides titled Multichannel Banking System Performance Analysis Dashboard Ppt Pictures Background Designs PDF. The topics addressed in these templates are Last Week Summary, Transaction Volume, Over Time. All the content presented in this PPT design is completely editable. Download it and make adjustments in color, background, font etc. as per your unique business setting.
Executing Online Solution In Banking Dashboard Tracking Customer Activities And Revenue Generated Information PDF
This slide contains dashboard that will allow bank to track the customer activities in terms of new customer acquired, customer acquisition cost and overall revenue generated. Deliver and pitch your topic in the best possible manner with this executing online solution in banking dashboard tracking customer activities and revenue generated information pdf. Use them to share invaluable insights on compared to previous year, target achievement, customers acquisition, actual revenue and impress your audience. This template can be altered and modified as per your expectations. So, grab it now.
Experiential Retail Plan Tracking Essential Retail Store Activities Dashboard Retention Information PDF
This slide provides details regarding the dashboard for tracking retail store activities in terms of customer retention, rate of return, volume sales, etc. Deliver an awe inspiring pitch with this creative experiential retail plan tracking essential retail store activities dashboard retention information pdf bundle. Topics like rate of return, rate of return by category, customer retention, number of new and returning customers can be discussed with this completely editable template. It is available for immediate download depending on the needs and requirements of the user.
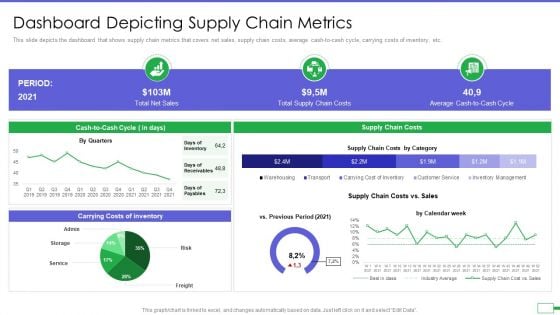
Iot And Digital Twin To Reduce Costs Post Covid Dashboard Depicting Supply Chain Metrics Information PDF
This slide depicts the dashboard that shows supply chain metrics that covers net sales, supply chain costs, average cash to cash cycle, carrying costs of inventory, etc. Deliver an awe inspiring pitch with this creative iot and digital twin to reduce costs post covid dashboard depicting supply chain metrics information pdf bundle. Topics like covers net sales, supply chain costs, average cash to cash cycle, carrying costs of inventory can be discussed with this completely editable template. It is available for immediate download depending on the needs and requirements of the user.
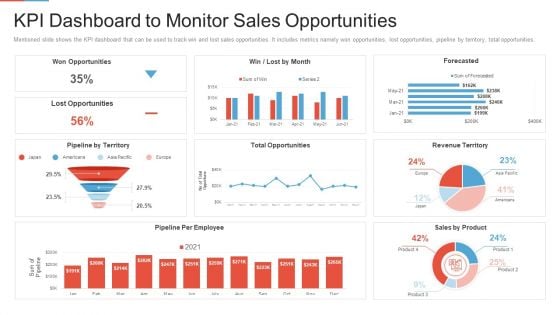
Marketing Outlining Segmentation Initiatives Kpi Dashboard To Monitor Sales Opportunities Information PDF
Mentioned slide shows the KPI dashboard that can be used to track win and lost sales opportunities. It includes metrics namely won opportunities, lost opportunities, pipeline by territory, total opportunities. Deliver an awe inspiring pitch with this creative marketing outlining segmentation initiatives kpi dashboard to monitor sales opportunities information pdf bundle. Topics like opportunities, pipeline by territory, revenue territory, sales by product, pipeline per employee can be discussed with this completely editable template. It is available for immediate download depending on the needs and requirements of the user.
Tracking Essential Retail Store Activities Dashboard Incorporation Of Experience Information PDF
This slide provides details regarding the dashboard for tracking retail store activities in terms of customer retention, rate of return, volume sales, etc. Deliver and pitch your topic in the best possible manner with this tracking essential retail store activities dashboard incorporation of experience information pdf. Use them to share invaluable insights on total volume sales, rate of return, customer retention, number of new and returning customers and impress your audience. This template can be altered and modified as per your expectations. So, grab it now.

Digital Audit Dashboard Indicating Bounce And Churn Rate With Visitors By Channel Information PDF
This slide showcases the dashboard of website digital audit which includes the visitors, leads, customers, MRR, lifetime value, website visitors by channel and top landing page with average per customer revenue. Deliver an awe inspiring pitch with this creative Digital Audit Dashboard Indicating Bounce And Churn Rate With Visitors By Channel Information PDF bundle. Topics like Monthly Recurring Revenue, Bounce Rate, Churn Rate can be discussed with this completely editable template. It is available for immediate download depending on the needs and requirements of the user.
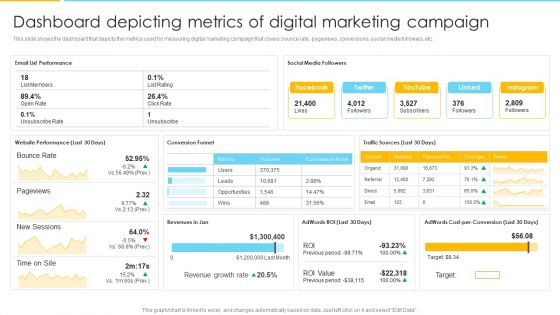
Optimizing Ecommerce Marketing Plan To Improve Sales Dashboard Depicting Metrics Of Digital Marketing Campaign Information PDF
This slide shows the dashboard that depicts the metrics used for measuring digital marketing campaign that covers bounce rate, pageviews, conversions, social media followers, etc. Deliver and pitch your topic in the best possible manner with this Optimizing Ecommerce Marketing Plan To Improve Sales Dashboard Depicting Metrics Of Digital Marketing Campaign Information PDF. Use them to share invaluable insights on Traffic Sources, Conversion Rate, Revenue Growth Rate and impress your audience. This template can be altered and modified as per your expectations. So, grab it now.
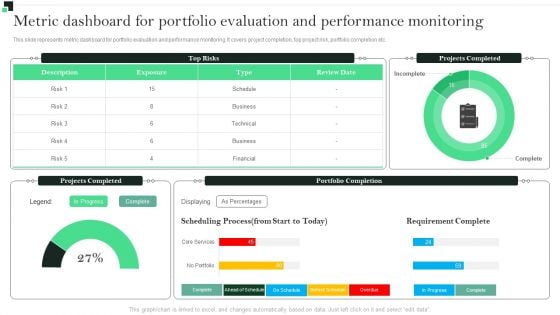
Metric Dashboard For Portfolio Performance Monitoring Strategies To Enhance Portfolio Management Information PDF
This slide represents metric dashboard for portfolio evaluation and performance monitoring. It covers project completion, top project risk, portfolio completion etc.Want to ace your presentation in front of a live audience Our Metric Dashboard For Portfolio Performance Monitoring Strategies To Enhance Portfolio Management Information PDF can help you do that by engaging all the users towards you.. Slidegeeks experts have put their efforts and expertise into creating these impeccable powerpoint presentations so that you can communicate your ideas clearly. Moreover, all the templates are customizable, and easy-to-edit and downloadable. Use these for both personal and commercial use.
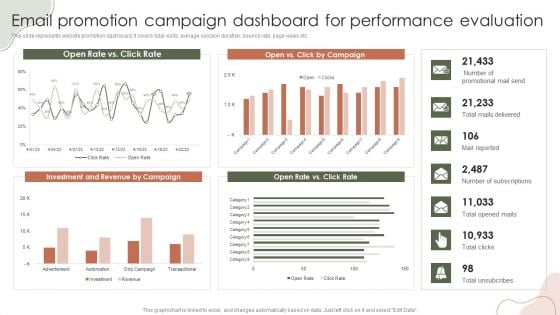
Digital Marketing Approach For Brand Awareness Email Promotion Campaign Dashboard For Performance Evaluation Information PDF
This slide represents website promotion dashboard. It covers total visits, average session duration, bounce rate, page views etc. Present like a pro with Digital Marketing Approach For Brand Awareness Email Promotion Campaign Dashboard For Performance Evaluation Information PDF Create beautiful presentations together with your team, using our easy-to-use presentation slides. Share your ideas in real-time and make changes on the fly by downloading our templates. So whether you are in the office, on the go, or in a remote location, you can stay in sync with your team and present your ideas with confidence. With Slidegeeks presentation got a whole lot easier. Grab these presentations today.
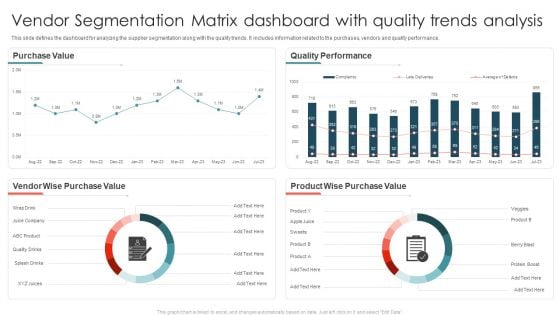
Vendor Segmentation Matrix Dashboard With Quality Trends Analysis Ppt Model Rules PDF
This slide defines the dashboard for analyzing the supplier segmentation along with the quality trends. It includes information related to the purchases, vendors and quality performance. Pitch your topic with ease and precision using this Vendor Segmentation Matrix Dashboard With Quality Trends Analysis Ppt Model Rules PDF. This layout presents information on Purchase Value, Quality Performance, Vendor Wise. It is also available for immediate download and adjustment. So, changes can be made in the color, design, graphics or any other component to create a unique layout.
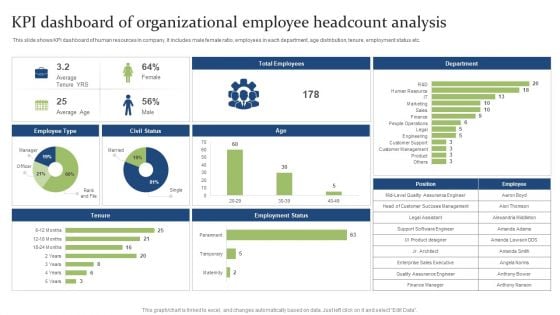
KPI Dashboard Of Organizational Employee Headcount Analysis Ppt PowerPoint Presentation Styles Show PDF
This slide shows KPI dashboard of human resources in company. It includes male female ratio, employees in each department, age distribution, tenure, employment status etc. Showcasing this set of slides titled KPI Dashboard Of Organizational Employee Headcount Analysis Ppt PowerPoint Presentation Styles Show PDF. The topics addressed in these templates are Support Software, Engineer Success, Sales Executive. All the content presented in this PPT design is completely editable. Download it and make adjustments in color, background, font etc. as per your unique business setting.
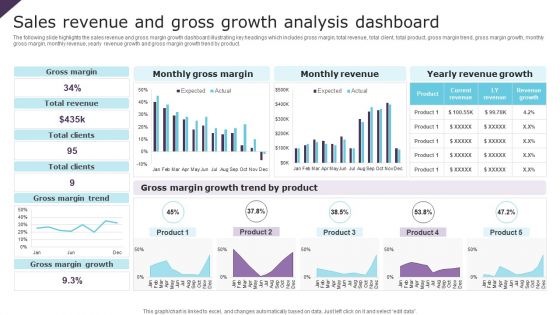
Sales Revenue And Gross Growth Analysis Dashboard Ppt Inspiration Background Image PDF
The following slide highlights the sales revenue and gross margin growth dashboard illustrating key headings which includes gross margin, total revenue, total client, total product, gross margin trend, gross margin growth, monthly gross margin, monthly revenue, yearly revenue growth and gross margin growth trend by product. Showcasing this set of slides titled Sales Revenue And Gross Growth Analysis Dashboard Ppt Inspiration Background Image PDF. The topics addressed in these templates are Gross Margin, Total Revenue, Total Clients. All the content presented in this PPT design is completely editable. Download it and make adjustments in color, background, font etc. as per your unique business setting.
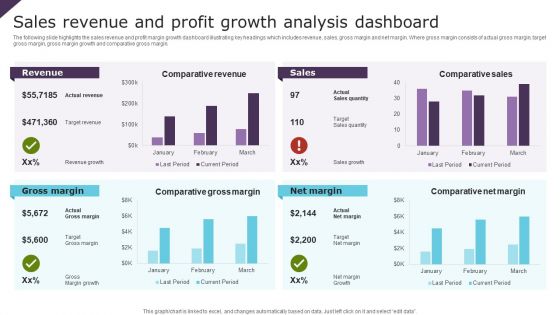
Sales Revenue And Profit Growth Analysis Dashboard Ppt Portfolio Slide PDF
The following slide highlights the sales revenue and profit margin growth dashboard illustrating key headings which includes revenue, sales, gross margin and net margin. Where gross margin consists of actual gross margin, target gross margin, gross margin growth and comparative gross margin. Showcasing this set of slides titled Sales Revenue And Profit Growth Analysis Dashboard Ppt Portfolio Slide PDF. The topics addressed in these templates are Revenue, Sales, Gross Margin, Net Margin. All the content presented in this PPT design is completely editable. Download it and make adjustments in color, background, font etc. as per your unique business setting.
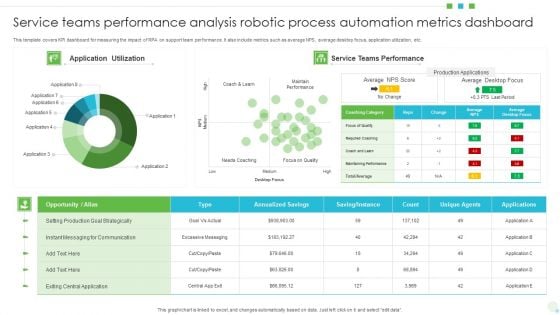
Service Teams Performance Analysis Robotic Process Automation Metrics Dashboard Brochure PDF
This template covers KPI dashboard for measuring the impact of RPA on support team performance. It also include metrics such as average NPS, average desktop focus, application utilization, etc. Showcasing this set of slides titled Service Teams Performance Analysis Robotic Process Automation Metrics Dashboard Brochure PDF. The topics addressed in these templates are Opportunity, Production Goal Strategically, Application Utilization. All the content presented in this PPT design is completely editable. Download it and make adjustments in color, background, font etc. as per your unique business setting.
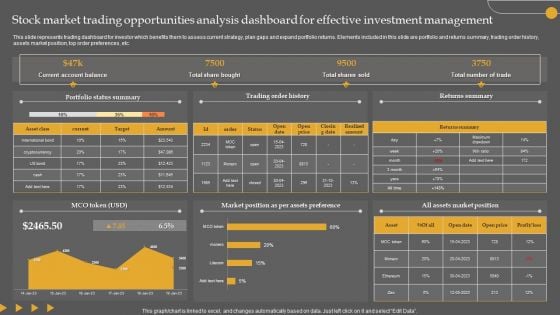
Stock Market Trading Opportunities Analysis Dashboard For Effective Investment Management Slides PDF
This slide represents trading dashboard for investor which benefits them to assess current strategy, plan gaps and expand portfolio returns. Elements included in this slide are portfolio and returns summary, trading order history, assets market position, top order preferences, etc. Showcasing this set of slides titled Stock Market Trading Opportunities Analysis Dashboard For Effective Investment Management Slides PDF. The topics addressed in these templates are Portfolio Status Summary, Trading Order History, Returns Summary. All the content presented in this PPT design is completely editable. Download it and make adjustments in color, background, font etc. as per your unique business setting.
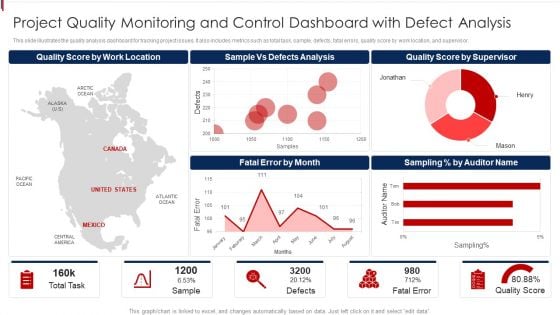
Project Quality Monitoring And Control Dashboard With Defect Analysis Demonstration PDF
This slide illustrates the quality analysis dashboard for tracking project issues. It also includes metrics such as total task, sample, defects, fatal errors, quality score by work location, and supervisor. Pitch your topic with ease and precision using this Project Quality Monitoring And Control Dashboard With Defect Analysis Demonstration PDF. This layout presents information on Location, Analysis, Supervisor. It is also available for immediate download and adjustment. So, changes can be made in the color, design, graphics or any other component to create a unique layout.


 Continue with Email

 Home
Home


