Data Dashboard
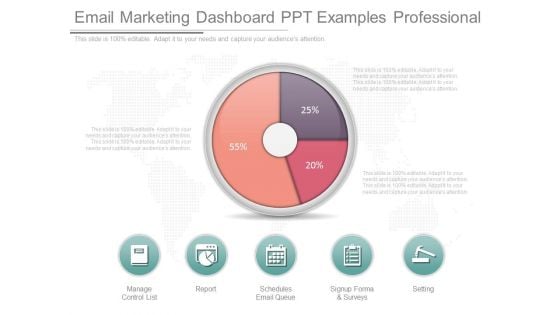
Email Marketing Dashboard Ppt Examples Professional
This is a email marketing dashboard ppt examples professional. This is a three stage process. The stages in this process are manage control list, report, schedules email queue, signup forma and surveys, setting.
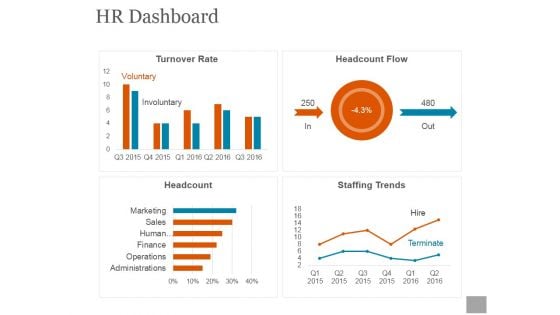
Hr Dashboard Ppt PowerPoint Presentation Shapes
This is a hr dashboard ppt powerpoint presentation shapes. This is a four stage process. The stages in this process are total employees, key metrics, employee churn, open positions by divisions.
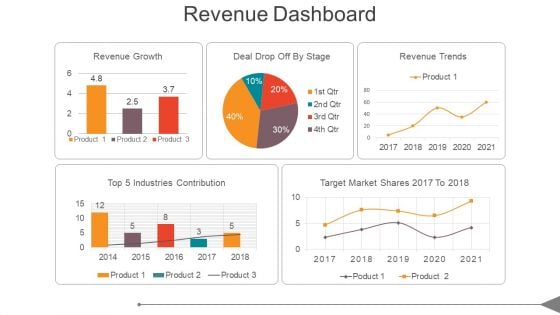
Revenue Dashboard Ppt PowerPoint Presentation Show
This is a revenue dashboard ppt powerpoint presentation show. This is a five stage process. The stages in this process are top 5 industries contribution, revenue growth, deal drop off by stage, revenue trends, target market shares 2017 to 2018.
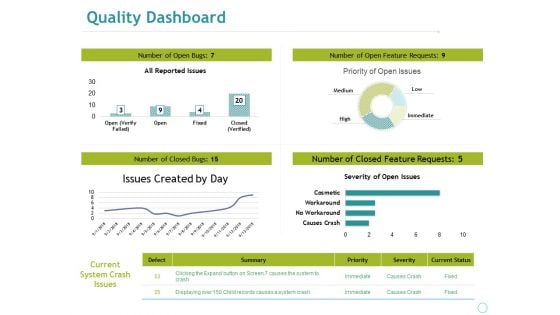
Quality Dashboard Ppt PowerPoint Presentation File Guide
This is a quality dashboard ppt powerpoint presentation file guide. This is a four stage process. The stages in this process are business, marketing, all reported issues, issues created by day, severity of open issues.
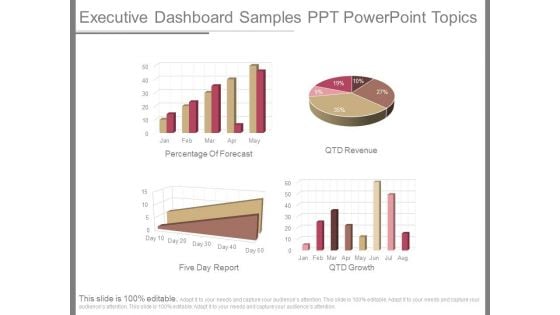
Executive Dashboard Samples Ppt Powerpoint Topics
This is a executive dashboard samples ppt powerpoint topics. This is a four stage process. The stages in this process are percentage of forecast, qtd revenue, five day report, qtd growth
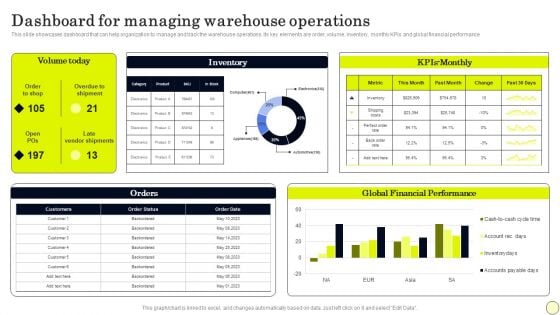
Dashboard For Managing Warehouse Operations Diagrams PDF
This slide showcases dashboard that can help organization to manage and track the warehouse operations. Its key elements are order, volume, inventory, monthly KPIs and global financial performance. Presenting this PowerPoint presentation, titled Dashboard For Managing Warehouse Operations Diagrams PDF, with topics curated by our researchers after extensive research. This editable presentation is available for immediate download and provides attractive features when used. Download now and captivate your audience. Presenting this Dashboard For Managing Warehouse Operations Diagrams PDF. Our researchers have carefully researched and created these slides with all aspects taken into consideration. This is a completely customizable Dashboard For Managing Warehouse Operations Diagrams PDF that is available for immediate downloading. Download now and make an impact on your audience. Highlight the attractive features available with our PPTs.
Cloud Performance Tracking Dashboard Professional PDF
This slide covers the Key performance indicators for tracking performance of the cloud such as violations break down, sources, rules and severity. Deliver an awe inspiring pitch with this creative Cloud Performance Tracking Dashboard Professional PDF bundle. Topics like Cloud Performance, Tracking Dashboard can be discussed with this completely editable template. It is available for immediate download depending on the needs and requirements of the user.
Factory Waste Management Tracking Dashboard Inspiration PDF
This slide covers the key performance indicators for waste management including waste trucks tracker, green house gasses emissions, energy used and many more Deliver and pitch your topic in the best possible manner with this factory waste management tracking dashboard inspiration pdf. Use them to share invaluable insights on factory waste management tracking dashboard and impress your audience. This template can be altered and modified as per your expectations. So, grab it now.
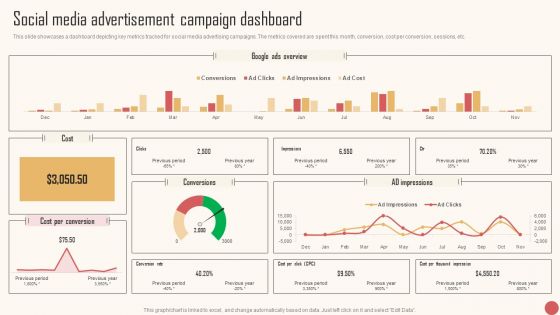
Social Media Advertisement Campaign Dashboard Themes PDF
This slide showcases a dashboard depicting key metrics tracked for social media advertising campaigns. The metrics covered are spent this month, conversion, cost per conversion, sessions, etc. There are so many reasons you need a Social Media Advertisement Campaign Dashboard Themes PDF. The first reason is you can not spend time making everything from scratch, Thus, Slidegeeks has made presentation templates for you too. You can easily download these templates from our website easily.
Cart Recovery Dashboard Ppt Outline Icon PDF
Measure which email campaigns brought the most recovery, which age group responded the best, and other KPIs via a dashboard. Deliver an awe-inspiring pitch with this creative cart recovery dashboard ppt outline icon pdf bundle. Topics like recovery by the numbers, recovery breakdown, revenue per email rpe can be discussed with this completely editable template. It is available for immediate download depending on the needs and requirements of the user.
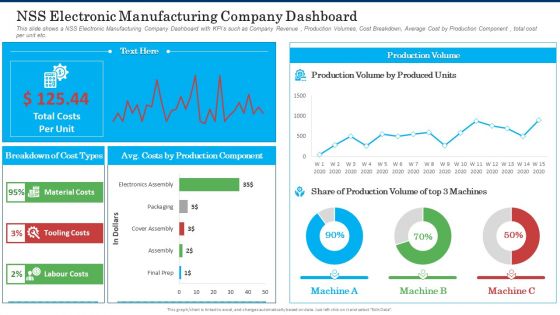
NSS Electronic Manufacturing Company Dashboard Topics PDF
This slide shows a NSS Electronic Manufacturing Company Dashboard with KPIs such as Company Revenue , Production Volumes, Cost Breakdown, Average Cost by Production Component , total cost per unit etc. Deliver an awe inspiring pitch with this creative nss electronic manufacturing company dashboard topics pdf bundle. Topics like material costs, tooling costs, labour costs, total costs per unit can be discussed with this completely editable template. It is available for immediate download depending on the needs and requirements of the user.

Vendor Compliance Monitoring Dashboard Background PDF
Following slide shows vendor compliance monitoring dashboard. It covers KPIs namely top supplier by partner status, average procurement cycle time and average procurement cycle. Deliver and pitch your topic in the best possible manner with this vendor compliance monitoring dashboard background pdf. Use them to share invaluable insights on suppliers, procurement and impress your audience. This template can be altered and modified as per your expectations. So, grab it now.
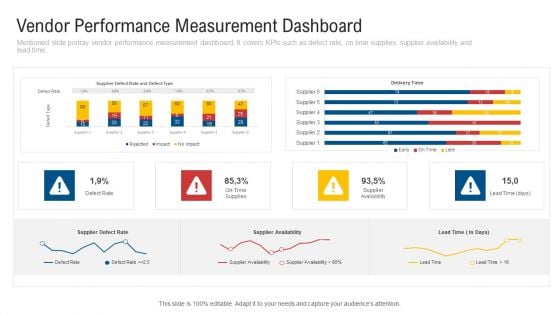
Vendor Performance Measurement Dashboard Brochure PDF
Mentioned slide portray vendor performance measurement dashboard. It covers KPIs such as defect rate, on time supplies, supplier availability and lead time. Deliver an awe inspiring pitch with this creative vendor performance measurement dashboard brochure pdf bundle. Topics like supplier defect rate, supplier availability, lead time can be discussed with this completely editable template. It is available for immediate download depending on the needs and requirements of the user.

Vendor Compliance Monitoring Dashboard Template PDF
Following slide shows vendor compliance monitoring dashboard. It covers KPIs namely top supplier by partner status, average procurement cycle time and average procurement cycle. Deliver an awe-inspiring pitch with this creative vendor compliance monitoring dashboard template pdf. bundle. Topics like rate of contract compliance by supplier category, procurement cycle time, procurement cycle, top suppliers by partner status can be discussed with this completely editable template. It is available for immediate download depending on the needs and requirements of the user.
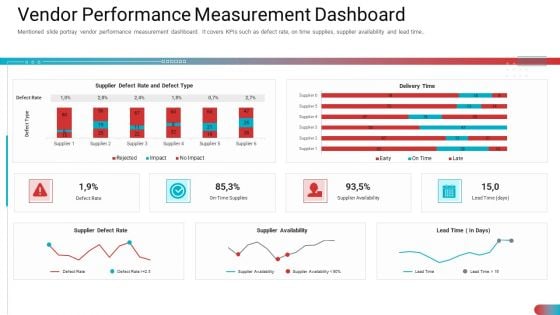
Vendor Performance Measurement Dashboard Inspiration PDF
Mentioned slide portray vendor performance measurement dashboard. It covers KPIs such as defect rate, on time supplies, supplier availability and lead time. Deliver and pitch your topic in the best possible manner with this vendor performance measurement dashboard inspiration pdf. Use them to share invaluable insights on supplier defect rate, supplier availability, lead time and impress your audience. This template can be altered and modified as per your expectations. So, grab it now.
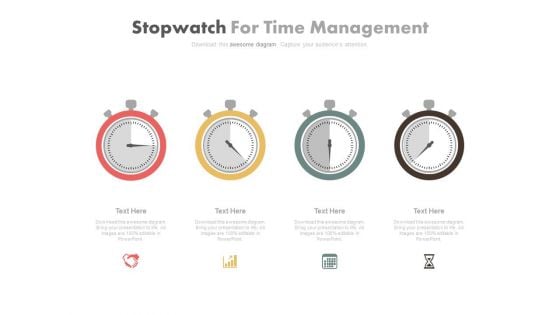
Dashboard Diagram For Time Management Powerpoint Slides
This PPT slide has been designed with graphics of four stop watches. You may sue this PowerPoint template for time management. This dashboard slide may useful for multilevel status report creation and approval process.
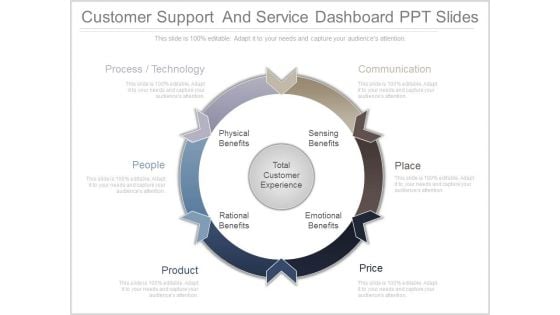
Customer Support And Service Dashboard Ppt Slides
This is a customer support and service dashboard ppt slides. This is a six stage process. The stages in this process are total customer experience, physical benefits, rational benefits, emotional benefits, sensing benefits, people, product.
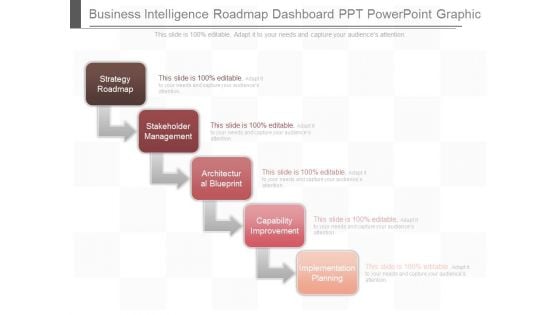
Business Intelligence Roadmap Dashboard Ppt Powerpoint Graphic
This is a business intelligence roadmap dashboard ppt powerpoint graphic. This is a five stage process. The stages in this process are strategy roadmap, stakeholder management, architectural blueprint, capability improvement, implementation planning.
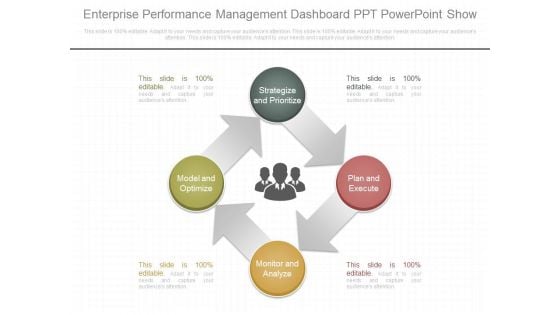
Enterprise Performance Management Dashboard Ppt Powerpoint Show
This is a enterprise performance management dashboard ppt powerpoint show. This is a four stage process. The stages in this process are strategize and prioritize, plan and execute, monitor and analyze, model and optimize.
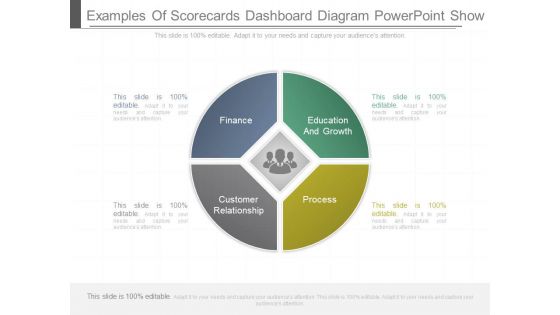
Examples Of Scorecards Dashboard Diagram Powerpoint Show
This is a examples of scorecards dashboard diagram powerpoint show. This is a four stage process. The stages in this process are finance, education and growth, customer relationship, process.

Clear Point Community Dashboard Example Ppt Slide
This is a clear point community dashboard example ppt slide. This is a four stage process. The stages in this process are internal perspective, learning and growth, financial perspective, customer perspective.
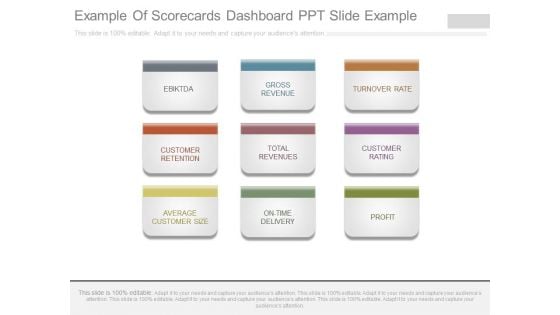
Example Of Scorecards Dashboard Ppt Slide Example
This is a example of scorecards dashboard ppt slide example. This is a nine stage process. The stages in this process are ebiktda, gross revenue, turnover rate, customer retention, total revenues, customer rating, average customer size, on time delivery, profit.
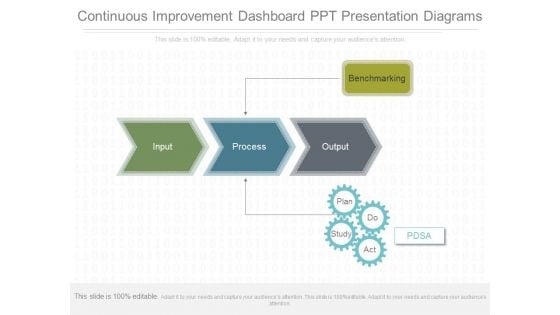
Continuous Improvement Dashboard Ppt Presentation Diagrams
This is a continuous improvement dashboard ppt presentation diagrams. This is a five stage process. The stages in this process are benchmarking, input, process, output, pdsa, plan, do, study, act.
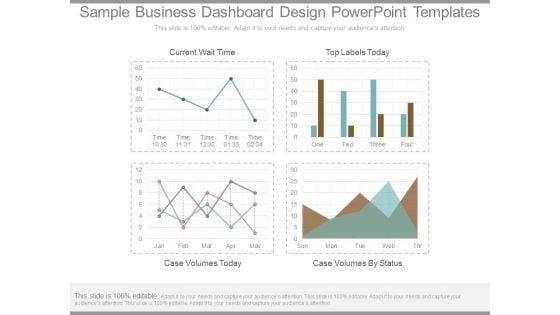
Sample Business Dashboard Design Powerpoint Templates
This is a sample business dashboard design powerpoint templates. This is a four stage process. The stages in this process are current wait time, top labels today, case volumes today, case volumes by status.
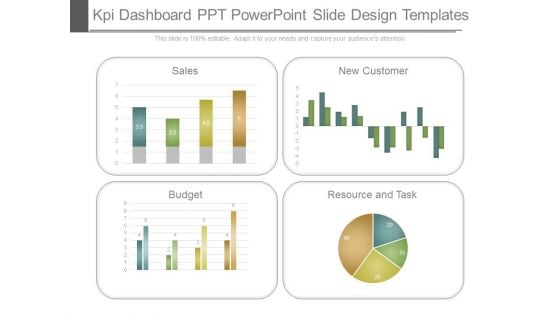
Kpi Dashboard Ppt Powerpoint Slide Design Templates
This is a kpi dashboard ppt powerpoint slide design templates. This is a four stage process. The stages in this process are sales, new customer, budget, resource and task.
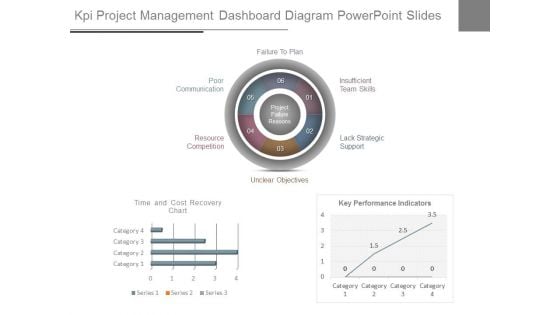
Kpi Project Management Dashboard Diagram Powerpoint Slides
This is a kpi project management dashboard diagram powerpoint slides. This is a three stage process. The stages in this process are unclear objectives, resource competition, poor communication, failure to plan, insufficient team skills, lack strategic support.
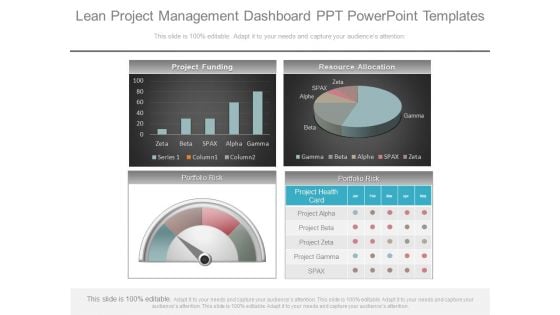
Lean Project Management Dashboard Ppt Powerpoint Templates
This is a lean project management dashboard ppt powerpoint templates. This is a four stage process. The stages in this process are project funding, resource allocation, portfolio risk, project health card, project alpha, project beta, project zeta, project gamma, spax.
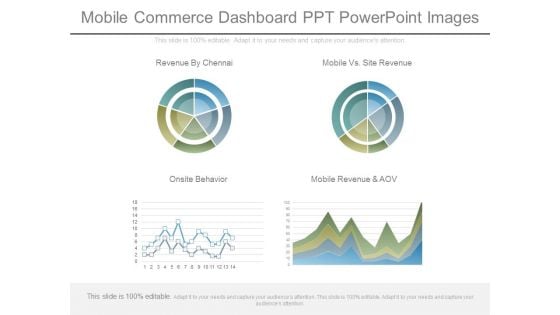
Mobile Commerce Dashboard Ppt Powerpoint Images
This is a mobile commerce dashboard ppt powerpoint images. This is a four stage process. The stages in this process are revenue by chennai, mobile vs site revenue, onsite behavior, mobile revenue and aov.
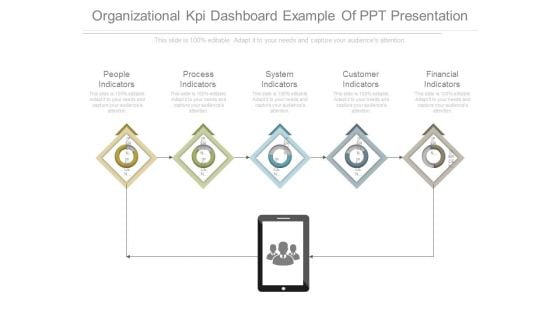
Organizational Kpi Dashboard Example Of Ppt Presentation
This is a organizational kpi dashboard example of ppt presentation. This is a five stage process. The stages in this process are people indicators, process indicators, system indicators, customer indicators, financial indicators.
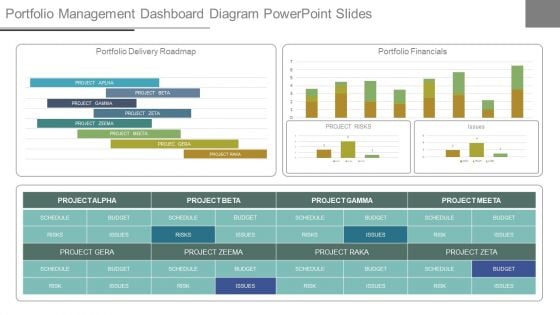
Portfolio Management Dashboard Diagram Powerpoint Slides
This is a portfolio management dashboard diagram powerpoint slides. This is a three stage process. The stages in this process are portfolio delivery roadmap, portfolio financials, project alpha, project beeta, project gama, project zeta, project zeema, schedule, risks, issues, budget.
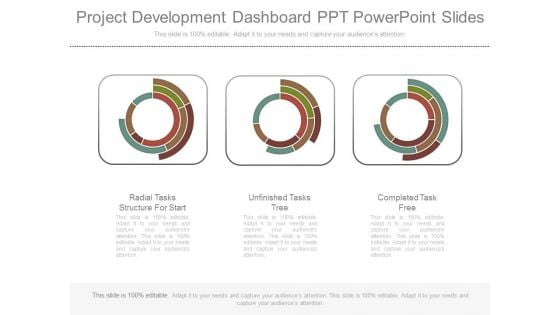
Project Development Dashboard Ppt Powerpoint Slides
This is a project development dashboard ppt powerpoint slides. This is a three stage process. The stages in this process are radial tasks structure for start, unfinished tasks tree, completed task free.
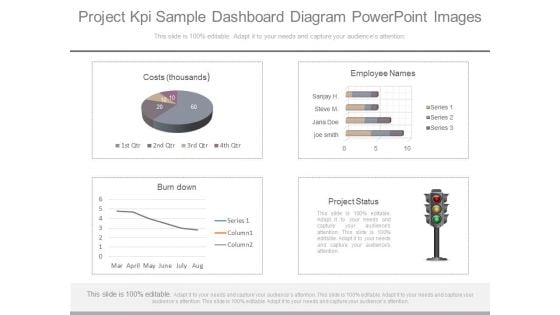
Project Kpi Sample Dashboard Diagram Powerpoint Images
This is a project kpi sample dashboard diagram powerpoint images. This is a four stage process. The stages in this process are costs thousands, employee names, burndown, project status.
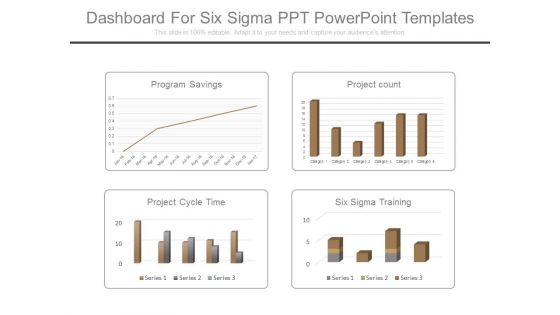
Dashboard For Six Sigma Ppt Powerpoint Templates
This is a dashboard for six sigma ppt powerpoint templates. This is a four stage process. The stages in this process are program savings, project count, project cycle time, six sigma training.
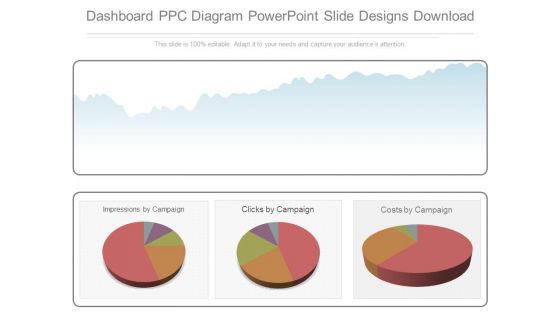
Dashboard Ppc Diagram Powerpoint Slide Designs Download
This is a dashboard ppc diagram powerpoint slide designs download. This is a three stage process. The stages in this process are impressions by campaign, clicks by campaign, costs by campaign.

Email Program Dashboard Ppt Powerpoint Slides
This is a email program dashboard ppt powerpoint slides. This is a four stage process. The stages in this process are send test, clicks, clicks to open, summary, admin, administrator, chris, hssadmin.
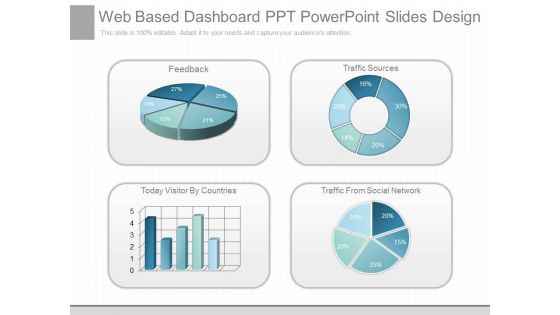
Web Based Dashboard Ppt Powerpoint Slides Design
This is a web based dashboard ppt powerpoint slides design. This is a four stage process. The stages in this process are feedback, traffic sources, today visitor by countries, traffic from social network.
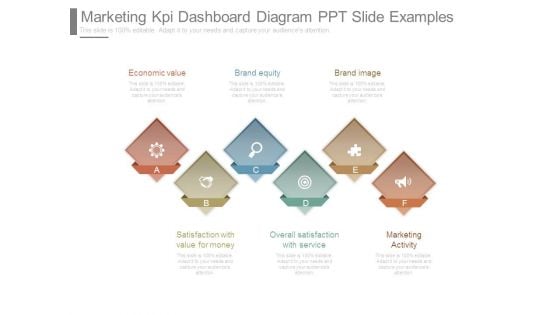
Marketing Kpi Dashboard Diagram Ppt Slide Examples
This is a marketing kpi dashboard diagram ppt slide examples. This is a six stage process. The stages in this process are economic value, satisfaction with value for money, brand equity, overall satisfaction with service, brand image, marketing activity.

Basic Localization Dashboard Diagram Ppt Example
This is a basic localization dashboard diagram ppt example. This is a two stage process. The stages in this process are quantity details of products sold by countries, products sold by month.
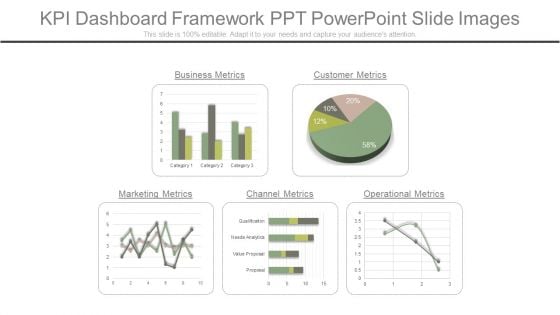
Kpi Dashboard Framework Ppt Powerpoint Slide Images
This is a kpi dashboard framework ppt powerpoint slide images. This is a five stage process. The stages in this process are business metrics, customer metrics, operational metrics, channel metrics, marketing metrics.
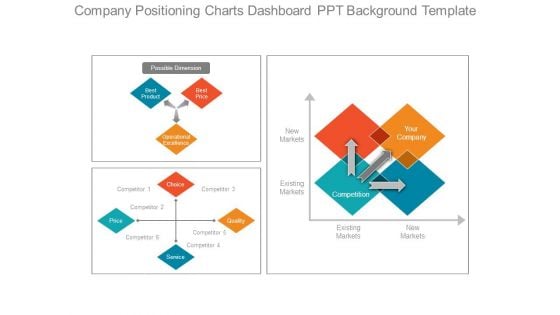
Company Positioning Charts Dashboard Ppt Background Template
This is a company positioning charts dashboard ppt background template. This is a four stage process. The stages in this process are possible dimension, best product, best price, operational excellence, choice, service, quality, competition, your company.
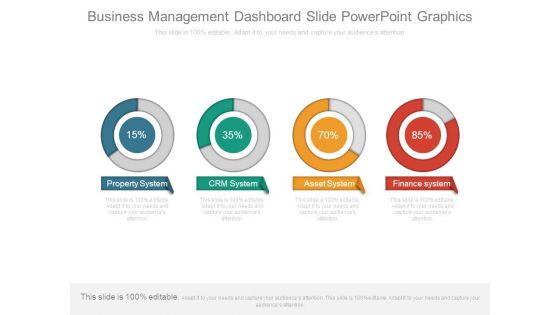
Business Management Dashboard Slide Powerpoint Graphics
This is a business management dashboard slide powerpoint graphics. This is a four stage process. The stages in this process are property system, crm system, asset system, finance system.
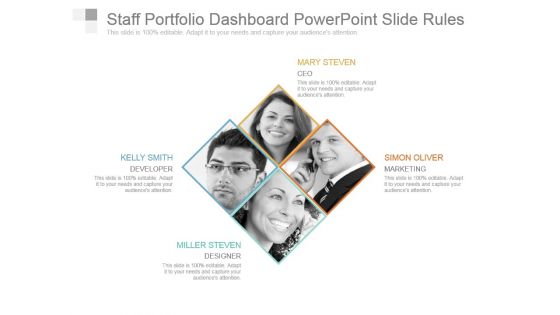
Staff Portfolio Dashboard Powerpoint Slide Rules
This is a staff portfolio dashboard powerpoint slide rules. This is a four stage process. The stages in this process are mary steven ceo, simon oliver marketing, miller steven designer, kelly smith developer.
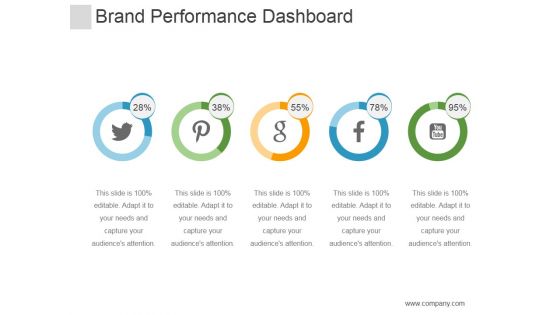
Brand Performance Dashboard Ppt PowerPoint Presentation Gallery
This is a brand performance dashboard ppt powerpoint presentation gallery. This is a two stage process. The stages in this process are intensity by state last hour, emerging topics, new customer, later this year, film.
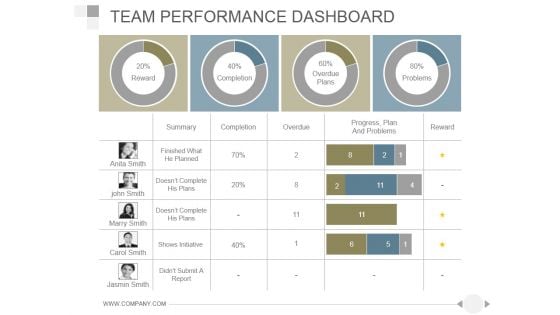
Team Performance Dashboard Ppt PowerPoint Presentation Rules
This is a team performance dashboard ppt powerpoint presentation rules. This is a four stage process. The stages in this process are summary, completion, overdue, progress, plan and problems, reward.

Sales Performance Dashboard Ppt PowerPoint Presentation Good
This is a sales performance dashboard ppt powerpoint presentation good. This is a four stage process. The stages in this process are lead sources revenue share, total sales by month, opportunities total sales by probability, win loss ratio.
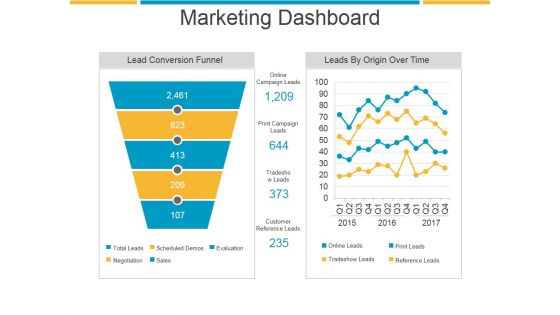
Marketing Dashboard Ppt PowerPoint Presentation Show
This is a marketing dashboard ppt powerpoint presentation show. This is a five stage process. The stages in this process are lead conversion funnel, leads by origin over time.

Hr Dashboard Template Ppt PowerPoint Presentation Deck
This is a hr dashboard template ppt powerpoint presentation deck. This is a four stage process. The stages in this process are turnover rate, headcount flow, headcount, staffing trends.
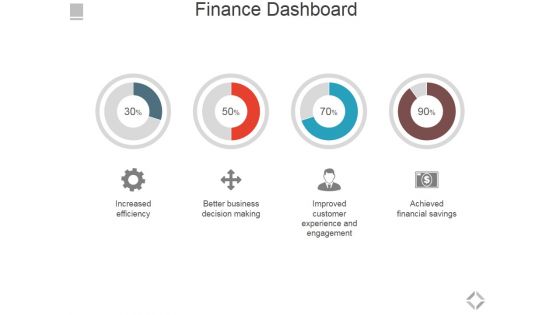
Finance Dashboard Ppt PowerPoint Presentation Layouts Infographics
This is a finance dashboard ppt powerpoint presentation layouts infographics. This is a four stage process. The stages in this process are increased efficiency, better business decision making, improved customer experience and engagement, achieved financial savings.
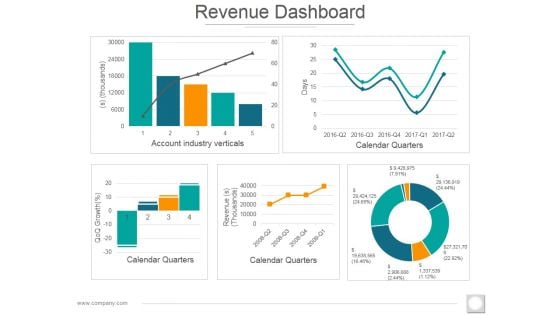
Revenue Dashboard Ppt PowerPoint Presentation Professional Microsoft
This is a revenue dashboard ppt powerpoint presentation professional microsoft. This is a five stage process. The stages in this process are account industry verticals, calendar quarters, revenue thousand, thousands.
Devops Continuous Workflow Tracking Dashboard Slides PDF
This slide provides the glimpse of facts and figures related to continuous monitoring of project with DevOps. It includes planned vs. completed work items, work item priority wise, active bugs severity wise, etc. Showcasing this set of slides titled Devops Continuous Workflow Tracking Dashboard Slides PDF. The topics addressed in these templates are Continuous Workflow, Tracking Dashboard, Sprint Analysis By Assignee. All the content presented in this PPT design is completely editable. Download it and make adjustments in color, background, font etc. as per your unique business setting.
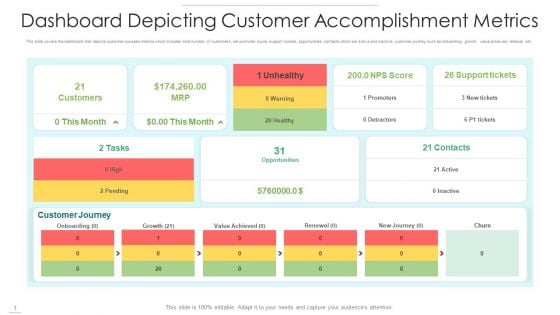
Dashboard Depicting Customer Accomplishment Metrics Slides PDF
This slide covers the dashboard that depicts customer success metrics which includes total number of customers, net promoter score, support tickets, opportunities, contacts which are active and inactive, customer journey such as onboarding, growth, value achieved, renewal, etc. Showcasing this set of slides titled dashboard depicting customer accomplishment metrics slides pdf. The topics addressed in these templates are customers, unhealthy, support tickets. All the content presented in this PPT design is completely editable. Download it and make adjustments in color, background, font etc. as per your unique business setting.

Client Acquisition Cost Measurement Dashboard Infographics PDF
This slide shows a Client Acquisition Cost CAC Measurement Dashboard with details such as total customers, employee satisfaction rate, number of trials, monthly active users, NPS net promoter score etc. Deliver an awe inspiring pitch with this creative client acquisition cost measurement dashboard infographics pdf bundle. Topics like funnel conversion rate, opportunity, key takeaways can be discussed with this completely editable template. It is available for immediate download depending on the needs and requirements of the user.
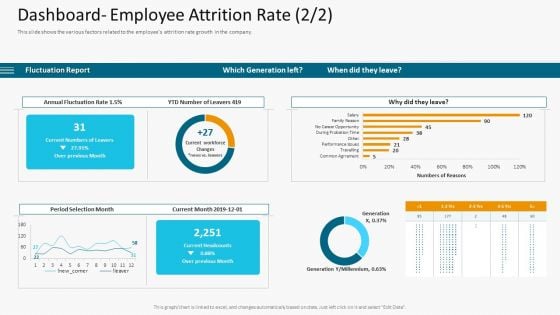
Dashboard Employee Attrition Rate Grid Sample PDF
This slide shows the various factors related to the employees attrition rate growth in the company. Deliver an awe inspiring pitch with this creative dashboard employee attrition rate grid sample pdf bundle. Topics like annual fluctuation rate, period selection month, dashboard employee attrition rate can be discussed with this completely editable template. It is available for immediate download depending on the needs and requirements of the user.
360 Degree Feedback Dashboard Icons PDF
This slide covers the organization dashboard wherein participation status, reviews of all employees can be visualized here.Deliver an awe inspiring pitch with this creative 360 degree feedback dashboard icons pdf bundle. Topics like participation, templates assigned, employee review, manager review, reviews locked can be discussed with this completely editable template. It is available for immediate download depending on the needs and requirements of the user.
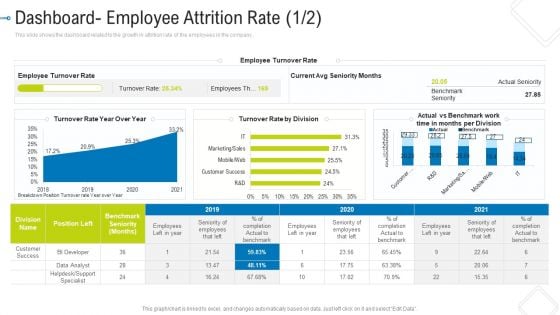
Dashboard Employee Attrition Rate Seniority Template PDF
This slide shows the dashboard related to the growth in attrition rate of the employees in the company .Deliver an awe inspiring pitch with this creative dashboard employee attrition rate seniority template pdf bundle. Topics like employee turnover rate, benchmark seniority, current avg seniority months can be discussed with this completely editable template. It is available for immediate download depending on the needs and requirements of the user.
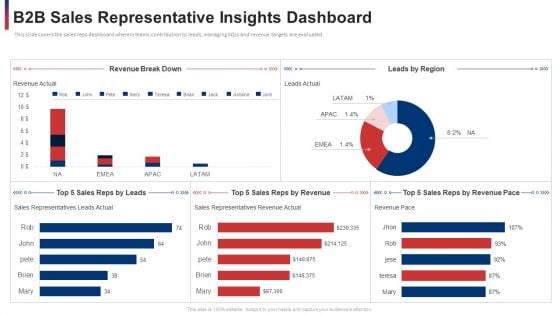
B2b Sales Representative Insights Dashboard Sample PDF
Deliver and pitch your topic in the best possible manner with this b2b sales representative insights dashboard sample pdf. Use them to share invaluable insights on sales representative insights dashboardThis slide covers the sales reps dashboard wherein teams contribution to leads, managing SQLs and revenue targets are evaluated. and impress your audience. This template can be altered and modified as per your expectations. So, grab it now.
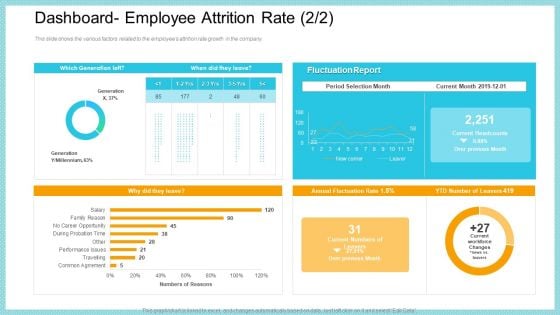
Dashboard Employee Attrition Rate Growth Diagrams PDF
This slide shows the various factors related to the employees attrition rate growth in the company. Deliver and pitch your topic in the best possible manner with this dashboard employee attrition rate growth diagrams pdf. Use them to share invaluable insights on dashboard employee attrition rate and impress your audience. This template can be altered and modified as per your expectations. So, grab it now.

Dashboard For Application Performance Monitoring Summary PDF
Following slide aims to highlight overall improvement or reduction in total cost of companys existing IT Infrastructure services covering service cost, hardware maintenance cost and application cost.Deliver and pitch your topic in the best possible manner with this dashboard for application performance monitoring summary pdf. Use them to share invaluable insights on dashboard for application performance monitoring and impress your audience. This template can be altered and modified as per your expectations. So, grab it now.
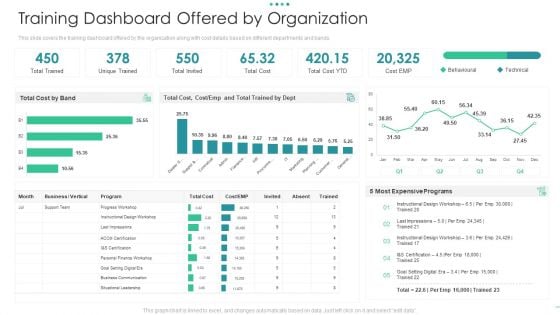
Training Dashboard Offered By Organization Slides PDF
This slide covers the training dashboard offered by the organization along with cost details based on different departments and bands. Deliver and pitch your topic in the best possible manner with this training dashboard offered by organization slides pdf. Use them to share invaluable insights on cost, technical, program and impress your audience. This template can be altered and modified as per your expectations. So, grab it now.
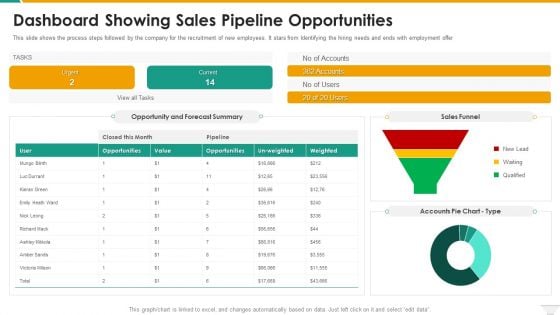
Dashboard Showing Sales Pipeline Opportunities Microsoft PDF
This slide shows the process steps followed by the company for the recruitment of new employees. It stars from Identifying the hiring needs and ends with employment offer. Deliver and pitch your topic in the best possible manner with this Dashboard Showing Sales Pipeline Opportunities Microsoft PDF. Use them to share invaluable insights on Dashboard Showing Sales Pipeline Opportunities and impress your audience. This template can be altered and modified as per your expectations. So, grab it now.


 Continue with Email

 Home
Home


