Data Icon
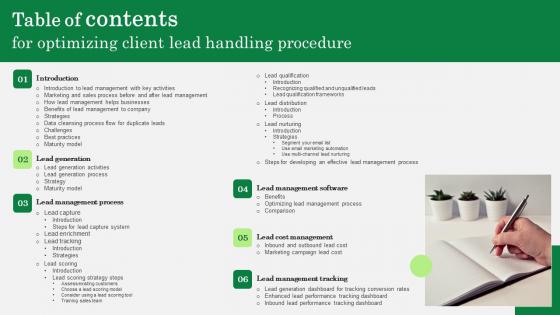
Table Of Contents Optimizing Client Lead Handling Procedure Information Pdf
If you are looking for a format to display your unique thoughts, then the professionally designed Table Of Contents Optimizing Client Lead Handling Procedure Information Pdf is the one for you. You can use it as a Google Slides template or a PowerPoint template. Incorporate impressive visuals, symbols, images, and other charts. Modify or reorganize the text boxes as you desire. Experiment with shade schemes and font pairings. Alter, share or cooperate with other people on your work. Download Table Of Contents Optimizing Client Lead Handling Procedure Information Pdf and find out how to give a successful presentation. Present a perfect display to your team and make your presentation unforgettable. Our Table Of Contents Optimizing Client Lead Handling Procedure Information Pdf are topically designed to provide an attractive backdrop to any subject. Use them to look like a presentation pro.
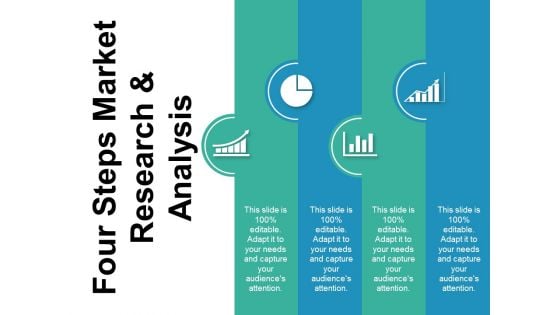
Four Steps Market Reasrch And Analysis Ppt PowerPoint Presentation Infographic Template Maker
This is a four steps market reasrch and analysis ppt powerpoint presentation infographic template maker. This is a four stage process. The stages in this process are metrics icon, kpis icon, statistics icon.
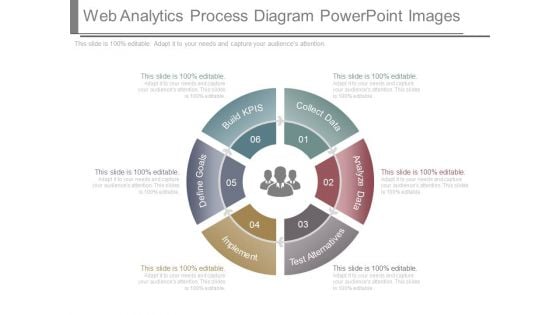
Web Analytics Process Diagram Powerpoint Images
This is a web analytics process diagram powerpoint images. This is a six stage process. The stages in this process are build kpis, define goals, implement, test alternatives, analyze data, collect data.
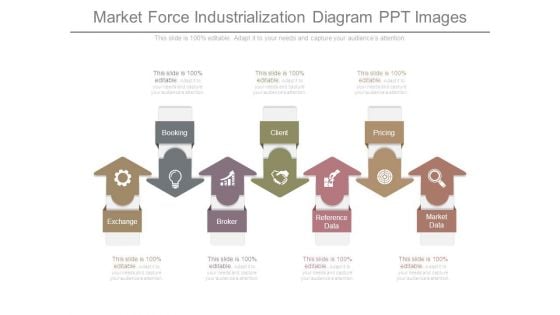
Market Force Industrialization Diagram Ppt Images
This is a market force industrialization diagram ppt images. This is a seven stage process. The stages in this process are booking, exchange, broker, client, reference data, pricing, market data.
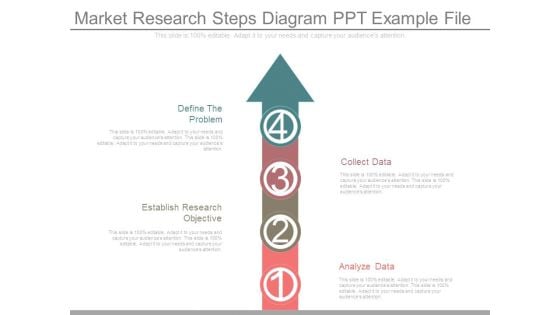
Market Research Steps Diagram Ppt Example File
This is a market research steps diagram ppt example file. This is a four stage process. The stages in this process are define the problem, establish research objective, collect data, analyze data.

Lunar Reconnaissance Orbiter In Powerpoint And Google Slides Cpb
Introducing our well designed Lunar Reconnaissance Orbiter In Powerpoint And Google Slides Cpb. This PowerPoint design presents information on topics like Lunar Reconnaissance Orbiter. As it is predesigned it helps boost your confidence level. It also makes you a better presenter because of its high quality content and graphics. This PPT layout can be downloaded and used in different formats like PDF, PNG, and JPG. Not only this, it is available in both Standard Screen and Widescreen aspect ratios for your convenience. Therefore, click on the download button now to persuade and impress your audience. Our Lunar Reconnaissance Orbiter In Powerpoint And Google Slides Cpb are topically designed to provide an attractive backdrop to any subject. Use them to look like a presentation pro.

Robot Artificial Intelligence Vector With Text Holders Ppt PowerPoint Presentation Infographics Samples
This is a robot artificial intelligence vector with text holders ppt powerpoint presentation infographics samples. This is a one stage process. The stages in this process are machine learning icon, ai icon, artificial intelligence icon.
Percentage Symbol With Text Holders Ppt PowerPoint Presentation Example 2015
This is a percentage symbol with text holders ppt powerpoint presentation example 2015. This is a three stage process. The stages in this process are percentage icon, dividend icon, portion icon.

Three Phases Of Project Rollout Strategy Themes Pdf
This slide highlights major phases of project rollout tactics to enhance task performance and its implementation. It includes pre enablement phase, enablement phase and post enablement phase.Pitch your topic with ease and precision using this Three Phases Of Project Rollout Strategy Themes Pdf This layout presents information on Implement Strategy, Acquire Resources, Determine Requirement It is also available for immediate download and adjustment. So, changes can be made in the color, design, graphics or any other component to create a unique layout. This slide highlights major phases of project rollout tactics to enhance task performance and its implementation. It includes pre enablement phase, enablement phase and post enablement phase.
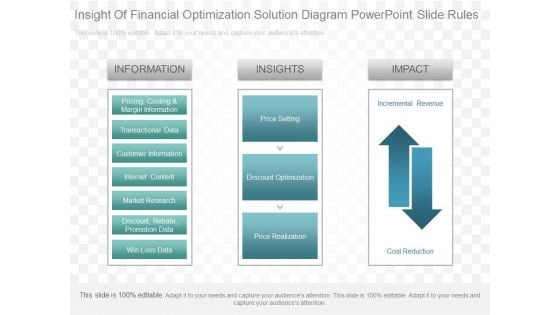
Insight Of Financial Optimization Solution Diagram Powerpoint Slide Rules
This is a insight of financial optimization solution diagram powerpoint slide rules. This is a three stage process. The stages in this process are information, pricing, costing and margin information, transactional data, customer information, internet content, market research, discount, rebate, promotion data, win loss data, insights, price setting, discount optimization, price realization, impact, incremental revenue, cost reduction.
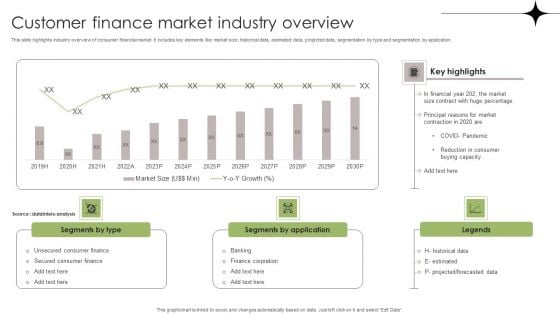
Customer Finance Market Industry Overview Clipart PDF
This slide highlights industry overview of consumer financial market. It includes key elements like market size, historical data, estimated data, projected data, segmentation by type and segmentation by application. Showcasing this set of slides titled Customer Finance Market Industry Overview Clipart PDF. The topics addressed in these templates are Consumer Finance, Historical Data, Pandemic. All the content presented in this PPT design is completely editable. Download it and make adjustments in color, background, font etc. as per your unique business setting.
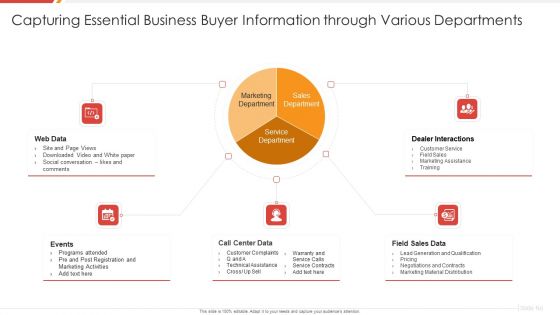
Enhancing B2B Demand Creation And Sales Growth Capturing Essential Business Buyer Information Demonstration PDF
Deliver an awe inspiring pitch with this creative enhancing b2b demand creation and sales growth capturing essential business buyer information demonstration pdf bundle. Topics like web data, events, call center data, field sales data, dealer interactions can be discussed with this completely editable template. It is available for immediate download depending on the needs and requirements of the user.

Laptop With Gears Software Testing Ppt PowerPoint Presentation Infographic Template Sample
This is a laptop with gears software testing ppt powerpoint presentation infographic template sample. This is a two stage process. The stages in this process are metrics icon, kpis icon, statistics icon.
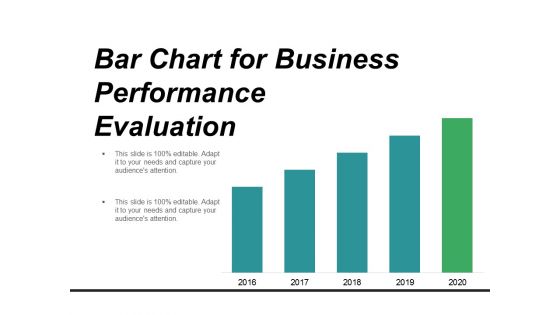
Bar Chart For Business Performance Evaluation Ppt PowerPoint Presentation Infographics Professional
This is a bar chart for business performance evaluation ppt powerpoint presentation infographics professional. This is a five stage process. The stages in this process are metrics icon, kpis icon, statistics icon.
Human Respiratory System Vector With Text Holders Ppt PowerPoint Presentation Gallery Ideas
This is a human respiratory system vector with text holders ppt powerpoint presentation gallery ideas. This is a three stage process. The stages in this process are lung icon, pulmonary vein icon, respiratory organ icon.
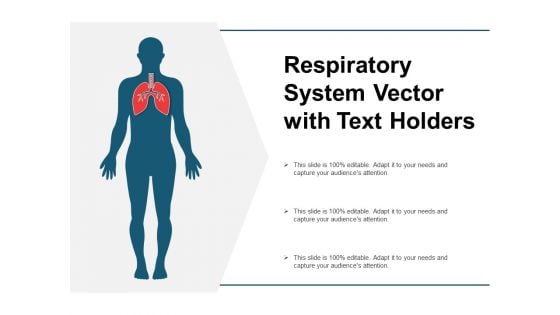
Respiratory System Vector With Text Holders Ppt PowerPoint Presentation Show Design Ideas
This is a respiratory system vector with text holders ppt powerpoint presentation show design ideas. This is a three stage process. The stages in this process are lung icon, pulmonary vein icon, respiratory organ icon.
Acceptance Or Rejection Signs With Text Holders Ppt Powerpoint Presentation Infographics Structure
This is a acceptance or rejection signs with text holders ppt powerpoint presentation infographics structure. This is a two stage process. The stages in this process are correct incorrect icon, dos and do not icon, right and wrong icon.
Correct And Incorrect Signs With Text Holders Ppt Powerpoint Presentation Professional Backgrounds
This is a correct and incorrect signs with text holders ppt powerpoint presentation professional backgrounds. This is a two stage process. The stages in this process are correct incorrect icon, dos and do not icon, right and wrong icon.

Right And Wrong Signs With Text Holders Ppt Powerpoint Presentation File Background Designs
This is a right and wrong signs with text holders ppt powerpoint presentation file background designs. This is a two stage process. The stages in this process are correct incorrect icon, dos and do not icon, right and wrong icon.
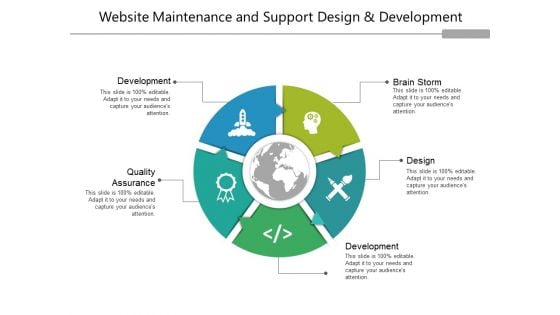
Website Maintenance And Support Design And Development Ppt PowerPoint Presentation Inspiration Outfit
This is a website maintenance and support design and development ppt powerpoint presentation inspiration outfit. This is a five stage process. The stages in this process are metrics icon, kpis icon, statistics icon.
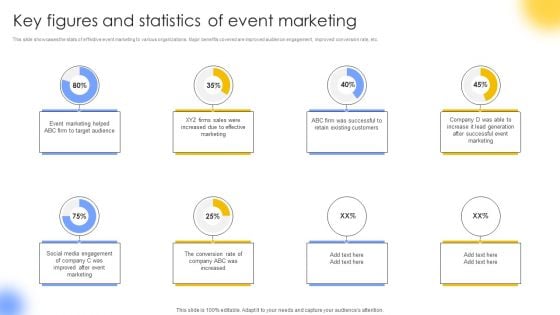
Key Figures And Statistics Of Event Marketing Portrait PDF
This slide showcases the stats of effective event marketing to various organizations. Major benefits covered are improved audience engagement, improved conversion rate, etc. If you are looking for a format to display your unique thoughts, then the professionally designed Key Figures And Statistics Of Event Marketing Portrait PDF is the one for you. You can use it as a Google Slides template or a PowerPoint template. Incorporate impressive visuals, symbols, images, and other charts. Modify or reorganize the text boxes as you desire. Experiment with shade schemes and font pairings. Alter, share or cooperate with other people on your work. Download Key Figures And Statistics Of Event Marketing Portrait PDF and find out how to give a successful presentation. Present a perfect display to your team and make your presentation unforgettable.
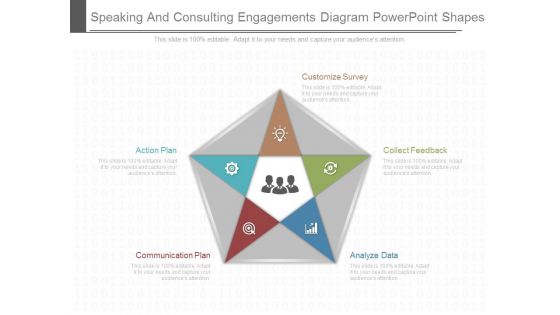
Speaking And Consulting Engagements Diagram Powerpoint Shapes
This is a speaking and consulting engagements diagram powerpoint shapes. This is a five stage process. The stages in this process are customize survey, action plan, collect feedback, communication plan, analyze data.
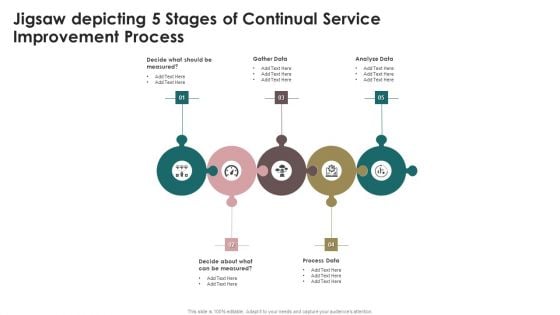
Jigsaw Depicting 5 Stages Of Continual Service Improvement Process Elements PDF
Presenting Jigsaw Depicting 5 Stages Of Continual Service Improvement Process Elements PDF to dispense important information. This template comprises five stages. It also presents valuable insights into the topics including Gather Data, Analyze Data, Process Data. This is a completely customizable PowerPoint theme that can be put to use immediately. So, download it and address the topic impactfully.
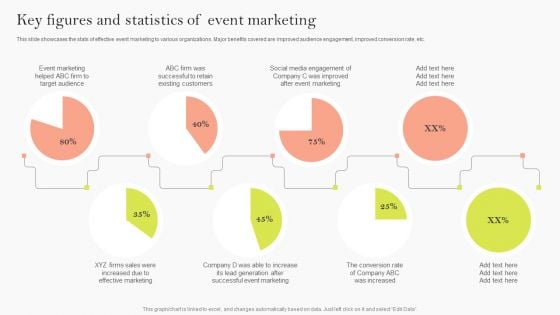
Key Figures And Statistics Of Event Marketing Ppt Backgrounds PDF
This slide showcases the stats of effective event marketing to various organizations. Major benefits covered are improved audience engagement, improved conversion rate, etc. Are you in need of a template that can accommodate all of your creative concepts This one is crafted professionally and can be altered to fit any style. Use it with Google Slides or PowerPoint. Include striking photographs, symbols, depictions, and other visuals. Fill, move around, or remove text boxes as desired. Test out color palettes and font mixtures. Edit and save your work, or work with colleagues. Download Key Figures And Statistics Of Event Marketing Ppt Backgrounds PDF and observe how to make your presentation outstanding. Give an impeccable presentation to your group and make your presentation unforgettable.
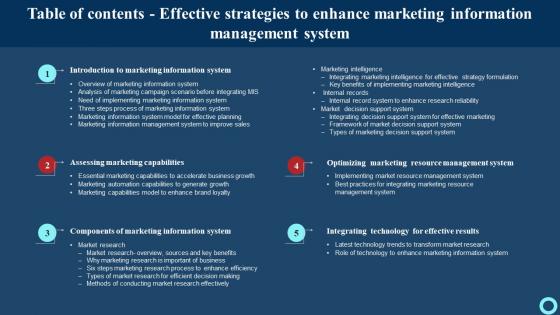
Table Of Contents Effective Strategies To Enhance Marketing Information Management System Pictures Pdf
Retrieve professionally designed Table Of Contents Effective Strategies To Enhance Marketing Information Management System Pictures Pdf to effectively convey your message and captivate your listeners. Save time by selecting pre-made slideshows that are appropriate for various topics, from business to educational purposes. These themes come in many different styles, from creative to corporate, and all of them are easily adjustable and can be edited quickly. Access them as PowerPoint templates or as Google Slides themes. You do not have to go on a hunt for the perfect presentation because Slidegeeks got you covered from everywhere. Our Table Of Contents Effective Strategies To Enhance Marketing Information Management System Pictures Pdf are topically designed to provide an attractive backdrop to any subject. Use them to look like a presentation pro.
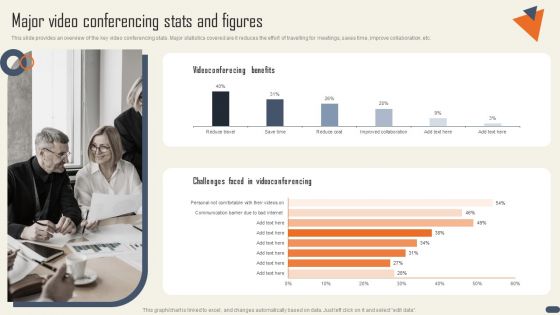
Networking Events Major Video Conferencing Stats And Figures Summary PDF
This slide provides an overview of the key video conferencing stats. Major statistics covered are it reduces the effort of travelling for meetings, saves time, improve collaboration, etc. The best PPT templates are a great way to save time, energy, and resources. Slidegeeks have 100 percent editable powerpoint slides making them incredibly versatile. With these quality presentation templates, you can create a captivating and memorable presentation by combining visually appealing slides and effectively communicating your message. Download Networking Events Major Video Conferencing Stats And Figures Summary PDF from Slidegeeks and deliver a wonderful presentation.
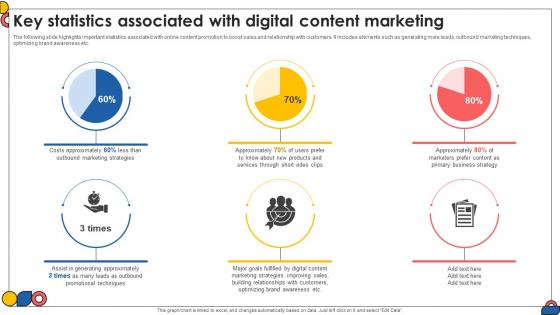
Key Statistics Associated With Digital Content Marketing Comprehensive Guide To Implement Strategy SS V
The following slide highlights important statistics associated with online content promotion to boost sales and relationship with customers. It includes elements such as generating more leads, outbound marketing techniques, optimizing brand awareness etc. Explore a selection of the finest Key Statistics Associated With Digital Content Marketing Comprehensive Guide To Implement Strategy SS V here. With a plethora of professionally designed and pre-made slide templates, you can quickly and easily find the right one for your upcoming presentation. You can use our Key Statistics Associated With Digital Content Marketing Comprehensive Guide To Implement Strategy SS V to effectively convey your message to a wider audience. Slidegeeks has done a lot of research before preparing these presentation templates. The content can be personalized and the slides are highly editable. Grab templates today from Slidegeeks. The following slide highlights important statistics associated with online content promotion to boost sales and relationship with customers. It includes elements such as generating more leads, outbound marketing techniques, optimizing brand awareness etc.
Business Analytics Dashboard Diagram
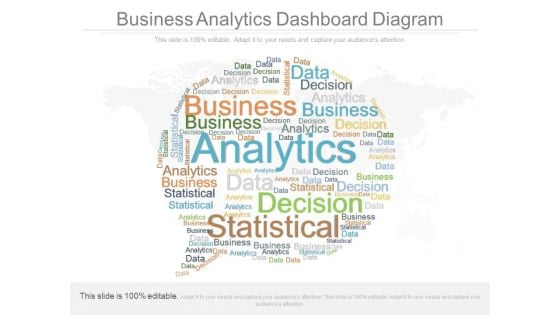
This is a business analytics dashboard diagram. This is a one stage process. The stages in this process are analytics, decision, data, business, statistics.
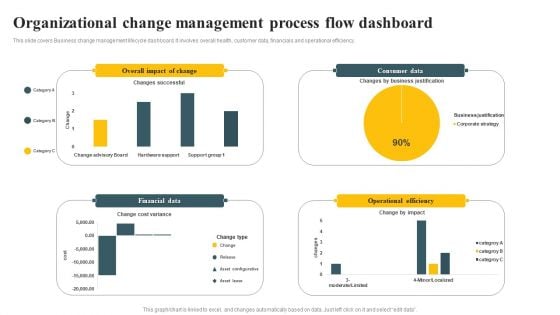
Organizational Change Management Process Flow Dashboard Ppt PowerPoint Presentation Diagram PDF
This slide covers Business change management lifecycle dashboard. It involves overall health, customer data, financials and operational efficiency. Pitch your topic with ease and precision using this Organizational Change Management Process Flow Dashboard Ppt PowerPoint Presentation Diagram PDF. This layout presents information on Financial Data, Operational Efficiency, Consumer Data. It is also available for immediate download and adjustment. So, changes can be made in the color, design, graphics or any other component to create a unique layout.
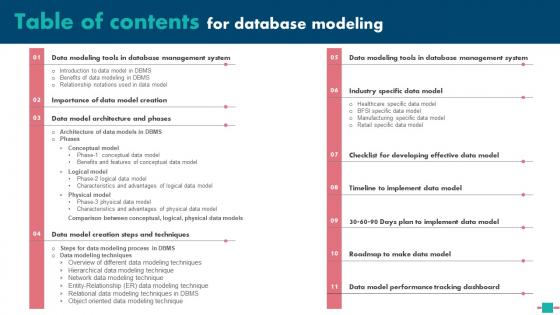
Table Of Contents For Database Modeling Themes Pdf
The Table Of Contents For Database Modeling Themes Pdf is a compilation of the most recent design trends as a series of slides. It is suitable for any subject or industry presentation, containing attractive visuals and photo spots for businesses to clearly express their messages. This template contains a variety of slides for the user to input data, such as structures to contrast two elements, bullet points, and slides for written information. Slidegeeks is prepared to create an impression. Our Table Of Contents For Database Modeling Themes Pdf are topically designed to provide an attractive backdrop to any subject. Use them to look like a presentation pro.
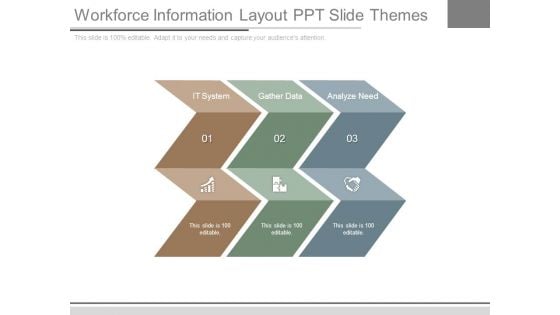
Workforce Information Layout Ppt Slide Themes
This is a workforce information layout ppt slide themes. This is a three stage process. The stages in this process are it system, gather data, analyze need.
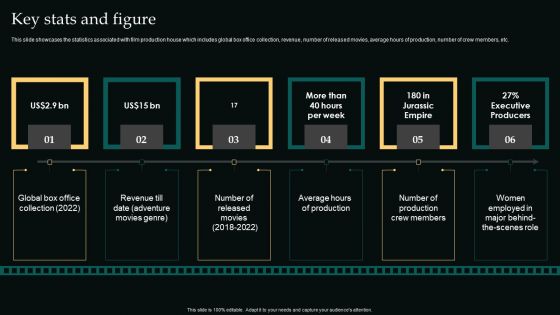
Key Stats And Figure Movie Editing Company Outline Ideas PDF
This slide showcases the statistics associated with film production house which includes global box office collection, revenue, number of released movies, average hours of production, number of crew members, etc. Retrieve professionally designed Key Stats And Figure Movie Editing Company Outline Ideas PDF to effectively convey your message and captivate your listeners. Save time by selecting pre-made slideshows that are appropriate for various topics, from business to educational purposes. These themes come in many different styles, from creative to corporate, and all of them are easily adjustable and can be edited quickly. Access them as PowerPoint templates or as Google Slides themes. You donot have to go on a hunt for the perfect presentation because Slidegeeks got you covered from everywhere.
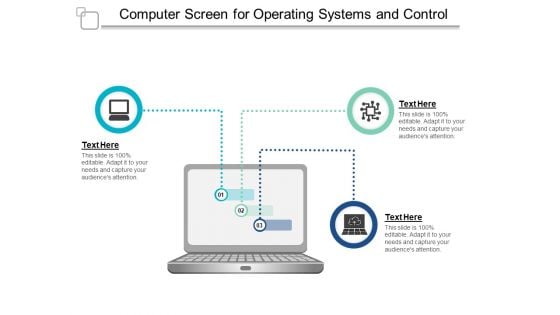
Computer Screen For Operating Systems And Control Ppt PowerPoint Presentation Show Files
This is a computer screen for operating systems and control ppt powerpoint presentation show files. This is a three stage process. The stages in this process are computer icon, desktop icon, laptop screen icon.
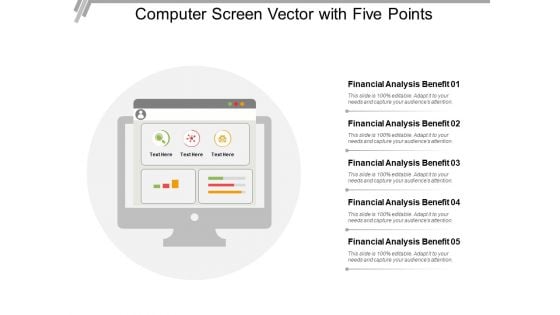
Computer Screen Vector With Five Points Ppt PowerPoint Presentation Infographics Guidelines
This is a computer screen vector with five points ppt powerpoint presentation infographics guidelines. This is a five stage process. The stages in this process are computer icon, desktop icon, laptop screen icon.

Computer Screen With Rocket For Startup Planning Ppt PowerPoint Presentation Inspiration Tips
This is a computer screen with rocket for startup planning ppt powerpoint presentation inspiration tips. This is a five stage process. The stages in this process are computer icon, desktop icon, laptop screen icon.
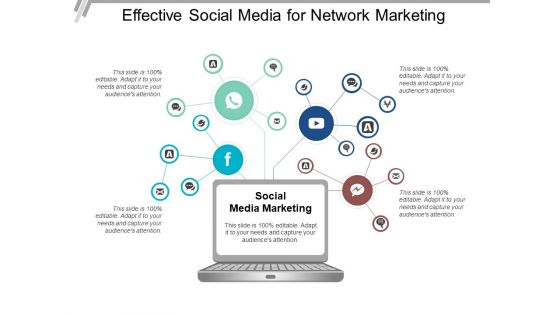
Effective Social Media For Network Marketing Ppt PowerPoint Presentation Outline
This is a effective social media for network marketing ppt powerpoint presentation outline. This is a four stage process. The stages in this process are computer icon, desktop icon, laptop screen icon.
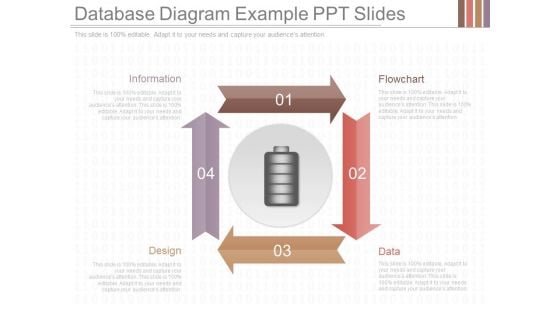
Database Diagram Example Ppt Slides
This is a database diagram example ppt slides. This is a four stage process. The stages in this process are information, flowchart, data, design.
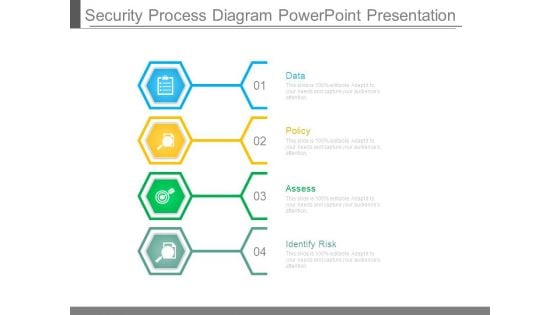
Security Process Diagram Powerpoint Presentation
This is a security process diagram powerpoint presentation. This is a four stage process. The stages in this process are data, policy, assess, identify risk.
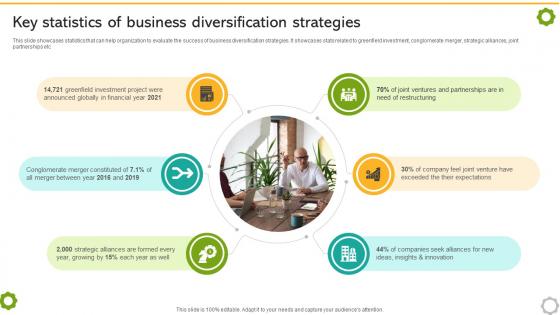
Related And Unrelated Business Key Statistics Of Business Diversification Strategies Strategy SS V
This slide showcases statistics that can help organization to evaluate the success of business diversification strategies. It showcases stats related to greenfield investment, conglomerate merger, strategic alliances, joint partnerships etc. Retrieve professionally designed Related And Unrelated Business Key Statistics Of Business Diversification Strategies Strategy SS V to effectively convey your message and captivate your listeners. Save time by selecting pre-made slideshows that are appropriate for various topics, from business to educational purposes. These themes come in many different styles, from creative to corporate, and all of them are easily adjustable and can be edited quickly. Access them as PowerPoint templates or as Google Slides themes. You do not have to go on a hunt for the perfect presentation because Slidegeeks got you covered from everywhere. This slide showcases statistics that can help organization to evaluate the success of business diversification strategies. It showcases stats related to greenfield investment, conglomerate merger, strategic alliances, joint partnerships etc.
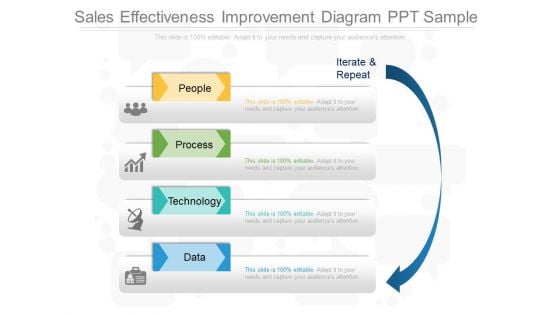
Sales Effectiveness Improvement Diagram Ppt Sample
This is a sales effectiveness improvement diagram ppt sample. This is a four stage process. The stages in this process are people, process, technology, data, iterate and repeat.
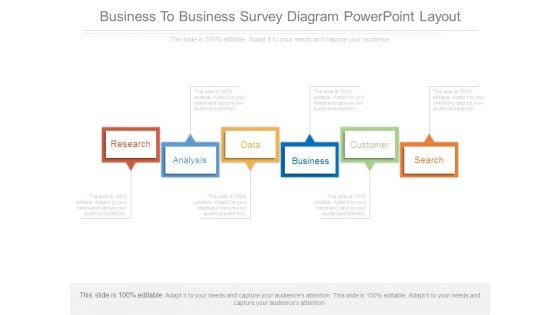
Business To Business Survey Diagram Powerpoint Layout
This is a Business To Business Survey Diagram Powerpoint Layout. This is a six stage process. The stages in this process are research, analysis, data, business, customer, search.
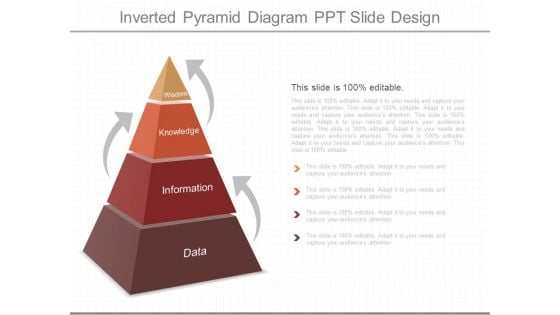
Inverted Pyramid Diagram Ppt Slide Design
This is a inverted pyramid diagram ppt slide design. This is a four stage process. The stages in this process are wisdom, knowledge, information, data.
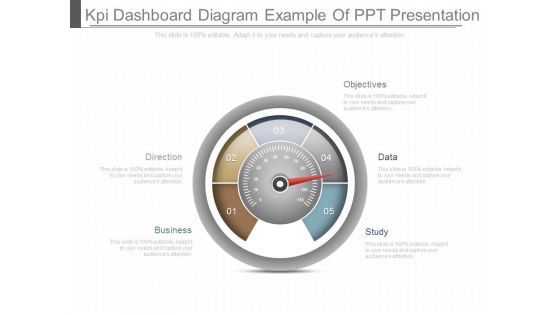
Kpi Dashboard Diagram Example Of Ppt Presentation
This is a kpi dashboard diagram example of ppt presentation. This is a five stage process. The stages in this process are business, direction, objectives, data, study.
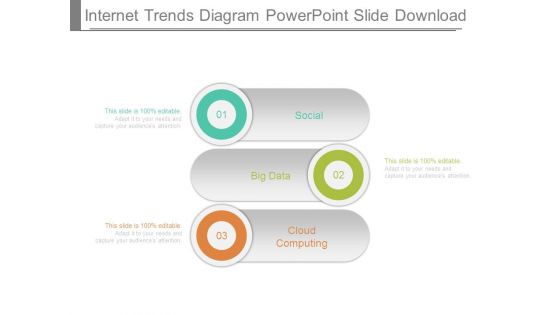
Internet Trends Diagram Powerpoint Slide Download
This is a internet trends diagram powerpoint slide download. This is a three stage process. The stages in this process are social, big data, cloud computing.
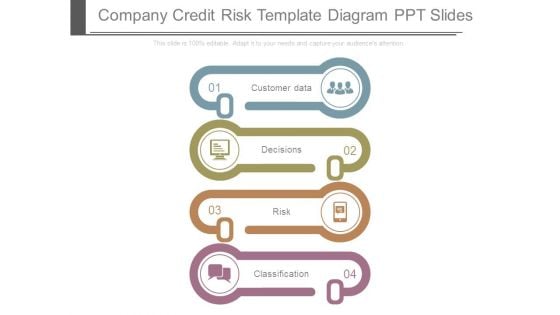
Company Credit Risk Template Diagram Ppt Slides
This is a company credit risk template diagram ppt slides. This is a four stage process. The stages in this process are customer data, decisions, risk, classification.
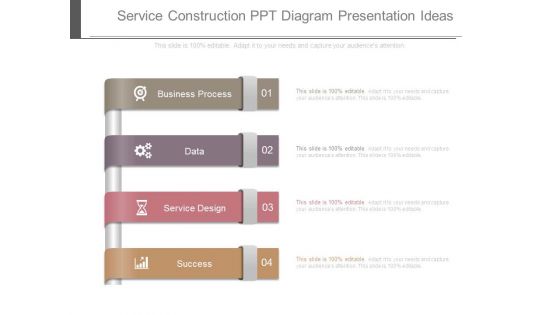
Service Construction Ppt Diagram Presentation Ideas
This is a service construction ppt diagram presentation ideas. This is a four stage process. The stages in this process are business process, data, service design, success.
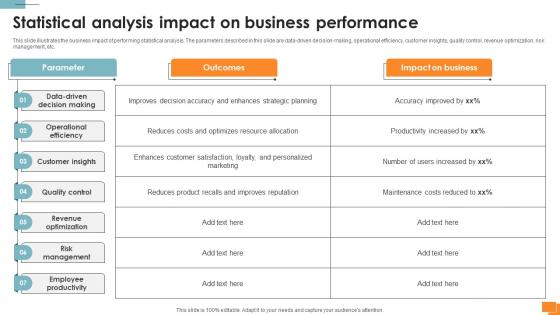
Statistical Tools For Evidence Statistical Analysis Impact On Business Performance
This slide illustrates the business impact of performing statistical analysis. The parameters described in this slide are data-driven decision-making, operational efficiency, customer insights, quality control, revenue optimization, risk management, etc. Do you know about Slidesgeeks Statistical Tools For Evidence Statistical Analysis Impact On Business Performance These are perfect for delivering any kind od presentation. Using it, create PowerPoint presentations that communicate your ideas and engage audiences. Save time and effort by using our pre-designed presentation templates that are perfect for a wide range of topic. Our vast selection of designs covers a range of styles, from creative to business, and are all highly customizable and easy to edit. Download as a PowerPoint template or use them as Google Slides themes. This slide illustrates the business impact of performing statistical analysis. The parameters described in this slide are data-driven decision-making, operational efficiency, customer insights, quality control, revenue optimization, risk management, etc.
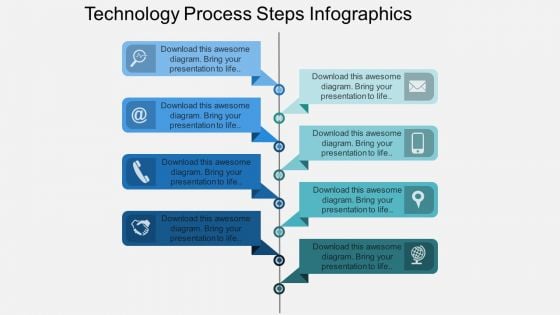
Technology Process Steps Infographics Powerpoint Template
Communicate with your group through this professional slide. It contains graphics of tags with icons. This PowerPoint template is suitable for topics like technology and communication.
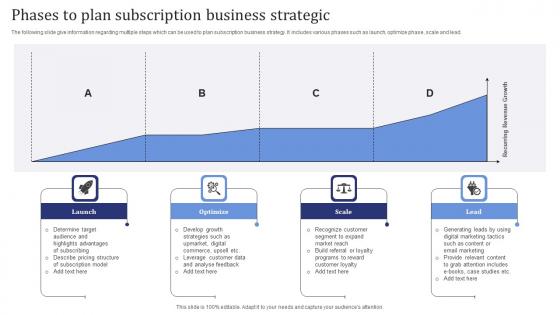
Phases To Plan Subscription Business Strategic Themes Pdf
The following slide give information regarding multiple steps which can be used to plan subscription business strategy. It includes various phases such as launch, optimize phase, scale and lead. Showcasing this set of slides titled Phases To Plan Subscription Business Strategic Themes Pdf. The topics addressed in these templates are Launch, Optimize Phase, Scale And Lead. All the content presented in this PPT design is completely editable. Download it and make adjustments in color, background, font etc. as per your unique business setting. The following slide give information regarding multiple steps which can be used to plan subscription business strategy. It includes various phases such as launch, optimize phase, scale and lead.
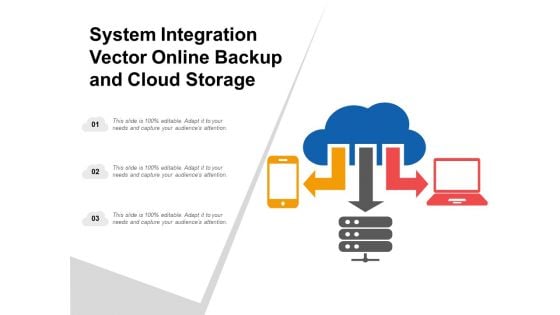
System Integration Vector Online Backup And Cloud Storage Ppt Powerpoint Presentation Professional Pictures
This is a system integration vector online backup and cloud storage ppt powerpoint presentation professional pictures. This is a three stage process. The stages in this process are combination icon, incorporation icon, integration icon.

Robot With Bulb For Artificial Intelligence Ppt PowerPoint Presentation Show Backgrounds
This is a robot with bulb for artificial intelligence ppt powerpoint presentation show backgrounds. This is a one stage process. The stages in this process are machine learning icon, ai icon, artificial intelligence icon.

Robot With Right And Wrong Symbol Ppt PowerPoint Presentation Inspiration Show
This is a robot with right and wrong symbol ppt powerpoint presentation inspiration show. This is a one stage process. The stages in this process are machine learning icon, ai icon, artificial intelligence icon.
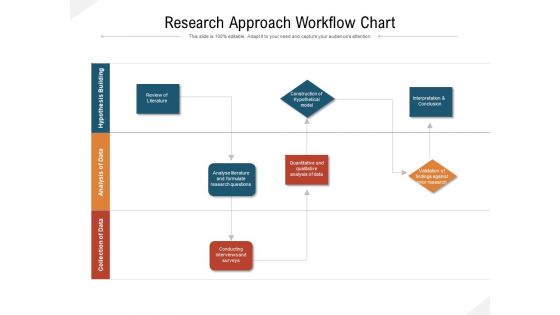
Research Approach Workflow Chart Ppt PowerPoint Presentation Gallery Vector PDF
Presenting research approach workflow chart ppt powerpoint presentation gallery vector pdf to dispense important information. This template comprises three stages. It also presents valuable insights into the topics including collection of data, analysis of data, hypothesis building. This is a completely customizable PowerPoint theme that can be put to use immediately. So, download it and address the topic impactfully.
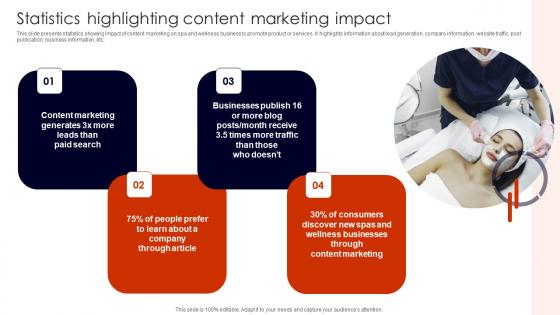
Statistics Highlighting Content Building Spa Business Brand Presence Marketing Diagrams Pdf
This slide presents statistics showing impact of content marketing on spa and wellness business to promote product or services. It highlights information about lead generation, company information, website traffic, post publication, business information, etc. Want to ace your presentation in front of a live audience Our Statistics Highlighting Content Building Spa Business Brand Presence Marketing Diagrams Pdf can help you do that by engaging all the users towards you. Slidegeeks experts have put their efforts and expertise into creating these impeccable powerpoint presentations so that you can communicate your ideas clearly. Moreover, all the templates are customizable, and easy to edit and downloadable. Use these for both personal and commercial use. This slide presents statistics showing impact of content marketing on spa and wellness business to promote product or services. It highlights information about lead generation, company information, website traffic, post publication, business information, etc.
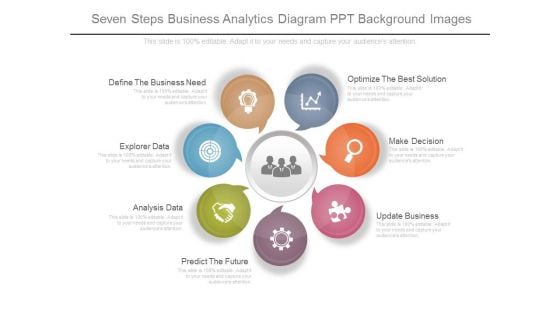
Seven Steps Business Analytics Diagram Ppt Background Images
This is a seven steps business analytics diagram ppt background images. This is a seven stage process. The stages in this process are optimize the best solution, make decision, update business, predict the future, analysis data, explorer data, define the business need.
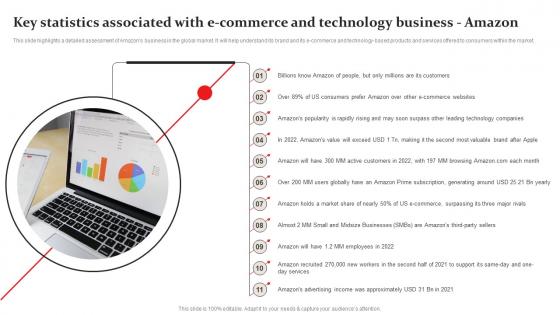
Key Statistics Associated With E Commerce Amazon Business Plan Go To Market Strategy Themes Pdf
This slide highlights a detailed assessment of Amazons business in the global market. It will help understand its brand and its e commerce and technology based products and services offered to consumers within the market. Retrieve professionally designed Key Statistics Associated With E Commerce Amazon Business Plan Go To Market Strategy Themes Pdf to effectively convey your message and captivate your listeners. Save time by selecting pre made slideshows that are appropriate for various topics, from business to educational purposes. These themes come in many different styles, from creative to corporate, and all of them are easily adjustable and can be edited quickly. Access them as PowerPoint templates or as Google Slides themes. You do not have to go on a hunt for the perfect presentation because Slidegeeks got you covered from everywhere. This slide highlights a detailed assessment of Amazons business in the global market. It will help understand its brand and its e commerce and technology based products and services offered to consumers within the market.
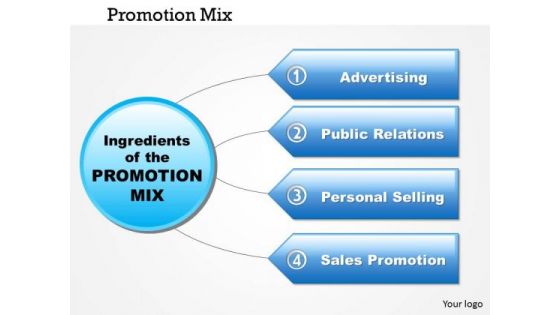
Business Framework Promotion Mix PowerPoint Presentation
This innovative diagram has been designed to display project management data. Use this diagram in business and marketing presentations. This diagram will enhance the quality of your presentations.
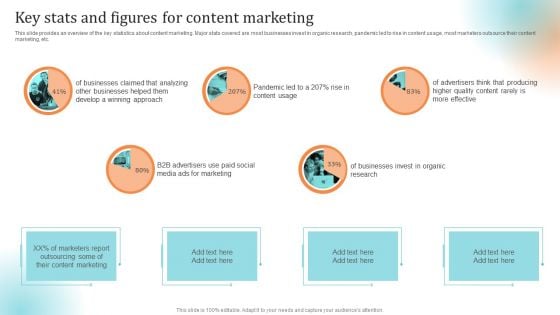
Content Advertising Campaign Key Stats And Figures For Content Marketing Summary PDF
This slide provides an overview of the key statistics about content marketing. Major stats covered are most businesses invest in organic research, pandemic led to rise in content usage, most marketers outsource their content marketing, etc. Want to ace your presentation in front of a live audience Our Content Advertising Campaign Key Stats And Figures For Content Marketing Summary PDF can help you do that by engaging all the users towards you. Slidegeeks experts have put their efforts and expertise into creating these impeccable powerpoint presentations so that you can communicate your ideas clearly. Moreover, all the templates are customizable, and easy to edit and downloadable. Use these for both personal and commercial use.
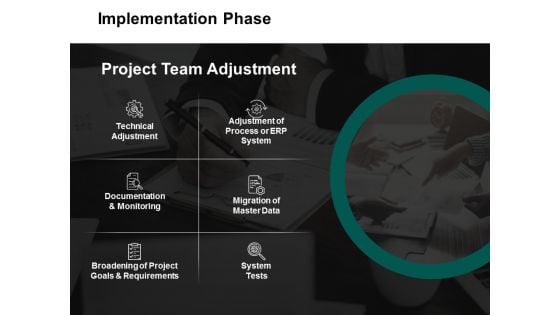
Implementation Phase Ppt PowerPoint Presentation Professional Styles
This is a implementation phase ppt powerpoint presentation professional styles. This is a six stage process. The stages in this process are technical adjustment, adjustment of process or erp system, migration of master data, documentation and monitoring, system tests.
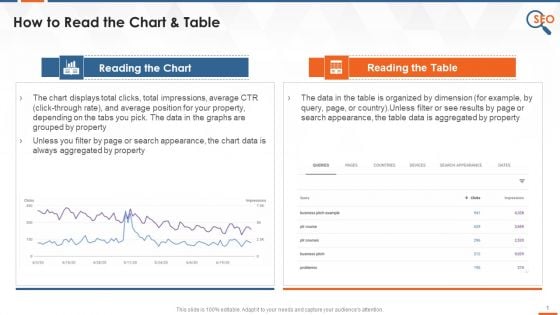
Reading Charts And Tables In Google Search Console Training Ppt
This slide covers how a user can read charts and tables in the google search console. It also depicts that Unless users filter by page or search appearance, the chart data, as well as table data, will always be aggregated by property.

 Home
Home