Data Icon
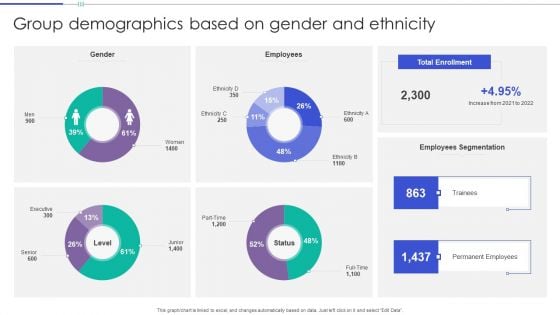
Group Demographics Based On Gender And Ethnicity Themes PDF
This graph or chart is linked to excel, and changes automatically based on data. Just left click on it and select Edit Data. Showcasing this set of slides titled Group Demographics Based On Gender And Ethnicity Themes PDF. The topics addressed in these templates are Gender, Employees, Total Enrollment. All the content presented in this PPT design is completely editable. Download it and make adjustments in color, background, font etc. as per your unique business setting.

Distinct Red Folder In Row Of Folders PowerPoint Templates Ppt Backgrounds For Slides 0113
We present our Distinct Red Folder In Row Of Folders PowerPoint Templates PPT Backgrounds For Slides 0113.Download our Computer PowerPoint Templates because Our PowerPoint Templates and Slides will let Your superior ideas hit the target always and everytime. Download our Business PowerPoint Templates because Our PowerPoint Templates and Slides will fulfill your every need. Use them and effectively satisfy the desires of your audience. Use our Finance PowerPoint Templates because Our PowerPoint Templates and Slides will let you Leave a lasting impression to your audiences. They possess an inherent longstanding recall factor. Download our Signs PowerPoint Templates because Our PowerPoint Templates and Slides will let you Hit the target. Go the full distance with ease and elan. Download and present our Security PowerPoint Templates because Our PowerPoint Templates and Slides are created by a hardworking bunch of busybees. Always flitting around with solutions gauranteed to please.Use these PowerPoint slides for presentations relating to Folder icons row with one selected, computer, business, finance, signs, security. The prominent colors used in the PowerPoint template are Yellow, White, Red. Professionals tell us our Distinct Red Folder In Row Of Folders PowerPoint Templates PPT Backgrounds For Slides 0113 look good visually. PowerPoint presentation experts tell us our business PowerPoint templates and PPT Slides will get their audience's attention. You can be sure our Distinct Red Folder In Row Of Folders PowerPoint Templates PPT Backgrounds For Slides 0113 provide great value for your money. Be assured of finding the best projection to highlight your words. PowerPoint presentation experts tell us our one PowerPoint templates and PPT Slides are designed to make your presentations professional. We assure you our Distinct Red Folder In Row Of Folders PowerPoint Templates PPT Backgrounds For Slides 0113 are aesthetically designed to attract attention. We guarantee that they will grab all the eyeballs you need. PowerPoint presentation experts tell us our one PowerPoint templates and PPT Slides will help them to explain complicated concepts. Our Distinct Red Folder In Row Of Folders PowerPoint Templates Ppt Backgrounds For Slides 0113 will ensure you get an A. You will be glad you tried us out.
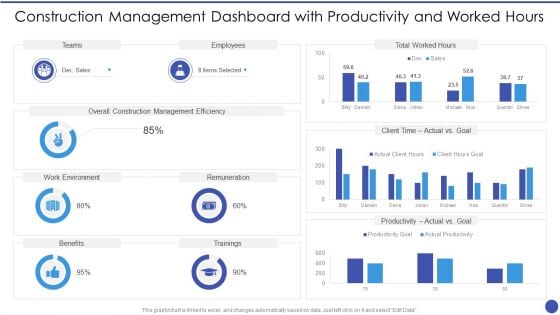
Construction Management Dashboard With Productivity And Worked Hours Themes PDF
This graph for chart is linked to excel, and changes automatically based on data. Just left click on it and select Edit Data. Deliver an awe inspiring pitch with this creative Construction Management Dashboard With Productivity And Worked Hours Themes PDF bundle. Topics like Teams, Employees, Overall Construction Management Efficiency, Remuneration, Work Environment can be discussed with this completely editable template. It is available for immediate download depending on the needs and requirements of the user.
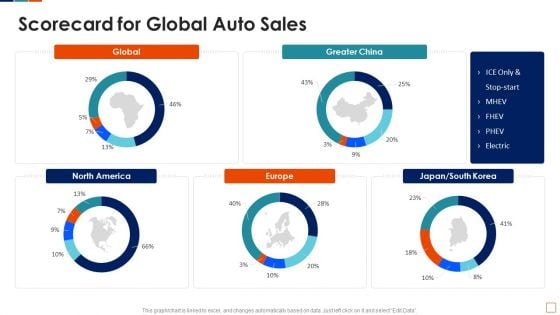
Automobile Sales Scorecard Scorecard For Global Auto Sales Themes PDF
This graph or chart is linked to excel, and changes automatically based on data. Just left click on it and select Edit Data. Deliver and pitch your topic in the best possible manner with this Automobile Sales Scorecard Scorecard For Global Auto Sales Themes PDF. Use them to share invaluable insights on Scorecard For Global, Auto Sales Global and impress your audience. This template can be altered and modified as per your expectations. So, grab it now.
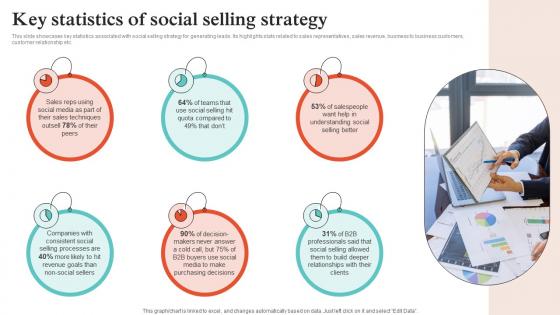
Virtual Sales Strategies Key Statistics Of Social Selling Strategy SS V
This slide showcases key statistics associated with social selling strategy for generating leads. Its highlights stats related to sales representatives, sales revenue, business to business customers, customer relationship etc. Retrieve professionally designed Virtual Sales Strategies Key Statistics Of Social Selling Strategy SS V to effectively convey your message and captivate your listeners. Save time by selecting pre-made slideshows that are appropriate for various topics, from business to educational purposes. These themes come in many different styles, from creative to corporate, and all of them are easily adjustable and can be edited quickly. Access them as PowerPoint templates or as Google Slides themes. You do not have to go on a hunt for the perfect presentation because Slidegeeks got you covered from everywhere. This slide showcases key statistics associated with social selling strategy for generating leads. Its highlights stats related to sales representatives, sales revenue, business to business customers, customer relationship etc.
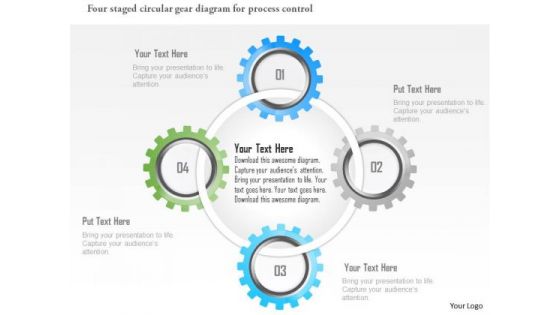
Business Diagram Four Staged Circular Gear Diagram For Process Control Presentation Template
This business slide depicts four staged circular gears diagram. This diagram can help by summarizing the key features of the data. Use this editable diagram for your business and management related presentations.
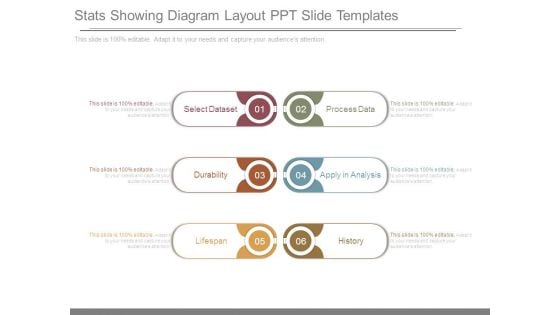
Stats Showing Diagram Layout Ppt Slide Templates
This is a stats showing diagram layout ppt slide templates. This is a six stage process. The stages in this process are select dataset, durability, lifespan, process data, apply in analysis, history.

Planned Statistics Assessment Template Ppt Diagrams
This is a planned statistics assessment template ppt diagrams. This is a eight stage process. The stages in this process are quality context, competitors, stakeholders and users, processes and data, resources, evaluation, tools and techniques, structure.
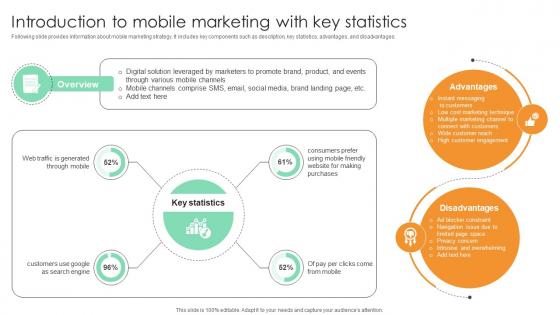
Introduction To Mobile Marketing With Key Statistics Comprehensive Guide For Marketing Technology
Following slide provides information about mobile marketing strategy. It includes key components such as description, key statistics, advantages, and disadvantages.Create an editable Introduction To Mobile Marketing With Key Statistics Comprehensive Guide For Marketing Technology that communicates your idea and engages your audience. Whether you are presenting a business or an educational presentation, pre-designed presentation templates help save time. v is highly customizable and very easy to edit, covering many different styles from creative to business presentations. Slidegeeks has creative team members who have crafted amazing templates. So, go and get them without any delay. Following slide provides information about mobile marketing strategy. It includes key components such as description, key statistics, advantages, and disadvantages.
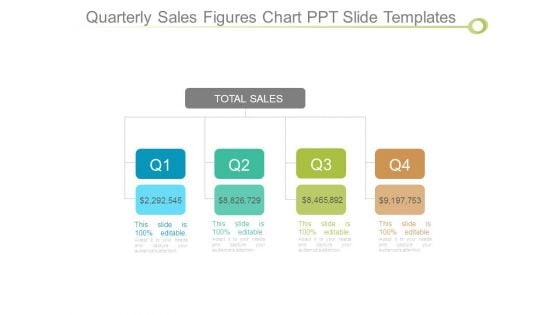
Quarterly Sales Figures Chart Ppt Slide Templates
This is a quarterly sales figures chart ppt slide templates. This is a four stage process. The stages in this process are total sales, business, management, marketing, success.
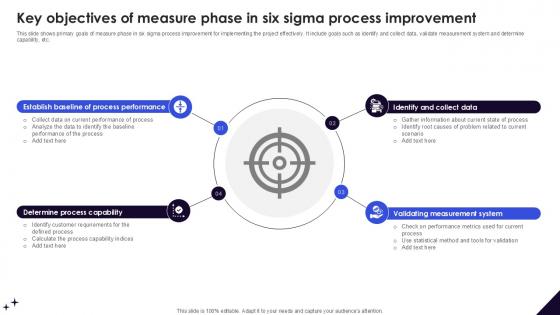
Key Objectives Of Measure Phase In DMAIC Methodology To Maintain PPT Template
This slide shows primary goals of measure phase in six sigma process improvement for implementing the project effectively. It include goals such as identify and collect data, validate measurement system and determine capability, etc. Formulating a presentation can take up a lot of effort and time, so the content and message should always be the primary focus. The visuals of the PowerPoint can enhance the presenters message, so our Key Objectives Of Measure Phase In DMAIC Methodology To Maintain PPT Template was created to help save time. Instead of worrying about the design, the presenter can concentrate on the message while our designers work on creating the ideal templates for whatever situation is needed. Slidegeeks has experts for everything from amazing designs to valuable content, we have put everything into Key Objectives Of Measure Phase In DMAIC Methodology To Maintain PPT Template This slide shows primary goals of measure phase in six sigma process improvement for implementing the project effectively. It include goals such as identify and collect data, validate measurement system and determine capability, etc.
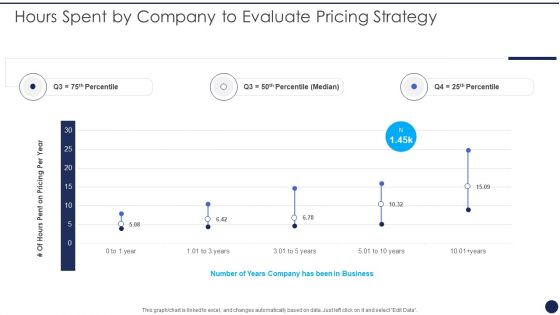
Hours Spent By Company To Evaluate Pricing Strategy Product Pricing Strategies Analysis Themes PDF
This graph or chart is linked to excel, and changes automatically based on data. Just left click on it and select Edit Data. Deliver and pitch your topic in the best possible manner with this Hours Spent By Company To Evaluate Pricing Strategy Product Pricing Strategies Analysis Themes PDF. Use them to share invaluable insights on Pricing Per Year, Number Years Business and impress your audience. This template can be altered and modified as per your expectations. So, grab it now.
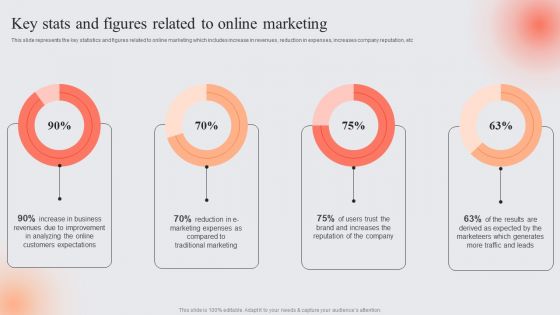
E Marketing Techniques To Boost Sales Key Stats And Figures Related To Online Marketing Designs PDF
This slide represents the key statistics and figures related to online marketing which includes increase in revenues, reduction in expenses, increases company reputation, etc Want to ace your presentation in front of a live audience Our E Marketing Techniques To Boost Sales Key Stats And Figures Related To Online Marketing Designs PDF can help you do that by engaging all the users towards you. Slidegeeks experts have put their efforts and expertise into creating these impeccable powerpoint presentations so that you can communicate your ideas clearly. Moreover, all the templates are customizable, and easy-to-edit and downloadable. Use these for both personal and commercial use.
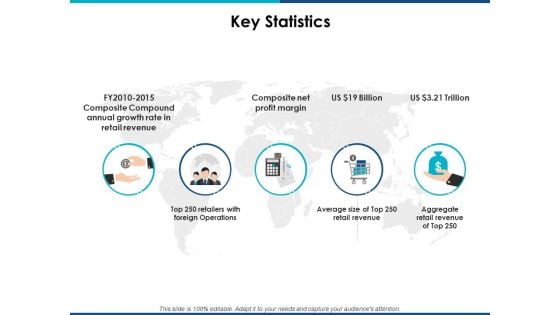
Key Statistics Management Ppt PowerPoint Presentation Professional Graphics Tutorials
This is a key statistics management ppt powerpoint presentation professional graphics tutorials. This is a five stage process. The stages in this process are strategy, marketing, business, management, icons.
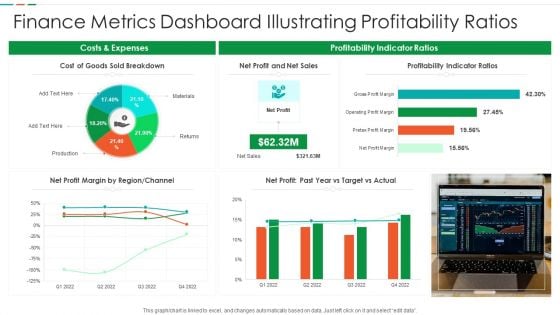
Finance Metrics Dashboard Illustrating Profitability Ratios Diagrams PDF
This graph or chart is linked to excel, and changes automatically based on data. Just left click on it and select edit data. Pitch your topic with ease and precision using this Finance Metrics Dashboard Illustrating Profitability Ratios Diagrams PDF. This layout presents information on Cost Goods Sold, Net Profit Net, Sales Profitability Indicator. It is also available for immediate download and adjustment. So, changes can be made in the color, design, graphics or any other component to create a unique layout.
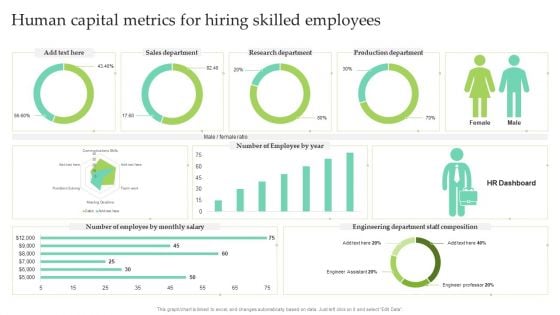
Human Capital Metrics For Hiring Skilled Employees Ppt Slides Themes PDF
This graph or chart is linked to excel, and changes automatically based on data. Just left click on it and select Edit Data. Showcasing this set of slides titled Human Capital Metrics For Hiring Skilled Employees Ppt Slides Themes PDF. The topics addressed in these templates are Sales Department, Research Department, Production Department. All the content presented in this PPT design is completely editable. Download it and make adjustments in color, background, font etc. as per your unique business setting.
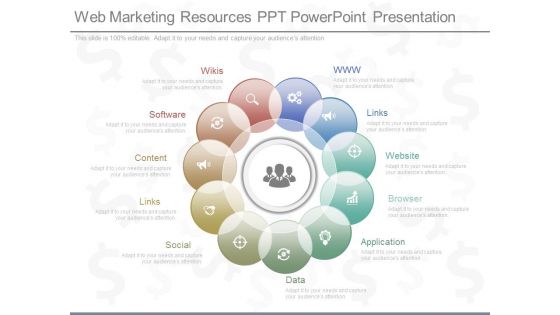
Web Marketing Resources Ppt Powerpoint Presentation
This is a web marketing resources ppt powerpoint presentation. This is a eleven stage process. The stages in this process are www, links, website, browser, application, data, social, links, content, software, wikis.
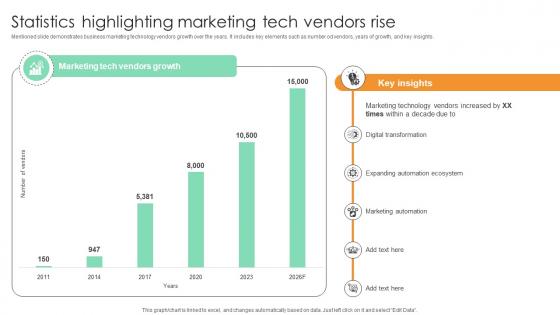
Statistics Highlighting Marketing Tech Vendors Rise Comprehensive Guide For Marketing Technology
Mentioned slide demonstrates business marketing technology vendors growth over the years. It includes key elements such as number od vendors, years of growth, and key insights. Want to ace your presentation in front of a live audience Our Statistics Highlighting Marketing Tech Vendors Rise Comprehensive Guide For Marketing Technology can help you do that by engaging all the users towards you. Slidegeeks experts have put their efforts and expertise into creating these impeccable powerpoint presentations so that you can communicate your ideas clearly. Moreover, all the templates are customizable, and easy-to-edit and downloadable. Use these for both personal and commercial use. Mentioned slide demonstrates business marketing technology vendors growth over the years. It includes key elements such as number od vendors, years of growth, and key insights.
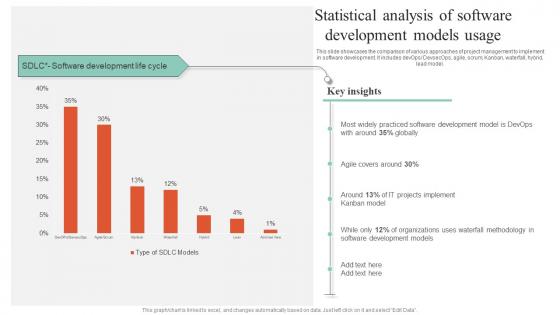
Executing Guide For Waterfall Statistical Analysis Of Software Development Models Portrait Pdf
This slide showcases the comparison of various approaches of project management to implement in software development. It includes devOps or DevsecOps, agile, scrum, Kanban, waterfall, hybrid, lead model. Find highly impressive Executing Guide For Waterfall Statistical Analysis Of Software Development Models Portrait Pdf on Slidegeeks to deliver a meaningful presentation. You can save an ample amount of time using these presentation templates. No need to worry to prepare everything from scratch because Slidegeeks experts have already done a huge research and work for you. You need to download Executing Guide For Waterfall Statistical Analysis Of Software Development Models Portrait Pdf for your upcoming presentation. All the presentation templates are 100 percent editable and you can change the color and personalize the content accordingly. Download now. This slide showcases the comparison of various approaches of project management to implement in software development. It includes devOps or DevsecOps, agile, scrum, Kanban, waterfall, hybrid, lead model.
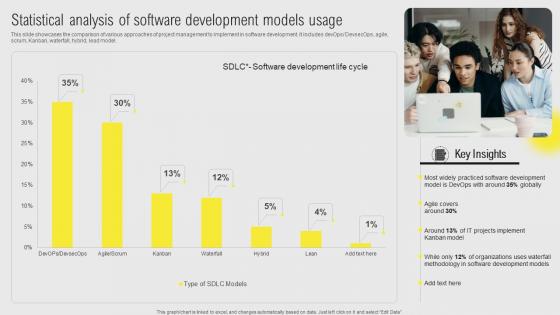
IT Projects Administration Through Waterfall Statistical Analysis Of Software Development Brochure Pdf
This slide showcases the comparison of various approaches of project management to implement in software development. It includes devOps or DevsecOps, agile, scrum, Kanban, waterfall, hybrid, lead model. Find highly impressive IT Projects Administration Through Waterfall Statistical Analysis Of Software Development Brochure Pdf on Slidegeeks to deliver a meaningful presentation. You can save an ample amount of time using these presentation templates. No need to worry to prepare everything from scratch because Slidegeeks experts have already done a huge research and work for you. You need to download IT Projects Administration Through Waterfall Statistical Analysis Of Software Development Brochure Pdf for your upcoming presentation. All the presentation templates are 100 percent editable and you can change the color and personalize the content accordingly. Download now. This slide showcases the comparison of various approaches of project management to implement in software development. It includes devOps or DevsecOps, agile, scrum, Kanban, waterfall, hybrid, lead model.
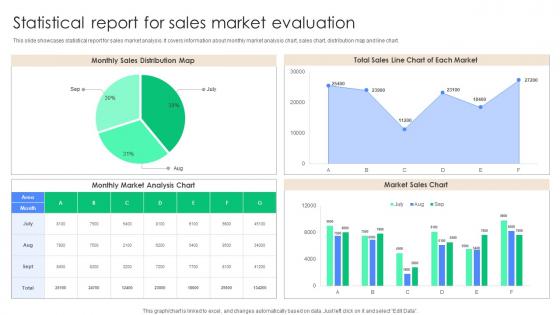
Statistical Report For Sales Market Evaluation Clipart Pdf
This slide showcases statistical report for sales market analysis. It covers information about monthly market analysis chart, sales chart, distribution map and line chart. Showcasing this set of slides titled Statistical Report For Sales Market Evaluation Clipart Pdf. The topics addressed in these templates are Monthly Market Analysis Chart, Market Sales Chart, Sales Chart Each Market. All the content presented in this PPT design is completely editable. Download it and make adjustments in color, background, font etc. as per your unique business setting. This slide showcases statistical report for sales market analysis. It covers information about monthly market analysis chart, sales chart, distribution map and line chart.
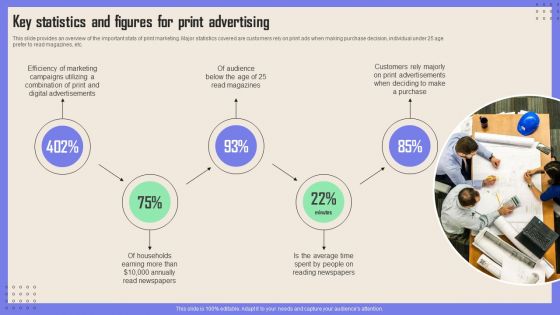
Print Advertising Key Statistics And Figures For Print Advertising Introduction PDF
This slide provides an overview of the important stats of print marketing. Major statistics covered are customers rely on print ads when making purchase decision, individual under 25 age prefer to read magazines, etc. If you are looking for a format to display your unique thoughts, then the professionally designed Print Advertising Key Statistics And Figures For Print Advertising Introduction PDF is the one for you. You can use it as a Google Slides template or a PowerPoint template. Incorporate impressive visuals, symbols, images, and other charts. Modify or reorganize the text boxes as you desire. Experiment with shade schemes and font pairings. Alter, share or cooperate with other people on your work. Download Print Advertising Key Statistics And Figures For Print Advertising Introduction PDF and find out how to give a successful presentation. Present a perfect display to your team and make your presentation unforgettable.
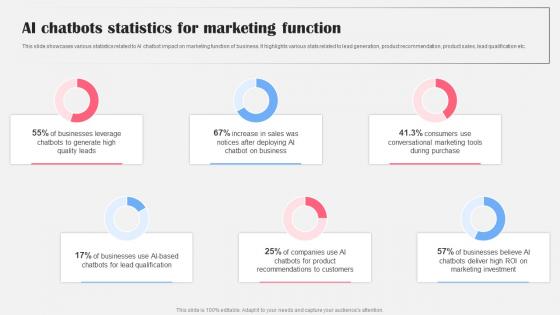
AI Chatbots Statistics For Marketing Function AI Bot Application For Various Industries Clipart Pdf
This slide showcases various statistics related to AI chatbot impact on marketing function of business. It highlights various stats related to lead generation, product recommendation, product sales, lead qualification etc. There are so many reasons you need a AI Chatbots Statistics For Marketing Function AI Bot Application For Various Industries Clipart Pdf. The first reason is you can not spend time making everything from scratch, Thus, Slidegeeks has made presentation templates for you too. You can easily download these templates from our website easily. This slide showcases various statistics related to AI chatbot impact on marketing function of business. It highlights various stats related to lead generation, product recommendation, product sales, lead qualification etc.
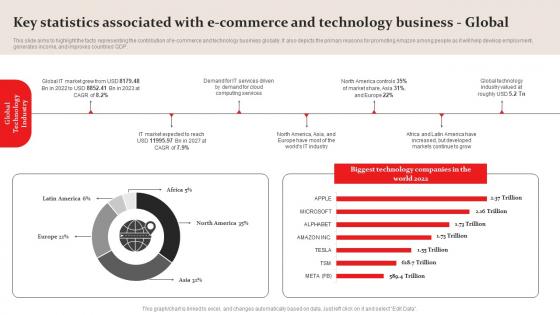
Amazon Business Plan Go To Market Strategy Key Statistics Associated With E Commerce Diagrams Pdf
This slide aims to highlight the facts representing the contribution of e commerce and technology business globally. It also depicts the primary reasons for promoting Amazon among people as it will help develop employment, generates income, and improves countries GDP. There are so many reasons you need a Amazon Business Plan Go To Market Strategy Key Statistics Associated With E Commerce Diagrams Pdf. The first reason is you can not spend time making everything from scratch, Thus, Slidegeeks has made presentation templates for you too. You can easily download these templates from our website easily. This slide aims to highlight the facts representing the contribution of e commerce and technology business globally. It also depicts the primary reasons for promoting Amazon among people as it will help develop employment, generates income, and improves countries GDP.
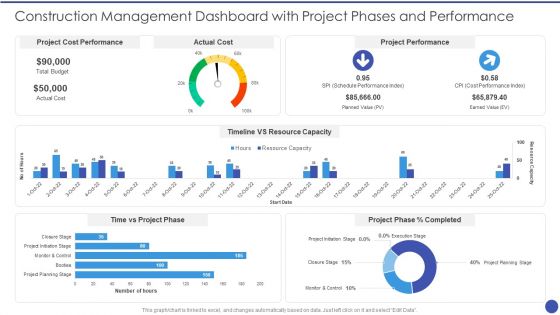
Construction Management Dashboard With Project Phases And Performance Inspiration PDF
This graph for chart is linked to excel, and changes automatically based on data. Just left click on it and select Edit Data. Deliver and pitch your topic in the best possible manner with this Construction Management Dashboard With Project Phases And Performance Inspiration PDF. Use them to share invaluable insights on Project Cost Performance, Actual Cost, Project Performance, Timeline VS Resource Capacity, Time vs Project Phase and impress your audience. This template can be altered and modified as per your expectations. So, grab it now.
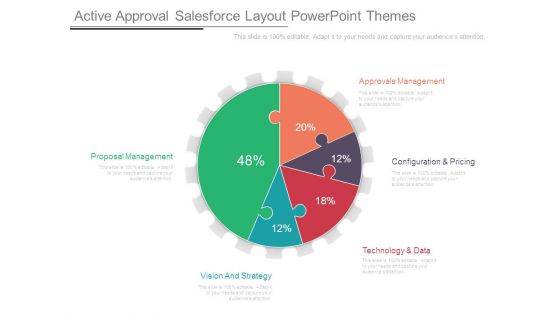
Active Approval Salesforce Layout Powerpoint Themes
This is a active approval salesforce layout powerpoint themes. This is a five stage process. The stages in this process are proposal management, vision and strategy, technology and data, configuration and pricing, approvals management.
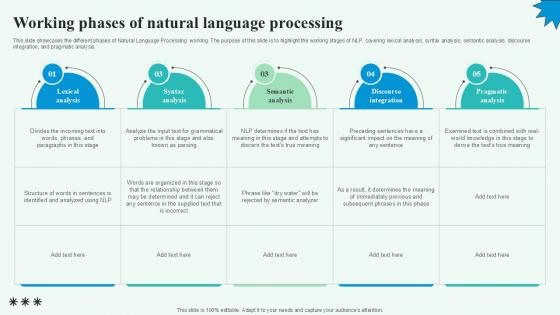
Working Phases Of Natural Language Automated Content Generation PPT PowerPoint
This slide showcases the different phases of Natural Language Processing working. The purpose of this slide is to highlight the working stages of NLP, covering lexical analysis, syntax analysis, semantic analysis, discourse integration, and pragmatic analysis. The Working Phases Of Natural Language Automated Content Generation PPT PowerPoint is a compilation of the most recent design trends as a series of slides. It is suitable for any subject or industry presentation, containing attractive visuals and photo spots for businesses to clearly express their messages. This template contains a variety of slides for the user to input data, such as structures to contrast two elements, bullet points, and slides for written information. Slidegeeks is prepared to create an impression. This slide showcases the different phases of Natural Language Processing working. The purpose of this slide is to highlight the working stages of NLP, covering lexical analysis, syntax analysis, semantic analysis, discourse integration, and pragmatic analysis.
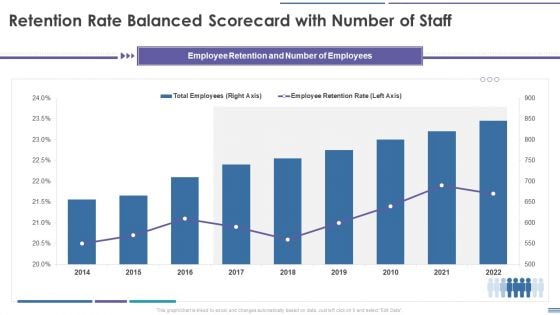
Staff Retention Balanced Scorecard Retention Rate Balanced Scorecard With Number Of Staff Diagrams PDF
This graph or chart is linked to excel, and changes automatically based on data. Just left click on it and select Edit Data. Deliver an awe inspiring pitch with this creative Staff Retention Balanced Scorecard Retention Rate Balanced Scorecard With Number Of Staff Diagrams PDF bundle. Topics like Total Employees, Employee Retention Rate, 2014 To 2022 can be discussed with this completely editable template. It is available for immediate download depending on the needs and requirements of the user.
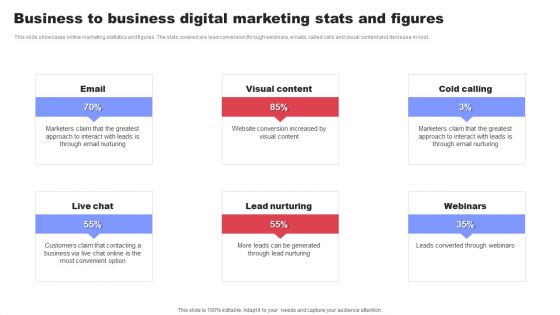
Business To Business Digital Marketing Stats And Figures Ppt Infographic Template Microsoft PDF
This slide showcases online marketing statistics and figures. The stats covered are lead conversion through webinars, emails, called calls and visual content and decrease in cost. Presenting Business To Business Digital Marketing Stats And Figures Ppt Infographic Template Microsoft PDF to dispense important information. This template comprises six stages. It also presents valuable insights into the topics including Live Chat, Lead Nurturing, Webinars, Cold Calling. This is a completely customizable PowerPoint theme that can be put to use immediately. So, download it and address the topic impactfully.
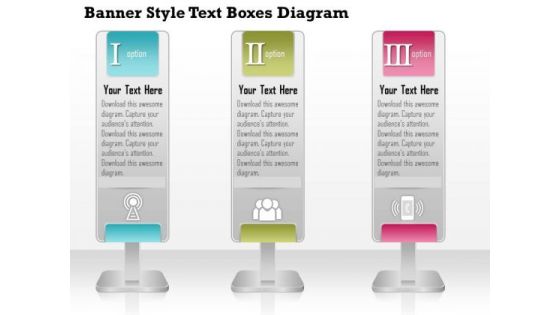
Business Diagram Banner Style Text Boxes Diagram PowerPoint Ppt Presentation
This diagram displays banner style text boxes. It contains three text boxes with icons.You may use this layout to display business process in an interesting, eye-catching manner.
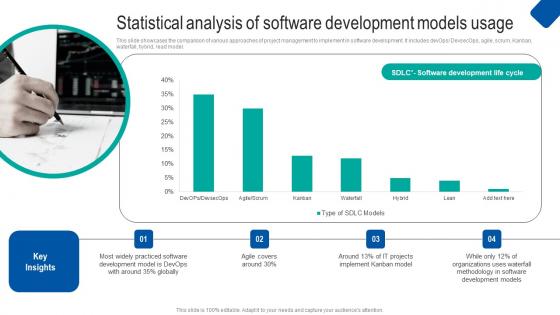
Statistical Analysis Of Software Waterfall Project Management Strategy Construction Industry Microsoft Pdf
This slide showcases the comparison of various approaches of project management to implement in software development. It includes devOps DevsecOps, agile, scrum, Kanban, waterfall, hybrid, lead model. Make sure to capture your audiences attention in your business displays with our gratis customizable Statistical Analysis Of Software Waterfall Project Management Strategy Construction Industry Microsoft Pdf. These are great for business strategies, office conferences, capital raising or task suggestions. If you desire to acquire more customers for your tech business and ensure they stay satisfied, create your own sales presentation with these plain slides. This slide showcases the comparison of various approaches of project management to implement in software development. It includes devOps DevsecOps, agile, scrum, Kanban, waterfall, hybrid, lead model.
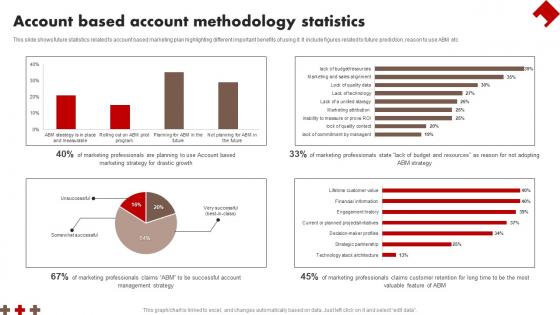
Account Based Account Methodology Statistics Demonstration Pdf
This slide shows future statistics related to account based marketing plan highlighting different important benefits of using it. It include figures related to future prediction, reason to use ABM etc Pitch your topic with ease and precision using this Account Based Account Methodology Statistics Demonstration Pdf This layout presents information on Account Based Account, Methodology Statistics It is also available for immediate download and adjustment. So, changes can be made in the color, design, graphics or any other component to create a unique layout. This slide shows future statistics related to account based marketing plan highlighting different important benefits of using it. It include figures related to future prediction, reason to use ABM etc
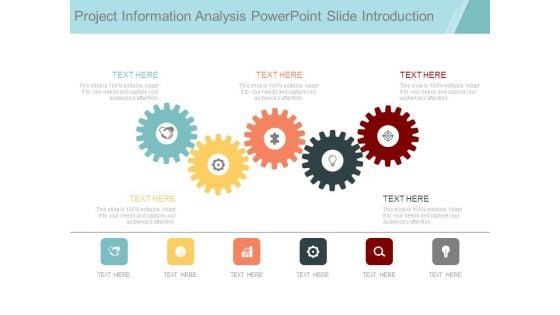
Project Information Analysis Powerpoint Slide Introduction
This is a project information analysis powerpoint slide introduction. This is a five stage process. The stages in this process are gears, business, icons, strategy, industrial, marketing.
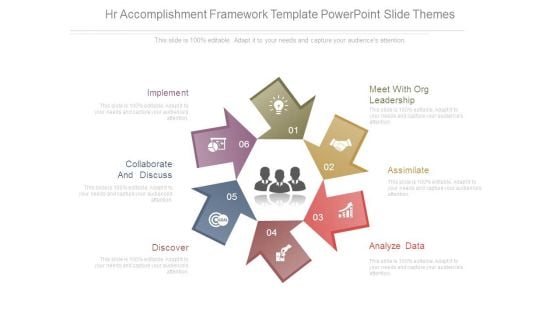
Hr Accomplishment Framework Template Powerpoint Slide Themes
This is a hr accomplishment framework template powerpoint slide themes. This is a six stage process. The stages in this process are meet with org leadership, assimilate, analyze data, implement, collaborate and discuss, discover.
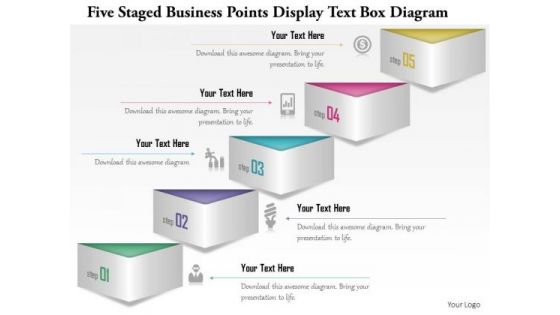
Business Diagram Five Staged Business Points Display Text Box Diagram Presentation Template
This Power Point template slide has been designed with graphic of five staged text box diagrams. This PPT slide can be used for displaying business data. Use this PPT slide for your business presentations and get good remarks.
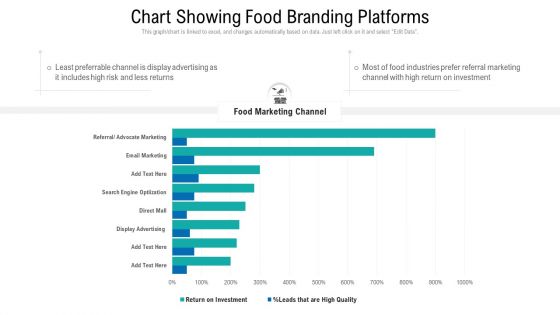
Chart Showing Food Branding Platforms Ppt Summary Gridlines PDF
This graph or chart is linked to excel, and changes automatically based on data. Just left click on it and select Edit Data. Showcasing this set of slides titled chart showing food branding platforms ppt summary gridlines pdf. The topics addressed in these templates are chart showing food branding platforms. All the content presented in this PPT design is completely editable. Download it and make adjustments in color, background, font etc. as per your unique business setting.
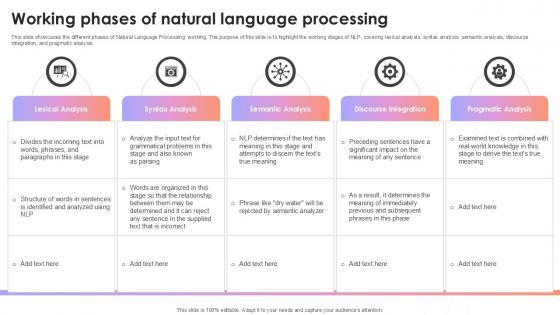
Working Phases Of Natural Language Processing AI Content Creation It Ppt Sample
This slide showcases the different phases of Natural Language Processing working. The purpose of this slide is to highlight the working stages of NLP, covering lexical analysis, syntax analysis, semantic analysis, discourse integration, and pragmatic analysis. The Working Phases Of Natural Language Processing AI Content Creation It Ppt Sample is a compilation of the most recent design trends as a series of slides. It is suitable for any subject or industry presentation, containing attractive visuals and photo spots for businesses to clearly express their messages. This template contains a variety of slides for the user to input data, such as structures to contrast two elements, bullet points, and slides for written information. Slidegeeks is prepared to create an impression. This slide showcases the different phases of Natural Language Processing working. The purpose of this slide is to highlight the working stages of NLP, covering lexical analysis, syntax analysis, semantic analysis, discourse integration, and pragmatic analysis.
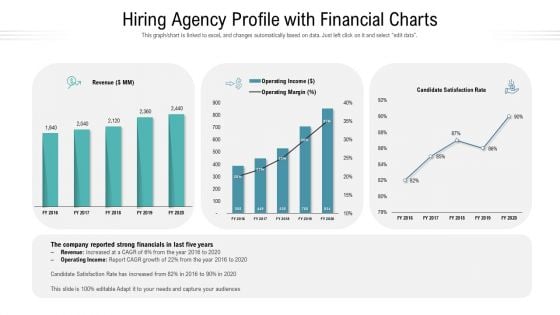
Hiring Agency Profile With Financial Charts Ppt Model Example PDF
This graph or chart is linked to excel, and changes automatically based on data. Just left click on it and select edit data. Pitch your topic with ease and precision using this hiring agency profile with financial charts ppt model example pdf. This layout presents information on revenue, operating income, operating margin, satisfaction rate. It is also available for immediate download and adjustment. So, changes can be made in the color, design, graphics or any other component to create a unique layout.
Statistical Modeling Project Ppt Powerpoint Presentation Complete Deck With Slides
This Statistical Modeling Project Ppt Powerpoint Presentation Complete Deck With Slides acts as backup support for your ideas, vision, thoughts, etc. Use it to present a thorough understanding of the topic. This PPT slideshow can be utilized for both in-house and outside presentations depending upon your needs and business demands. Entailing eighteen slides with a consistent design and theme, this template will make a solid use case. As it is intuitively designed, it suits every business vertical and industry. All you have to do is make a few tweaks in the content or any other component to design unique presentations. The biggest advantage of this complete deck is that it can be personalized multiple times once downloaded. The color, design, shapes, and other elements are free to modify to add personal touches. You can also insert your logo design in this PPT layout. Therefore a well-thought and crafted presentation can be delivered with ease and precision by downloading this Statistical Modeling Project Ppt Powerpoint Presentation Complete Deck With Slides PPT slideshow. Our Statistical Modeling Project Ppt Powerpoint Presentation Complete Deck With Slides are topically designed to provide an attractive backdrop to any subject. Use them to look like a presentation pro.
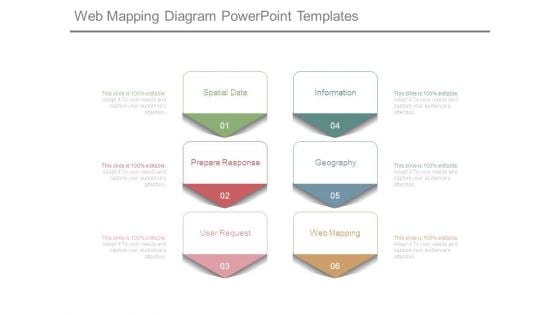
Web Mapping Diagram Powerpoint Templates
This is a web mapping diagram powerpoint templates. This is a six stage process. The stages in this process are spatial data, prepare response, user request, information, geography, web mapping.
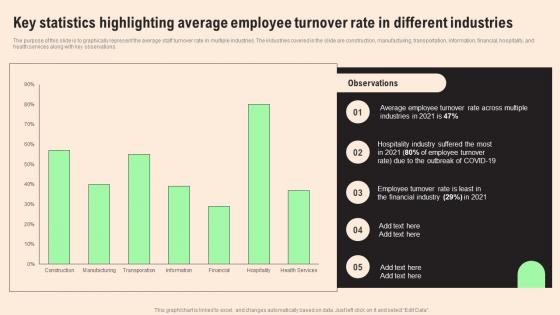
Key Statistics Highlighting Average Employee Turnover Rate In Different Industries Diagrams Pdf
The purpose of this slide is to graphically represent the average staff turnover rate in multiple industries. The industries covered in the slide are construction, manufacturing, transportation, information, financial, hospitality, and health services along with key observations. Boost your pitch with our creative Key Statistics Highlighting Average Employee Turnover Rate In Different Industries Diagrams Pdf. Deliver an awe inspiring pitch that will mesmerize everyone. Using these presentation templates you will surely catch everyones attention. You can browse the ppts collection on our website. We have researchers who are experts at creating the right content for the templates. So you do not have to invest time in any additional work. Just grab the template now and use them. The purpose of this slide is to graphically represent the average staff turnover rate in multiple industries. The industries covered in the slide are construction, manufacturing, transportation, information, financial, hospitality, and health services along with key observations.
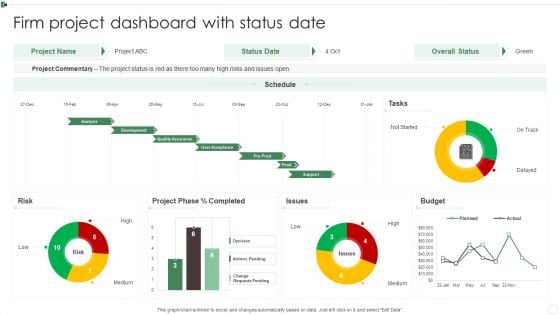
Firm Project Dashboard With Status Date Ppt Infographics Slides PDF
This graph or chart is linked to excel, and changes automatically based on data. Just left click on it and select Edit Data. Pitch your topic with ease and precision using this Firm Project Dashboard With Status Date Ppt Infographics Slides PDF. This layout presents information on Project Commentary, Budget, Project Phase, Risk. It is also available for immediate download and adjustment. So, changes can be made in the color, design, graphics or any other component to create a unique layout.
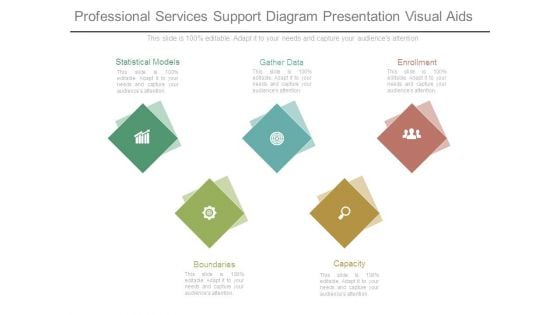
Professional Services Support Diagram Presentation Visual Aids
This is a professional services support diagram presentation visual aids. This is a five stage process. The stages in this process are statistical models, gather data, enrollment, capacity, boundaries.
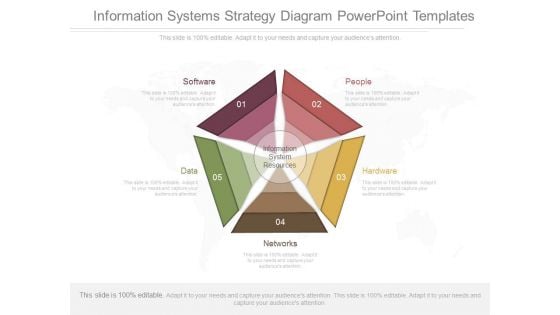
Information Systems Strategy Diagram Powerpoint Templates
This is a information systems strategy diagram powerpoint templates. This is a five stage process. The stages in this process are software, people, hardware, data, networks, information system resources.
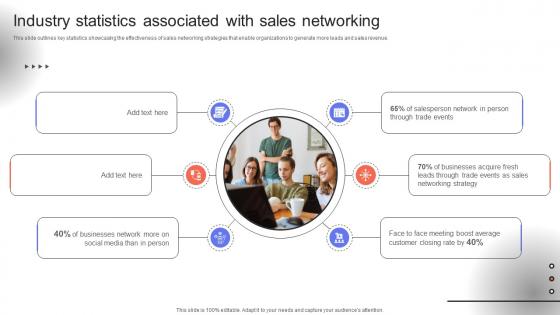
Trade Event Tactics To Boost Industry Statistics Associated With Sales Networking SA SS V
This slide outlines key statistics showcasing the effectiveness of sales networking strategies that enable organizations to generate more leads and sales revenue. Retrieve professionally designed Trade Event Tactics To Boost Industry Statistics Associated With Sales Networking SA SS V to effectively convey your message and captivate your listeners. Save time by selecting pre-made slideshows that are appropriate for various topics, from business to educational purposes. These themes come in many different styles, from creative to corporate, and all of them are easily adjustable and can be edited quickly. Access them as PowerPoint templates or as Google Slides themes. You do not have to go on a hunt for the perfect presentation because Slidegeeks got you covered from everywhere. This slide outlines key statistics showcasing the effectiveness of sales networking strategies that enable organizations to generate more leads and sales revenue.
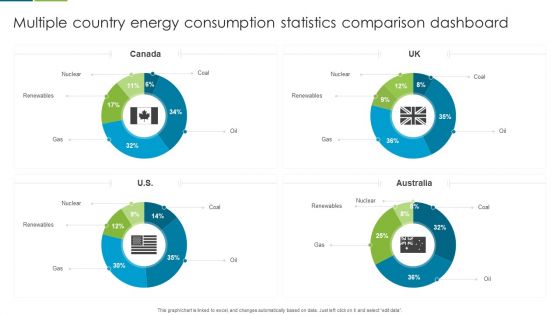
Multiple Country Energy Consumption Statistics Comparison Dashboard Formats PDF
This graph or chart is linked to excel, and changes automatically based on data. Just left click on it and select edit data. Pitch your topic with ease and precision using this Multiple Country Energy Consumption Statistics Comparison Dashboard Formats PDF. This layout presents information on Nuclear, Renewables, Gas. It is also available for immediate download and adjustment. So, changes can be made in the color, design, graphics or any other component to create a unique layout.
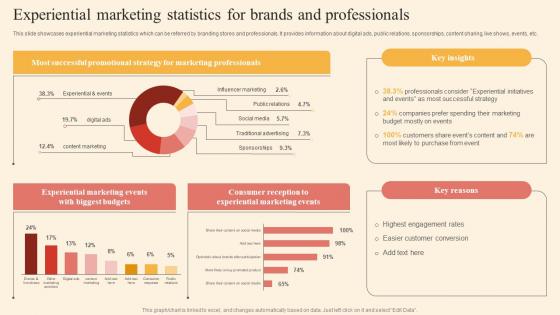
Experiential Marketing Statistics Driving Business Success By Hosting Experiential Pictures Pdf
This slide showcases experiential marketing statistics which can be referred by branding stores and professionals. It provides information about digital ads, public relations, sponsorships, content sharing, live shows, events, etc. The Experiential Marketing Statistics Driving Business Success By Hosting Experiential Pictures Pdf is a compilation of the most recent design trends as a series of slides. It is suitable for any subject or industry presentation, containing attractive visuals and photo spots for businesses to clearly express their messages. This template contains a variety of slides for the user to input data, such as structures to contrast two elements, bullet points, and slides for written information. Slidegeeks is prepared to create an impression. This slide showcases experiential marketing statistics which can be referred by branding stores and professionals. It provides information about digital ads, public relations, sponsorships, content sharing, live shows, events, etc.
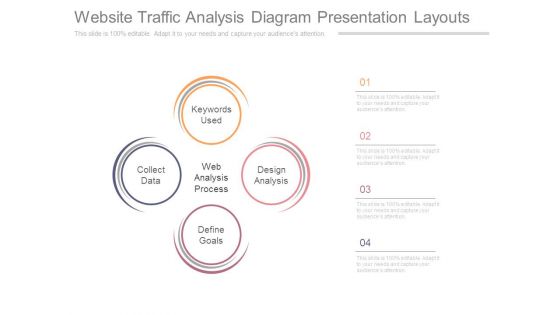
Website Traffic Analysis Diagram Presentation Layouts
This is a website traffic analysis diagram presentation layouts. This is a four stage process. The stages in this process are keywords used, design analysis, define goals, collect data, web analysis process.
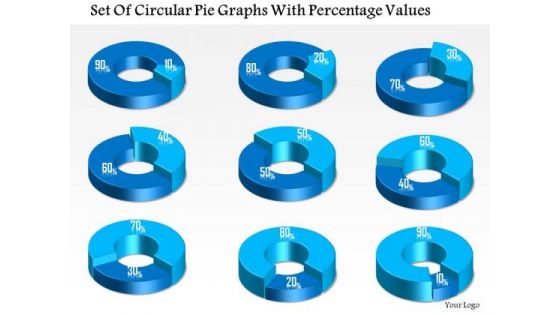
Business Diagram Set Of Circular Pie Graphs With Percentage Values Presentation Template
This business diagram displays set of pie charts. This Power Point template has been designed to compare and present business data. Download this diagram to represent stages of business growth.
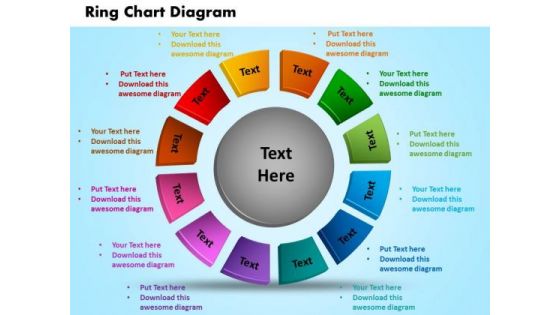
PowerPoint Theme Ring Chart Diagram Growth Ppt Template
PowerPoint Theme Ring Chart Diagram Growth PPT Template-Use this graphical approach to represent global business issues such as financial data, stock market Exchange, increase in sales, corporate presentations and more.-PowerPoint Theme Ring Chart Diagram Growth PPT Template Do exciting things with our PowerPoint Theme Ring Chart Diagram Growth Ppt Template. Create intelligent and delightful choices with your ideas.
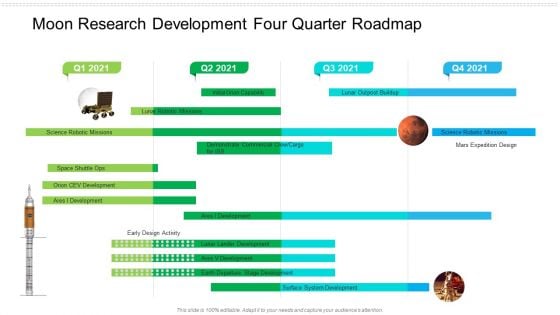
Moon Research Development Four Quarter Roadmap Graphics
Presenting our innovatively structured moon research development four quarter roadmap graphics Template. Showcase your roadmap process in different formats like PDF, PNG, and JPG by clicking the download button below. This PPT design is available in both Standard Screen and Widescreen aspect ratios. It can also be easily personalized and presented with modified font size, font type, color, and shapes to measure your progress in a clear way.
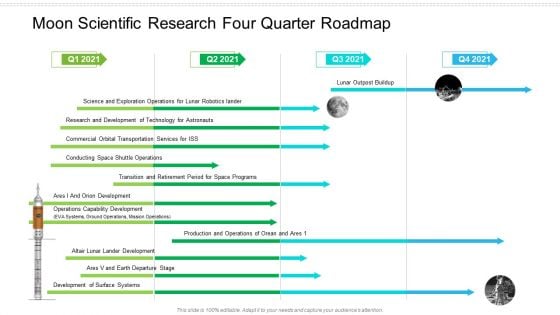
Moon Scientific Research Four Quarter Roadmap Mockup
Presenting our innovatively structured moon scientific research four quarter roadmap mockup Template. Showcase your roadmap process in different formats like PDF, PNG, and JPG by clicking the download button below. This PPT design is available in both Standard Screen and Widescreen aspect ratios. It can also be easily personalized and presented with modified font size, font type, color, and shapes to measure your progress in a clear way.
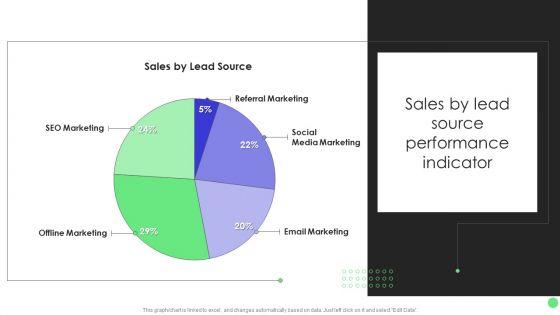
Comprehensive Guide For Launch Sales By Lead Source Performance Indicator Inspiration PDF
This graph or chart is linked to excel, and changes automatically based on data. Just left click on it and select Edit Data. The Comprehensive Guide For Launch Sales By Lead Source Performance Indicator Inspiration PDF is a compilation of the most recent design trends as a series of slides. It is suitable for any subject or industry presentation, containing attractive visuals and photo spots for businesses to clearly express their messages. This template contains a variety of slides for the user to input data, such as structures to contrast two elements, bullet points, and slides for written information. Slidegeeks is prepared to create an impression.
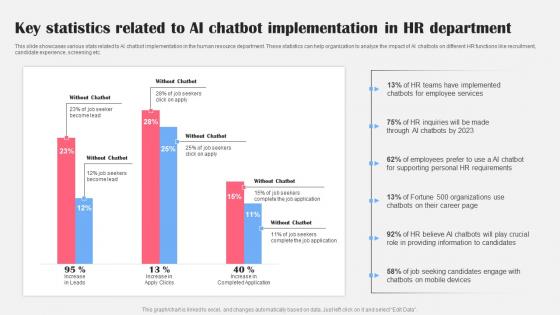
AI Bot Application For Various Industries Key Statistics Related AI Chatbot Elements Pdf
This slide showcases various stats related to AI chatbot implementation in the human resource department. These statistics can help organization to analyze the impact of AI chatbots on different HR functions like recruitment, candidate experience, screening etc. Welcome to our selection of the AI Bot Application For Various Industries Key Statistics Related AI Chatbot Elements Pdf. These are designed to help you showcase your creativity and bring your sphere to life. Planning and Innovation are essential for any business that is just starting out. This collection contains the designs that you need for your everyday presentations. All of our PowerPoints are 100 percent editable, so you can customize them to suit your needs. This multi purpose template can be used in various situations. Grab these presentation templates today This slide showcases various stats related to AI chatbot implementation in the human resource department. These statistics can help organization to analyze the impact of AI chatbots on different HR functions like recruitment, candidate experience, screening etc.
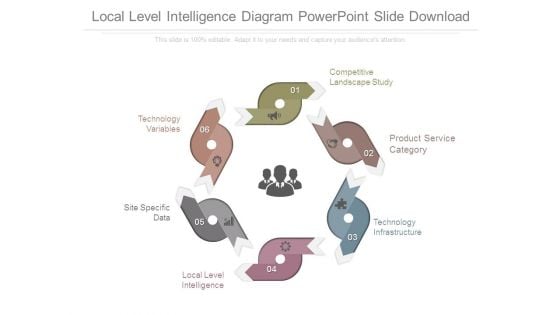
Local Level Intelligence Diagram Powerpoint Slide Download
This is a local level intelligence diagram powerpoint slide download. This is a six stage process. The stages in this process are technology variables, site specific, data, local level intelligence, technology infrastructure, product service category, competitive landscape study.
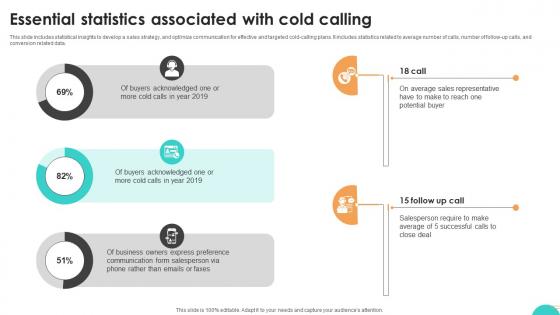
Ultimate Guide To Cold Essential Statistics Associated With Cold Calling SA SS V
This slide includes statistical insights to develop a sales strategy, and optimize communication for effective and targeted cold-calling plans. It includes statistics related to average number of calls, number of follow-up calls, and conversion related data. Formulating a presentation can take up a lot of effort and time, so the content and message should always be the primary focus. The visuals of the PowerPoint can enhance the presenters message, so our Ultimate Guide To Cold Essential Statistics Associated With Cold Calling SA SS V was created to help save time. Instead of worrying about the design, the presenter can concentrate on the message while our designers work on creating the ideal templates for whatever situation is needed. Slidegeeks has experts for everything from amazing designs to valuable content, we have put everything into Ultimate Guide To Cold Essential Statistics Associated With Cold Calling SA SS V. This slide includes statistical insights to develop a sales strategy, and optimize communication for effective and targeted cold-calling plans. It includes statistics related to average number of calls, number of follow-up calls, and conversion related data.
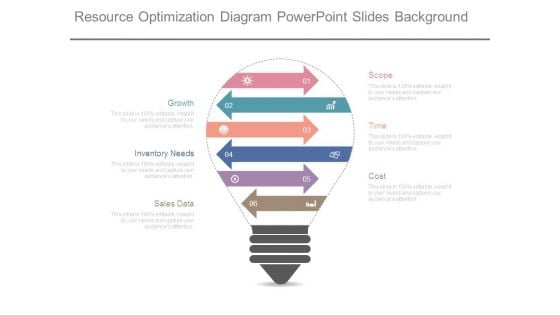
Resource Optimization Diagram Powerpoint Slides Background
This is a resource optimization diagram powerpoint slides background. This is a six stage process. The stages in this process are scope, time, cost, growth, inventory needs, sales data.
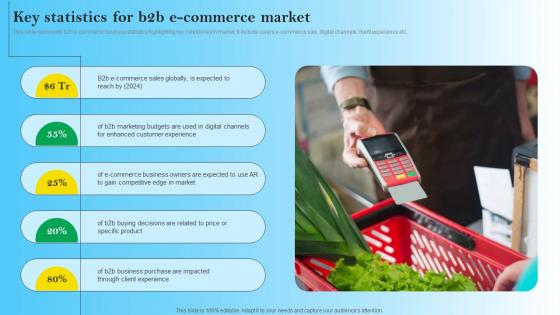
Key Statistics For B2B E Commerce Market B2B Digital Commerce Background Pdf
This slide represents b2b e-commerce business statistics highlighting key milestones in market. It include covers e-commerce sale, digital channels, client experience etc. If you are looking for a format to display your unique thoughts, then the professionally designed Key Statistics For B2B E Commerce Market B2B Digital Commerce Background Pdf is the one for you. You can use it as a Google Slides template or a PowerPoint template. Incorporate impressive visuals, symbols, images, and other charts. Modify or reorganize the text boxes as you desire. Experiment with shade schemes and font pairings. Alter, share or cooperate with other people on your work. Download Key Statistics For B2B E Commerce Market B2B Digital Commerce Background Pdf and find out how to give a successful presentation. Present a perfect display to your team and make your presentation unforgettable. This slide represents b2b e-commerce business statistics highlighting key milestones in market. It include covers e-commerce sale, digital channels, client experience etc.
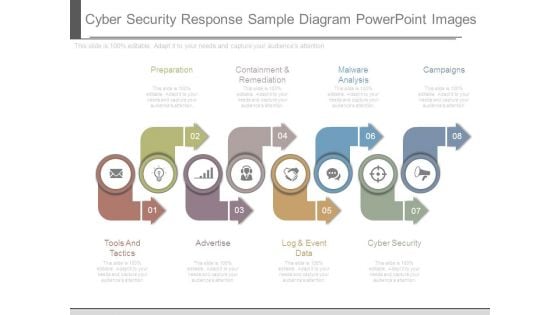
Cyber Security Response Sample Diagram Powerpoint Images
This is a cyber security response sample diagram powerpoint images. This is a eight stage process. The stages in this process are preparation, containment and remediation, malware analysis, campaigns, cyber security, log and event data, advertise, tools and tactics.
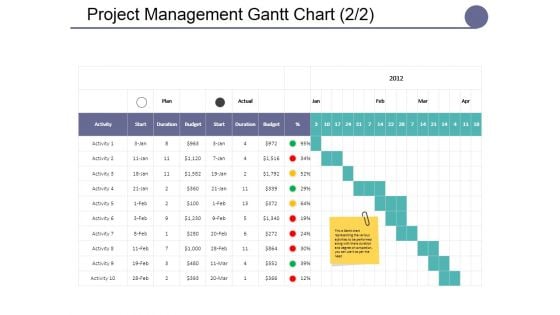
Project Management Gantt Chart Template Ppt PowerPoint Presentation Summary Master Slide
This is a project management gantt chart template ppt powerpoint presentation summary master slide. This is a seven stage process. The stages in this process are lists, table, data, management, marketing.

 Home
Home