Financial Dashboard
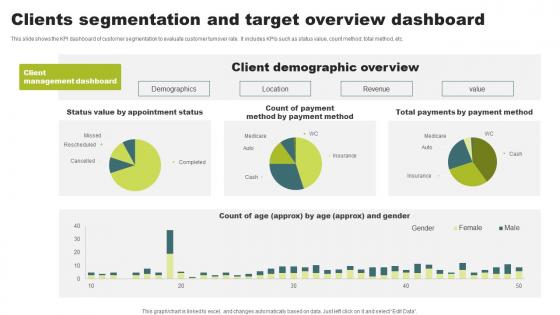
Clients Segmentation And Target Overview Dashboard Microsoft Pdf
This slide shows the KPI dashboard of customer segmentation to evaluate customer turnover rate. It includes KPIs such as status value, count method, total method, etc. Showcasing this set of slides titled Clients Segmentation And Target Overview Dashboard Microsoft Pdf. The topics addressed in these templates are Client Demographic Overview, Revenue, Location. All the content presented in this PPT design is completely editable. Download it and make adjustments in color, background, font etc. as per your unique business setting. This slide shows the KPI dashboard of customer segmentation to evaluate customer turnover rate. It includes KPIs such as status value, count method, total method, etc.
Product Branding Performance Tracking Dashboard Strategies For Achieving Pictures Pdf
This slide provides information regarding product branding performance tracking dashboard in terms of revenues, new customers, customer satisfaction rate. This Product Branding Performance Tracking Dashboard Strategies For Achieving Pictures Pdf is perfect for any presentation, be it in front of clients or colleagues. It is a versatile and stylish solution for organizing your meetings. The Product Branding Performance Tracking Dashboard Strategies For Achieving Pictures Pdf features a modern design for your presentation meetings. The adjustable and customizable slides provide unlimited possibilities for acing up your presentation. Slidegeeks has done all the homework before launching the product for you. So, do not wait, grab the presentation templates today This slide provides information regarding product branding performance tracking dashboard in terms of revenues, new customers, customer satisfaction rate.
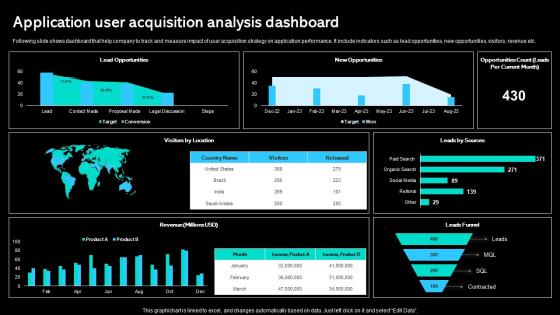
Application User Acquisition Analysis Dashboard Paid Marketing Approach Rules Pdf
Following slide shows dashboard that help company to track and measure impact of user acquisition strategy on application performance. It include indicators such as lead opportunities, new opportunities, visitors, revenue etc. Do you have to make sure that everyone on your team knows about any specific topic I yes, then you should give Application User Acquisition Analysis Dashboard Paid Marketing Approach Rules Pdf a try. Our experts have put a lot of knowledge and effort into creating this impeccable Application User Acquisition Analysis Dashboard Paid Marketing Approach Rules Pdf You can use this template for your upcoming presentations, as the slides are perfect to represent even the tiniest detail. You can download these templates from the Slidegeeks website and these are easy to edit. So grab these today. Following slide shows dashboard that help company to track and measure impact of user acquisition strategy on application performance. It include indicators such as lead opportunities, new opportunities, visitors, revenue etc.
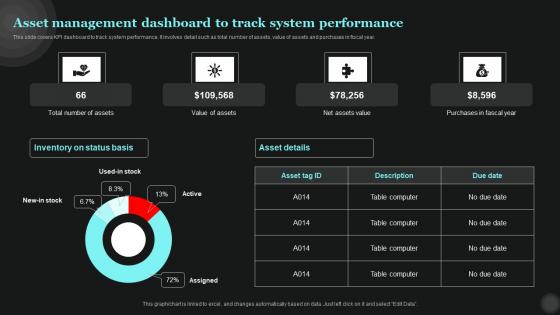
Asset Management Dashboard To Track Tech Asset Management Diagrams Pdf
This slide covers KPI dashboard to track system performance. It involves detail such as total number of assets, value of assets and purchases in fiscal year. Slidegeeks has constructed Asset Management Dashboard To Track Tech Asset Management Diagrams Pdf after conducting extensive research and examination. These presentation templates are constantly being generated and modified based on user preferences and critiques from editors. Here, you will find the most attractive templates for a range of purposes while taking into account ratings and remarks from users regarding the content. This is an excellent jumping-off point to explore our content and will give new users an insight into our top-notch PowerPoint Templates. This slide covers KPI dashboard to track system performance. It involves detail such as total number of assets, value of assets and purchases in fiscal year.
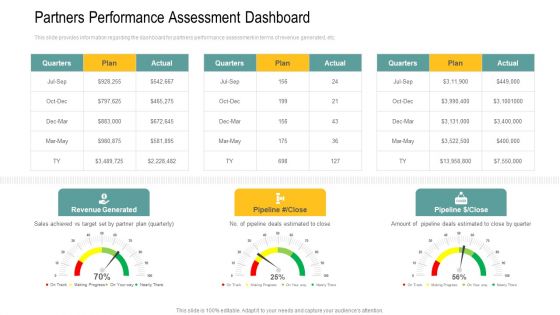
Partners Performance Assessment Dashboard Ppt Infographic Template Elements PDF
This slide provides information regarding the dashboard for partners performance assessment in terms of revenue generated, etc. Deliver an awe-inspiring pitch with this creative partners performance assessment dashboard ppt infographic template elements pdf bundle. Topics like partners performance assessment dashboard can be discussed with this completely editable template. It is available for immediate download depending on the needs and requirements of the user.
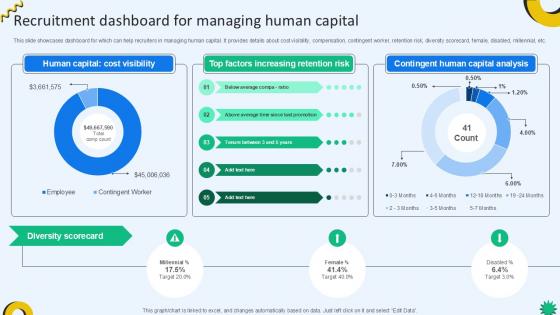
Recruitment Dashboard For Managing Cloud Recruiting Technologies PPT Example
This slide showcases dashboard for which can help recruiters in managing human capital. It provides details about cost visibility, compensation, contingent worker, retention risk, diversity scorecard, female, disabled, millennial, etc. The Recruitment Dashboard For Managing Cloud Recruiting Technologies PPT Example is a compilation of the most recent design trends as a series of slides. It is suitable for any subject or industry presentation, containing attractive visuals and photo spots for businesses to clearly express their messages. This template contains a variety of slides for the user to input data, such as structures to contrast two elements, bullet points, and slides for written information. Slidegeeks is prepared to create an impression. This slide showcases dashboard for which can help recruiters in managing human capital. It provides details about cost visibility, compensation, contingent worker, retention risk, diversity scorecard, female, disabled, millennial, etc.
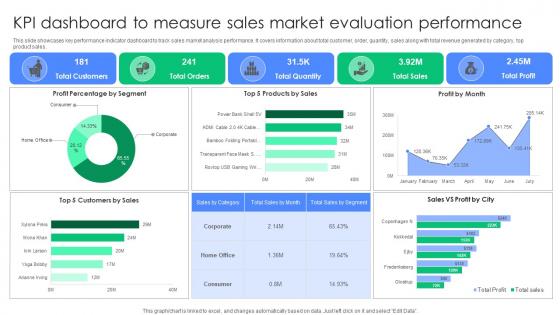
KPI Dashboard To Measure Sales Market Evaluation Performance Summary Pdf
This slide showcases key performance indicator dashboard to track sales market analysis performance. It covers information about total customer, order, quantity, sales along with total revenue generated by category, top product sales. Pitch your topic with ease and precision using this KPI Dashboard To Measure Sales Market Evaluation Performance Summary Pdf. This layout presents information on Profit Percentage Segment, Products Sales, Profit Month. It is also available for immediate download and adjustment. So, changes can be made in the color, design, graphics or any other component to create a unique layout. This slide showcases key performance indicator dashboard to track sales market analysis performance. It covers information about total customer, order, quantity, sales along with total revenue generated by category, top product sales.
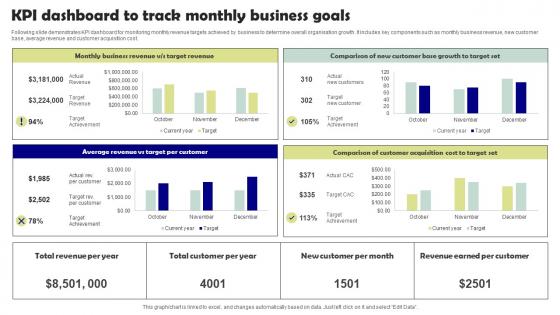
KPI Dashboard To Track Monthly Business Goals Microsoft Pdf
Following slide demonstrates KPI dashboard for monitoring monthly revenue targets achieved by business to determine overall organisation growth. It includes key components such as monthly business revenue, new customer base, average revenue and customer acquisition cost. Pitch your topic with ease and precision using this KPI Dashboard To Track Monthly Business Goals Microsoft Pdf. This layout presents information on Target Per Customer, Target Set. It is also available for immediate download and adjustment. So, changes can be made in the color, design, graphics or any other component to create a unique layout. Following slide demonstrates KPI dashboard for monitoring monthly revenue targets achieved by business to determine overall organisation growth. It includes key components such as monthly business revenue, new customer base, average revenue and customer acquisition cost.
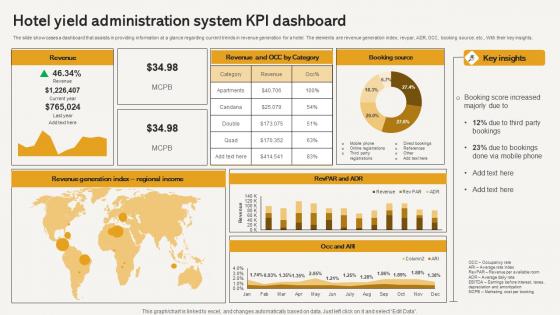
Hotel Yield Administration System Kpi Dashboard Elements Pdf
The slide showcases a dashboard that assists in providing information at a glance regarding current trends in revenue generation for a hotel. The elements are revenue generation index, revpar, ADR, OCC, booking source, etc., With their key insights. Pitch your topic with ease and precision using this Hotel Yield Administration System Kpi Dashboard Elements Pdf This layout presents information on Revenue, Booking Source, Regional Income, Key Insights It is also available for immediate download and adjustment. So, changes can be made in the color, design, graphics or any other component to create a unique layout. The slide showcases a dashboard that assists in providing information at a glance regarding current trends in revenue generation for a hotel. The elements are revenue generation index, revpar, ADR, OCC, booking source, etc., With their key insights.
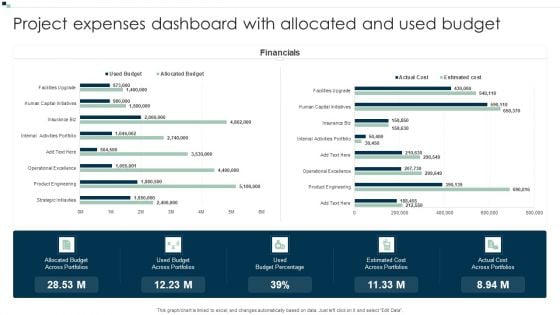
Project Expenses Dashboard With Allocated And Used Budget Introduction PDF
Showcasing this set of slides titled Project Expenses Dashboard With Allocated And Used Budget Introduction PDF. The topics addressed in these templates are Financials, Used Budget Across Portfolios, Estimated Cost Across Portfolios. All the content presented in this PPT design is completely editable. Download it and make adjustments in color, background, font etc. as per your unique business setting.
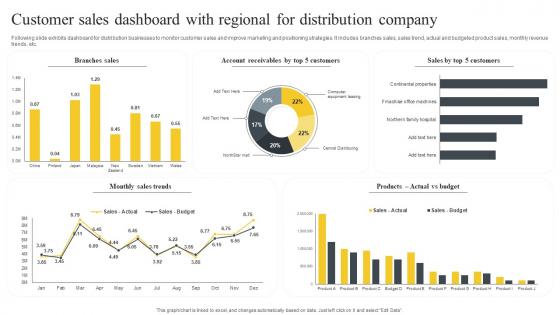
Customer Sales Dashboard With Regional For Distribution Company Brochure Pdf
Following slide exhibits dashboard for distribution businesses to monitor customer sales and improve marketing and positioning strategies. It includes branches sales, sales trend, actual and budgeted product sales, monthly revenue trends, etc. Pitch your topic with ease and precision using this Customer Sales Dashboard With Regional For Distribution Company Brochure Pdf. This layout presents information on Branches Sales, Monthly Sales Trends, Customers. It is also available for immediate download and adjustment. So, changes can be made in the color, design, graphics or any other component to create a unique layout. Following slide exhibits dashboard for distribution businesses to monitor customer sales and improve marketing and positioning strategies. It includes branches sales, sales trend, actual and budgeted product sales, monthly revenue trends, etc.
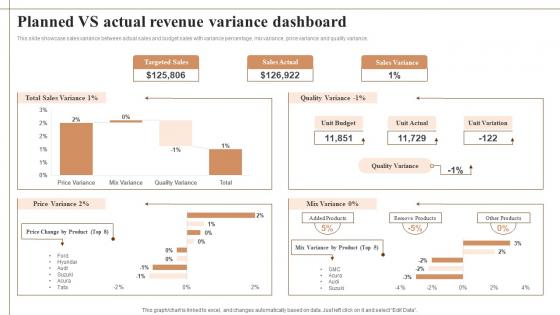
Planned Vs Actual Revenue Variance Dashboard Background Pdf
This slide showcase sales variance between actual sales and budget sales with variance percentage, mix variance, price variance and quality variance. Showcasing this set of slides titled Planned Vs Actual Revenue Variance Dashboard Background Pdf The topics addressed in these templates are Targeted Sales, Sales Actual, Sales Variance All the content presented in this PPT design is completely editable. Download it and make adjustments in color, background, font etc. as per your unique business setting. This slide showcase sales variance between actual sales and budget sales with variance percentage, mix variance, price variance and quality variance.
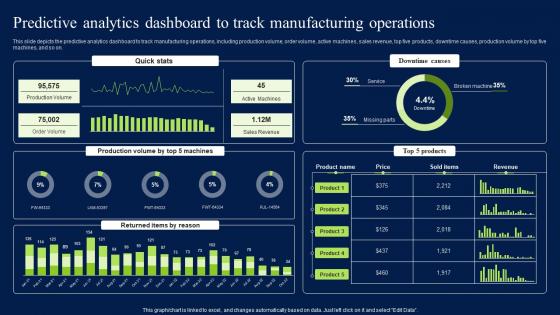
Predictive Analytics Dashboard To Track Manufacturing Operations Download PDF
This slide depicts the predictive analytics dashboard to track manufacturing operations, including production volume, order volume, active machines, sales revenue, top five products, downtime causes, production volume by top five machines, and so on. Present like a pro with Predictive Analytics Dashboard To Track Manufacturing Operations Download PDF Create beautiful presentations together with your team, using our easy-to-use presentation slides. Share your ideas in real-time and make changes on the fly by downloading our templates. So whether you are in the office, on the go, or in a remote location, you can stay in sync with your team and present your ideas with confidence. With Slidegeeks presentation got a whole lot easier. Grab these presentations today. This slide depicts the predictive analytics dashboard to track manufacturing operations, including production volume, order volume, active machines, sales revenue, top five products, downtime causes, production volume by top five machines, and so on.
Product Branding Performance Tracking Dashboard Effective Brand Maintenance Slides Pdf
This slide provides information regarding product branding performance tracking dashboard in terms of revenues, new customers, customer satisfaction rate. Take your projects to the next level with our ultimate collection of Product Branding Performance Tracking Dashboard Effective Brand Maintenance Slides Pdf Slidegeeks has designed a range of layouts that are perfect for representing task or activity duration, keeping track of all your deadlines at a glance. Tailor these designs to your exact needs and give them a truly corporate look with your own brand colors they well make your projects stand out from the rest. This slide provides information regarding product branding performance tracking dashboard in terms of revenues, new customers, customer satisfaction rate.
Product Branding Performance Tracking Dashboard Leveraging Corporate Guidelines Pdf
This slide provides information regarding product branding performance tracking dashboard in terms of revenues, new customers, customer satisfaction rate. Do you know about Slidesgeeks Product Branding Performance Tracking Dashboard Leveraging Corporate Guidelines Pdf These are perfect for delivering any kind od presentation. Using it, create PowerPoint presentations that communicate your ideas and engage audiences. Save time and effort by using our pre-designed presentation templates that are perfect for a wide range of topic. Our vast selection of designs covers a range of styles, from creative to business, and are all highly customizable and easy to edit. Download as a PowerPoint template or use them as Google Slides themes. This slide provides information regarding product branding performance tracking dashboard in terms of revenues, new customers, customer satisfaction rate.
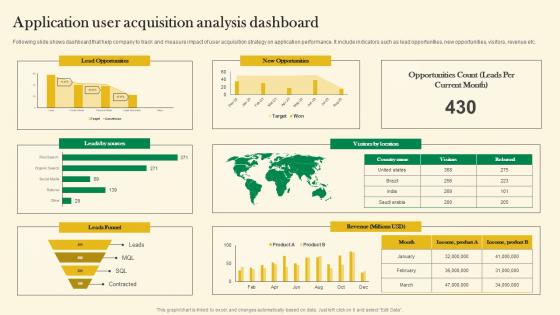
Application User Acquisition Analysis Dashboard Online Customer Acquisition Microsoft Pdf
Following slide shows dashboard that help company to track and measure impact of user acquisition strategy on application performance. It include indicators such as lead opportunities, new opportunities, visitors, revenue etc. The best PPT templates are a great way to save time, energy, and resources. Slidegeeks have 100 percent editable powerpoint slides making them incredibly versatile. With these quality presentation templates, you can create a captivating and memorable presentation by combining visually appealing slides and effectively communicating your message. Download Application User Acquisition Analysis Dashboard Online Customer Acquisition Microsoft Pdf from Slidegeeks and deliver a wonderful presentation. Following slide shows dashboard that help company to track and measure impact of user acquisition strategy on application performance. It include indicators such as lead opportunities, new opportunities, visitors, revenue etc.
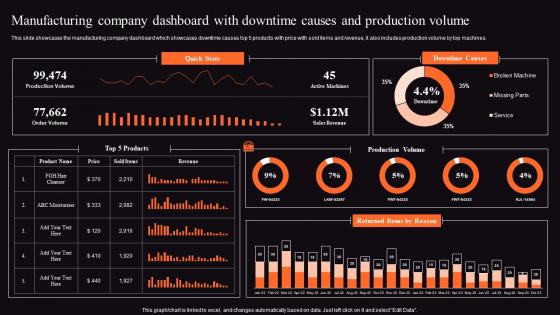
Food Processing Business Profile Manufacturing Company Dashboard Brochure Pdf
This slide showcases the manufacturing company dashboard which showcases downtime causes top 5 products with price with sold items and revenue, it also includes production volume by top machines. Do you know about Slidesgeeks Food Processing Business Profile Manufacturing Company Dashboard Brochure Pdf These are perfect for delivering any kind od presentation. Using it, create PowerPoint presentations that communicate your ideas and engage audiences. Save time and effort by using our pre designed presentation templates that are perfect for a wide range of topic. Our vast selection of designs covers a range of styles, from creative to business, and are all highly customizable and easy to edit. Download as a PowerPoint template or use them as Google Slides themes. This slide showcases the manufacturing company dashboard which showcases downtime causes top 5 products with price with sold items and revenue, it also includes production volume by top machines.
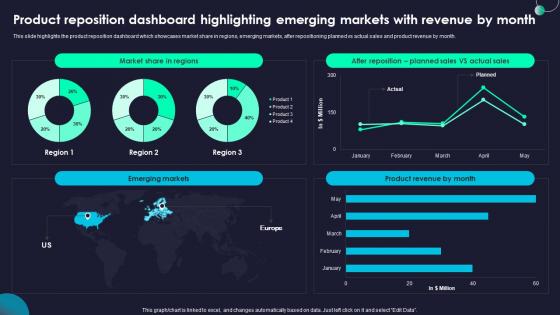
Product Reposition Dashboard Rebranding Marketing Strategies For Effective Diagrams Pdf
This slide highlights the product reposition dashboard which showcases market share in regions, emerging markets, after repositioning planned vs actual sales and product revenue by month. Welcome to our selection of the Product Reposition Dashboard Rebranding Marketing Strategies For Effective Diagrams Pdf, These are designed to help you showcase your creativity and bring your sphere to life. Planning and Innovation are essential for any business that is just starting out. This collection contains the designs that you need for your everyday presentations. All of our PowerPoints are 100 percent editable, so you can customize them to suit your needs. This multi purpose template can be used in various situations. Grab these presentation templates today This slide highlights the product reposition dashboard which showcases market share in regions, emerging markets, after repositioning planned vs actual sales and product revenue by month.
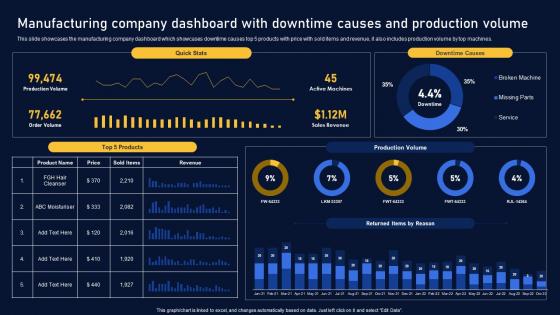
Manufacturing Company Dashboard Multinational Organization Customer Goods Diagrams Pdf
This slide showcases the manufacturing company dashboard which showcases downtime causes top 5 products with price with sold items and revenue, it also includes production volume by top machines. This modern and well arranged Manufacturing Company Dashboard Multinational Organization Customer Goods Diagrams Pdf provides lots of creative possibilities. It is very simple to customize and edit with the Powerpoint Software. Just drag and drop your pictures into the shapes. All facets of this template can be edited with Powerpoint, no extra software is necessary. Add your own material, put your images in the places assigned for them, adjust the colors, and then you can show your slides to the world, with an animated slide included. This slide showcases the manufacturing company dashboard which showcases downtime causes top 5 products with price with sold items and revenue, it also includes production volume by top machines.
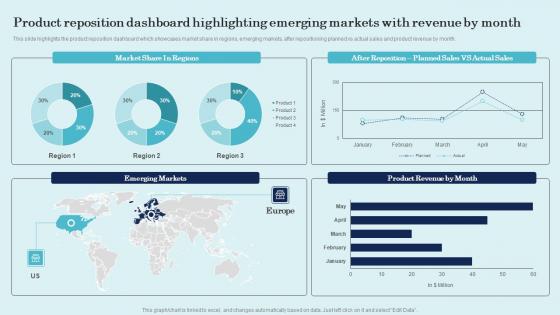
Product Reposition Dashboard Highlighting Emerging Product Repositioning Technique Pictures Pdf
This slide highlights the product reposition dashboard which showcases market share in regions, emerging markets, after repositioning planned vs actual sales and product revenue by month. Welcome to our selection of the Product Reposition Dashboard Highlighting Emerging Product Repositioning Technique Pictures Pdf. These are designed to help you showcase your creativity and bring your sphere to life. Planning and Innovation are essential for any business that is just starting out. This collection contains the designs that you need for your everyday presentations. All of our PowerPoints are 100 percent editable, so you can customize them to suit your needs. This multi-purpose template can be used in various situations. Grab these presentation templates today. This slide highlights the product reposition dashboard which showcases market share in regions, emerging markets, after repositioning planned vs actual sales and product revenue by month.
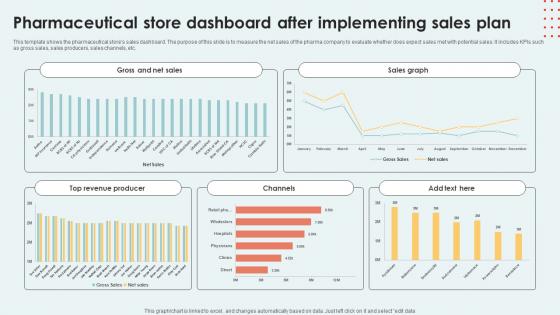
Pharmaceutical Store Dashboard After Implementing Sales Plan Inspiration Pdf
This template shows the pharmaceutical stores sales dashboard. The purpose of this slide is to measure the net sales of the pharma company to evaluate whether does expect sales met with potential sales. It includes KPIs such as gross sales, sales producers, sales channels, etc.Pitch your topic with ease and precision using this Pharmaceutical Store Dashboard After Implementing Sales Plan Inspiration Pdf This layout presents information on Gross Net Sales, Sales Graph, Top Revenue Producer It is also available for immediate download and adjustment. So, changes can be made in the color, design, graphics or any other component to create a unique layout. This template shows the pharmaceutical stores sales dashboard. The purpose of this slide is to measure the net sales of the pharma company to evaluate whether does expect sales met with potential sales. It includes KPIs such as gross sales, sales producers, sales channels, etc.
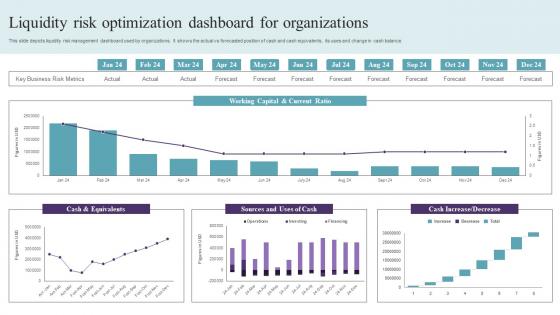
Liquidity Risk Optimization Dashboard For Organizations Graphics Pdf
This slide depicts liquidity risk management dashboard used by organizations. It shows the actual vs forecasted position of cash and cash equivalents, its uses and change in cash balance. Pitch your topic with ease and precision using this Liquidity Risk Optimization Dashboard For Organizations Graphics Pdf. This layout presents information on Cash And Equivalents, Working Capital, Current Ratio. It is also available for immediate download and adjustment. So, changes can be made in the color, design, graphics or any other component to create a unique layout. This slide depicts liquidity risk management dashboard used by organizations. It shows the actual vs forecasted position of cash and cash equivalents, its uses and change in cash balance.
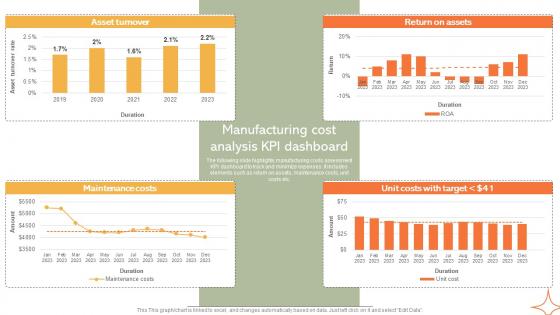
Manufacturing Cost Analysis KPI Dashboard Implementing Manufacturing Strategy SS V
The following slide highlights manufacturing costs assessment KPI dashboard to track and minimize expenses. It includes elements such as return on assets, maintenance costs, unit costs etc. Make sure to capture your audiences attention in your business displays with our gratis customizable Manufacturing Cost Analysis KPI Dashboard Implementing Manufacturing Strategy SS V. These are great for business strategies, office conferences, capital raising or task suggestions. If you desire to acquire more customers for your tech business and ensure they stay satisfied, create your own sales presentation with these plain slides. The following slide highlights manufacturing costs assessment KPI dashboard to track and minimize expenses. It includes elements such as return on assets, maintenance costs, unit costs etc.
Dashboard For Tracking Post Expansion Enhancing Global Presence Graphics Pdf
This slide covers the dashboard for analyzing fast food business sales by location. It includes KPIs such as the companys revenue by location, by type, top 5 expenses by account, top 5 expenses by department, cost of revenue year to date, etc.Find highly impressive Dashboard For Tracking Post Expansion Enhancing Global Presence Graphics Pdf on Slidegeeks to deliver a meaningful presentation. You can save an ample amount of time using these presentation templates. No need to worry to prepare everything from scratch because Slidegeeks experts have already done a huge research and work for you. You need to download Dashboard For Tracking Post Expansion Enhancing Global Presence Graphics Pdf for your upcoming presentation. All the presentation templates are 100Precent editable and you can change the color and personalize the content accordingly. Download now. This slide covers the dashboard for analyzing fast food business sales by location. It includes KPIs such as the companys revenue by location, by type, top 5 expenses by account, top 5 expenses by department, cost of revenue year to date, etc.
Dashboard For Tracking Impact Leveraging Logistics Automation Inspiration Pdf
This slide covers the dashboard for tracking vehicle efficiency after transport automation. It include KPIs such as truck turnaround time, average revenue per hour, truckload capacity, transit time, on-time pickup, and average revenue per mile.Do you have to make sure that everyone on your team knows about any specific topic I yes, then you should give Dashboard For Tracking Impact Leveraging Logistics Automation Inspiration Pdf a try. Our experts have put a lot of knowledge and effort into creating this impeccable Dashboard For Tracking Impact Leveraging Logistics Automation Inspiration Pdf. You can use this template for your upcoming presentations, as the slides are perfect to represent even the tiniest detail. You can download these templates from the Slidegeeks website and these are easy to edit. So grab these today. This slide covers the dashboard for tracking vehicle efficiency after transport automation. It include KPIs such as truck turnaround time, average revenue per hour, truckload capacity, transit time, on time pickup, and average revenue per mile.
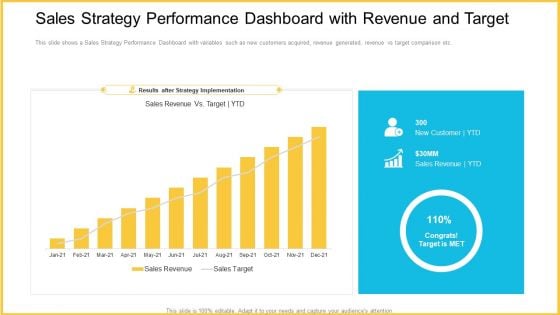
Sales Strategy Performance Dashboard With Revenue And Target Designs PDF
This slide shows a Sales Strategy Performance Dashboard with variables such as new customers acquired, revenue generated, revenue vs target comparison etc. Deliver and pitch your topic in the best possible manner with this sales strategy performance dashboard with revenue and target designs pdf. Use them to share invaluable insights on sales strategy performance dashboard with revenue and target and impress your audience. This template can be altered and modified as per your expectations. So, grab it now.
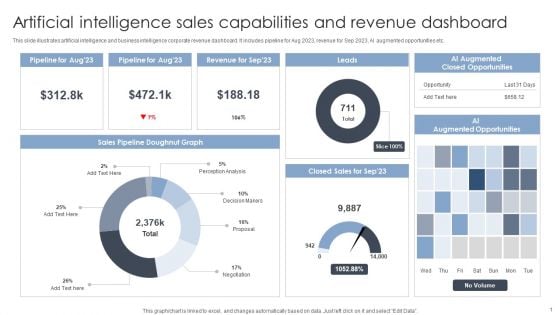
Artificial Intelligence Sales Capabilities And Revenue Dashboard Portrait PDF
This slide illustrates artificial intelligence and business intelligence corporate revenue dashboard. It includes pipeline for Aug 2023, revenue for Sep 2023, AI augmented opportunities etc. Pitch your topic with ease and precision using this Artificial Intelligence Sales Capabilities And Revenue Dashboard Portrait PDF. This layout presents information on Sales Capabilities, Revenue Dashboard. It is also available for immediate download and adjustment. So, changes can be made in the color, design, graphics or any other component to create a unique layout.
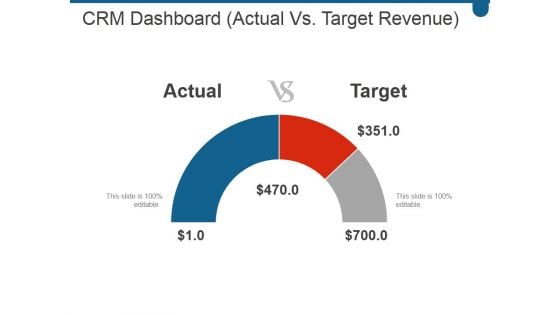
Crm Dashboard Actual Vs Target Revenue Ppt PowerPoint Presentation Topics
This is a crm dashboard actual vs target revenue ppt powerpoint presentation topics. This is a three stage process. The stages in this process are actual, target.
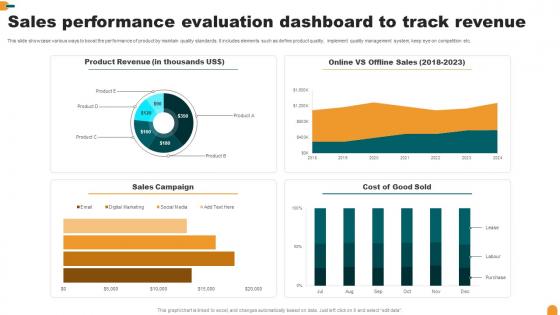
Sales Performance Evaluation Dashboard To Track Revenue Summary Pdf
This slide showcase various ways to boost the performance of product by maintain quality standards. It includes elements such as define product quality, implement quality management system, keep eye on competition etc.Pitch your topic with ease and precision using this Sales Performance Evaluation Dashboard To Track Revenue Summary Pdf This layout presents information on Sales Campaign, Product Revenue, Cost Good Sold It is also available for immediate download and adjustment. So, changes can be made in the color, design, graphics or any other component to create a unique layout. This slide showcase various ways to boost the performance of product by maintain quality standards. It includes elements such as define product quality, implement quality management system, keep eye on competition etc.
Cryptocurrency Portfolio Tracking Dashboard Summary Cryptocurrency Management With Blockchain
This slide represents the cryptocurrency performance indicators for the individual. The key components include invested money, profit and loss, rate of investment ROI, current valuation of money, etc.Formulating a presentation can take up a lot of effort and time, so the content and message should always be the primary focus. The visuals of the PowerPoint can enhance the presenters message, so our Cryptocurrency Portfolio Tracking Dashboard Summary Cryptocurrency Management With Blockchain was created to help save time. Instead of worrying about the design, the presenter can concentrate on the message while our designers work on creating the ideal templates for whatever situation is needed. Slidegeeks has experts for everything from amazing designs to valuable content, we have put everything into Cryptocurrency Portfolio Tracking Dashboard Summary Cryptocurrency Management With Blockchain. This slide represents the cryptocurrency performance indicators for the individual. The key components include invested money, profit and loss, rate of investment ROI, current valuation of money, etc.
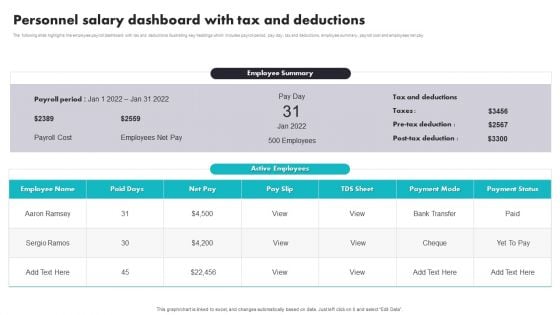
Personnel Salary Dashboard With Tax And Deductions Inspiration PDF
The following slide highlights the employee payroll dashboard with tax and deductions illustrating key headings which includes payroll period, pay day, tax and deductions, employee summary, payroll cost and employees net pay. Showcasing this set of slides titled Personnel Salary Dashboard With Tax And Deductions Inspiration PDF. The topics addressed in these templates are Personnel Salary Dashboard, Tax And Deductions. All the content presented in this PPT design is completely editable. Download it and make adjustments in color, background, font etc. as per your unique business setting.
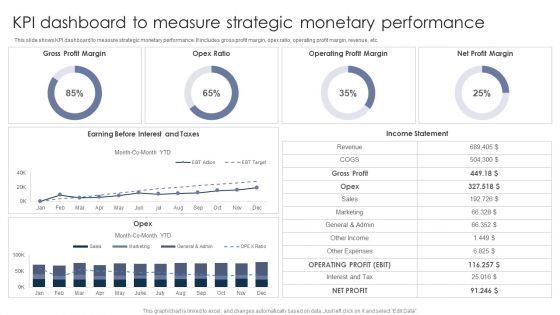
KPI Dashboard To Measure Strategic Monetary Performance Graphics PDF
This slide shows KPI dashboard to measure strategic monetary performance. It includes gross profit margin, opex ratio, operating profit margin, revenue, etc. Pitch your topic with ease and precision using this KPI Dashboard To Measure Strategic Monetary Performance Graphics PDF. This layout presents information on Gross Profit Margin, Opex Ratio, Operating Profit Margin. It is also available for immediate download and adjustment. So, changes can be made in the color, design, graphics or any other component to create a unique layout.
B2B Sales Representatives Performance Tracking Dashboard Elements PDF
This slide provides information regarding B2B sales representatives performance tracking dashboard to measure leads by region, revenue breakdown, top performers by leads, revenues, etc. Deliver an awe inspiring pitch with this creative B2B Sales Representatives Performance Tracking Dashboard Elements PDF bundle. Topics like Revenue Actual, Sales Representatives Performance, Tracking Dashboard can be discussed with this completely editable template. It is available for immediate download depending on the needs and requirements of the user.
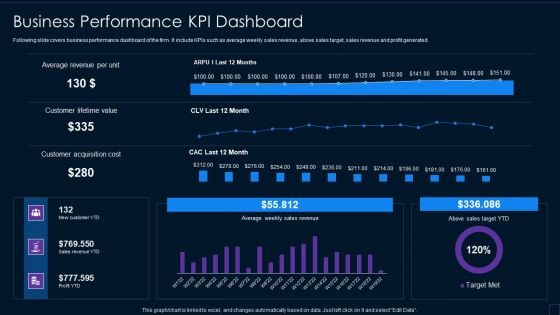
Brand Development Manual Business Performance KPI Dashboard Background PDF
Following slide covers business performance dashboard of the firm. It include KPIs such as average weekly sales revenue, above sales target, sales revenue and profit generated.Deliver an awe inspiring pitch with this creative Brand Development Manual Business Performance KPI Dashboard Background PDF bundle. Topics like Business Performance KPI Dashboard can be discussed with this completely editable template. It is available for immediate download depending on the needs and requirements of the user.
B2B Sales Representatives Performance Tracking Dashboard Pictures PDF
This slide provides information regarding B2B sales representatives performance tracking dashboard to measure leads by region, revenue breakdown, top performers by leads, revenues, etc. Deliver and pitch your topic in the best possible manner with this b2b sales representatives performance tracking dashboard pictures pdf Use them to share invaluable insights on b2b prospects performance measurement dashboard and impress your audience. This template can be altered and modified as per your expectations. So, grab it now.
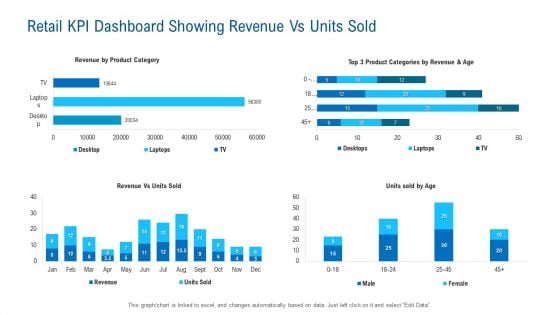
Retail KPI Dashboard Showing Revenue Vs Units Sold Microsoft PDF
Deliver an awe inspiring pitch with this creative retail kpi dashboard showing revenue vs units sold microsoft pdf bundle. Topics like product category, retail kpi dashboard showing revenue vs units sold can be discussed with this completely editable template. It is available for immediate download depending on the needs and requirements of the user.
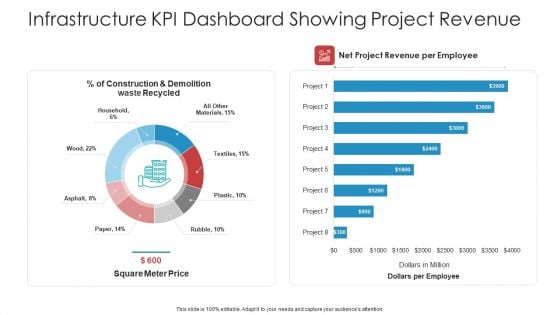
Infrastructure KPI Dashboard Showing Project Revenue Sample PDF
Deliver and pitch your topic in the best possible manner with this infrastructure kpi dashboard showing project revenue sample pdf. Use them to share invaluable insights on infrastructure kpi dashboard showing project revenue and impress your audience. This template can be altered and modified as per your expectations. So, grab it now.
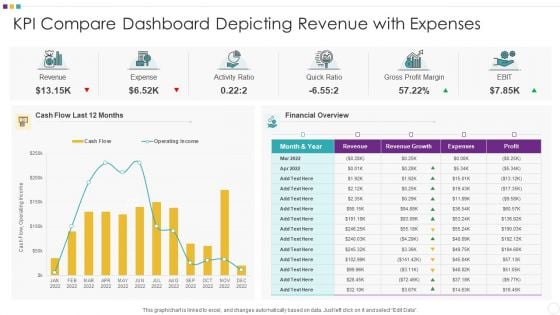
KPI Compare Dashboard Depicting Revenue With Expenses Information PDF
Showcasing this set of slides titled KPI Compare Dashboard Depicting Revenue With Expenses Information PDF The topics addressed in these templates are KPI Compare Dashboard Depicting Revenue With Expenses All the content presented in this PPT design is completely editable. Download it and make adjustments in color, background, font etc. as per your unique business setting.
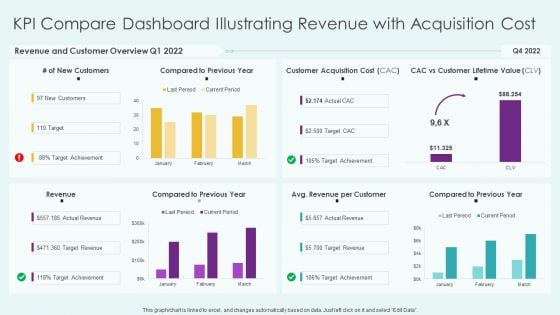
KPI Compare Dashboard Illustrating Revenue With Acquisition Cost Professional PDF
Showcasing this set of slides titled KPI Compare Dashboard Illustrating Revenue With Acquisition Cost Professional PDF The topics addressed in these templates are KPI Compare Dashboard Illustrating Revenue With Acquisition Cost All the content presented in this PPT design is completely editable. Download it and make adjustments in color, background, font etc. as per your unique business setting.
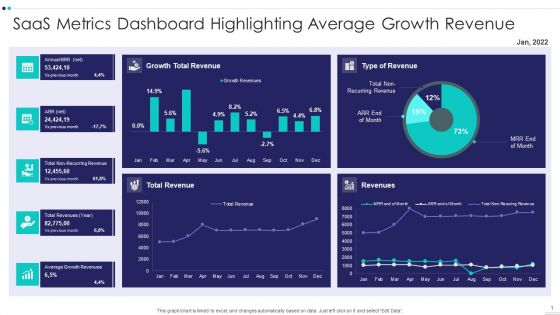
Saas Metrics Dashboard Highlighting Average Growth Revenue Diagrams PDF
Showcasing this set of slides titled Saas Metrics Dashboard Highlighting Average Growth Revenue Diagrams PDF The topics addressed in these templates are Saas Metrics Dashboard Highlighting Average Growth Revenue All the content presented in this PPT design is completely editable. Download it and make adjustments in color, background, font etc. as per your unique business setting.

Saas Metrics Dashboard Illustrating Revenue Growth Rate Demonstration PDF
Showcasing this set of slides titled Saas Metrics Dashboard Illustrating Revenue Growth Rate Demonstration PDF The topics addressed in these templates are Saas Metrics Dashboard Illustrating Revenue Growth Rate All the content presented in this PPT design is completely editable. Download it and make adjustments in color, background, font etc. as per your unique business setting.
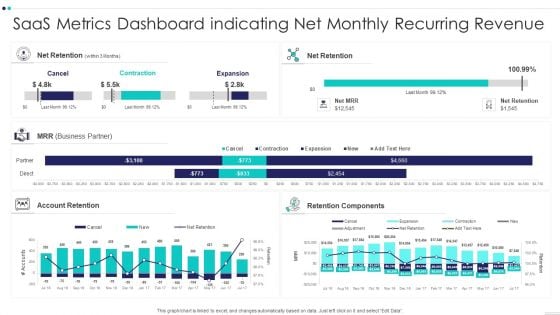
Saas Metrics Dashboard Indicating Net Monthly Recurring Revenue Information PDF
Showcasing this set of slides titled Saas Metrics Dashboard Indicating Net Monthly Recurring Revenue Information PDF The topics addressed in these templates are Saas Metrics Dashboard Indicating Net Monthly Recurring Revenue All the content presented in this PPT design is completely editable. Download it and make adjustments in color, background, font etc. as per your unique business setting.
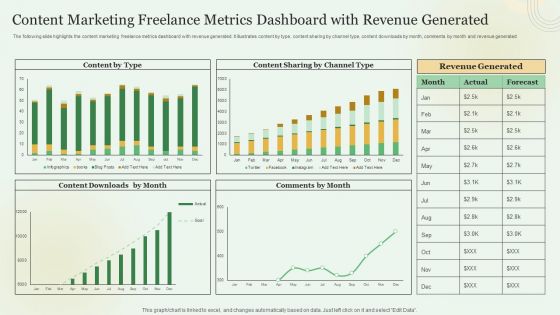
Content Marketing Freelance Metrics Dashboard With Revenue Generated Demonstration PDF
Showcasing this set of slides titled Content Marketing Freelance Metrics Dashboard With Revenue Generated Demonstration PDF. The topics addressed in these templates are Content Marketing, Freelance Metrics Dashboard, Revenue Generated. All the content presented in this PPT design is completely editable. Download it and make adjustments in color, background, font etc. as per your unique business setting.
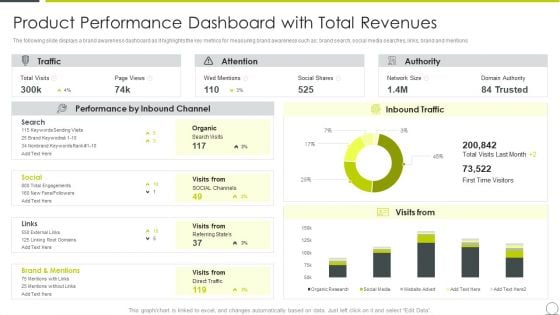
Examining Product Characteristics Brand Messaging Product Performance Dashboard Information PDF
The following slide displays a brand awareness dashboard as it highlights the key metrics for measuring brand awareness such as brand search, social media searches, links, brand and mentions Deliver an awe inspiring pitch with this creative examining product characteristics brand messaging product performance dashboard information pdf bundle. Topics like product performance dashboard with total revenues can be discussed with this completely editable template. It is available for immediate download depending on the needs and requirements of the user.
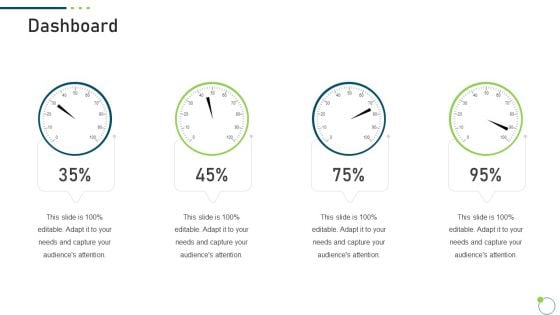
Investor Pitch Deck New Venture Capital Raising Dashboard Download PDF
Deliver an awe inspiring pitch with this creative investor pitch deck new venture capital raising dashboard download pdf bundle. Topics like dashboard can be discussed with this completely editable template. It is available for immediate download depending on the needs and requirements of the user.
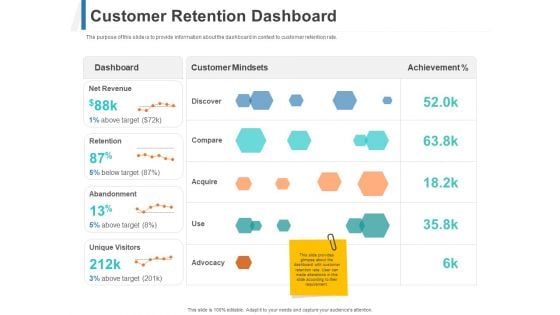
Share Of Wallet Customer Retention Dashboard Ppt Styles Layouts PDF
The purpose of this slide is to provide information about the dashboard in context to customer retention rate. Deliver and pitch your topic in the best possible manner with this share of wallet customer retention dashboard ppt styles layouts pdf. Use them to share invaluable insights on dashboard, customer mindsets, achievement, net revenue and impress your audience. This template can be altered and modified as per your expectations. So, grab it now.
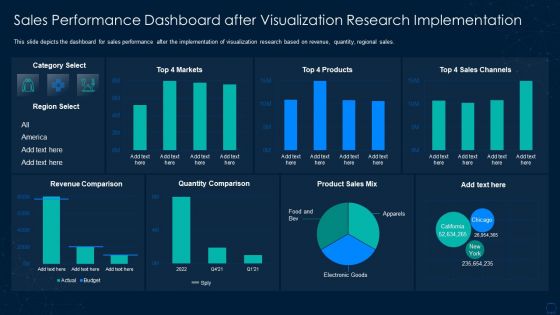
Graphical Representation Of Research IT Sales Performance Dashboard Sample PDF
This slide depicts the dashboard for sales performance after the implementation of visualization research based on revenue, quantity, regional sales. Deliver and pitch your topic in the best possible manner with this graphical representation of research it sales performance dashboard sample pdf. Use them to share invaluable insights on sales performance dashboard after visualization research implementation and impress your audience. This template can be altered and modified as per your expectations. So, grab it now.
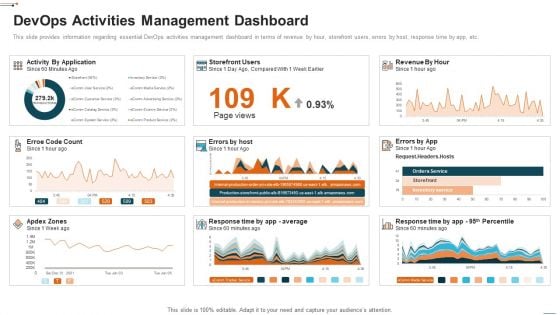
Devops Activities Management Dashboard Devops Deployment Initiative IT Slides PDF
This slide provides information regarding essential DevOps activities management dashboard in terms of revenue by hour, storefront users, errors by host, response time by app, etc. Deliver an awe inspiring pitch with this creative devops activities management dashboard devops deployment initiative it slides pdf bundle. Topics like devops activities management dashboard can be discussed with this completely editable template. It is available for immediate download depending on the needs and requirements of the user.
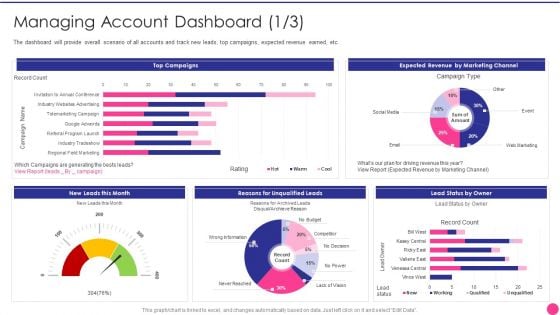
Operating B2B Sales Managing Account Dashboard Channel Inspiration PDF
The dashboard will provide overall scenario of all accounts and track new leads, top campaigns, expected revenue earned, etc. Deliver an awe inspiring pitch with this creative operating b2b sales managing account dashboard channel inspiration pdf bundle. Topics like managing account dashboard can be discussed with this completely editable template. It is available for immediate download depending on the needs and requirements of the user.
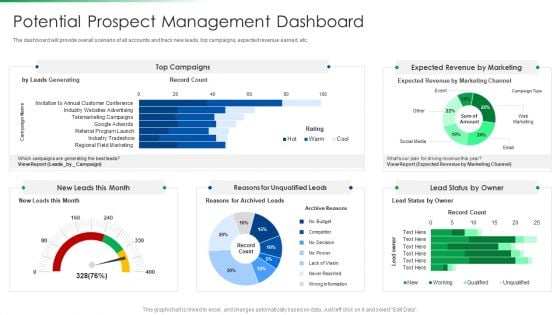
Strawman Project Action Plan Potential Prospect Management Dashboard Formats PDF
The dashboard will provide overall scenario of all accounts and track new leads, top campaigns, expected revenue earned, etc. Deliver an awe inspiring pitch with this creative strawman project action plan potential prospect management dashboard formats pdf bundle. Topics like potential prospect management dashboard can be discussed with this completely editable template. It is available for immediate download depending on the needs and requirements of the user.
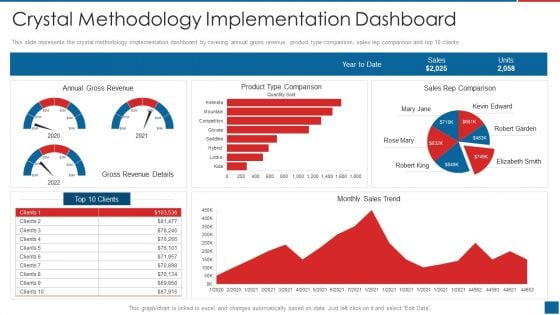
Agile Crystal Method Crystal Methodology Implementation Dashboard Pictures PDF
This slide represents the crystal methodology implementation dashboard by covering annual gross revenue, product type comparison, sales rep comparison and top 10 clients.Deliver an awe inspiring pitch with this creative Agile Crystal Method Crystal Methodology Implementation Dashboard Pictures PDF bundle. Topics like Crystal Methodology Implementation Dashboard can be discussed with this completely editable template. It is available for immediate download depending on the needs and requirements of the user.
Digital Insurance Dashboard With Enrollment Status Icons PDF
This slide illustrates digital insurance dashboard with customer enrollment status. It provides information about revenue, enrollment by age, enrollment level, etc. Showcasing this set of slides titled Digital Insurance Dashboard With Enrollment Status Icons PDF. The topics addressed in these templates are Digital Insurance Dashboard With Enrollment Status. All the content presented in this PPT design is completely editable. Download it and make adjustments in color, background, font etc. as per your unique business setting.

Dashboard For Web Development Project Performance Microsoft PDF
This slide depicts the dashboard for the web development, and it covers the details of yearly turnover, clients information, and revenues, analytics, and statistics of the organization.Deliver an awe inspiring pitch with this creative Dashboard For Web Development Project Performance Microsoft PDF bundle. Topics like Dashboard For Web Development Project Performance can be discussed with this completely editable template. It is available for immediate download depending on the needs and requirements of the user.
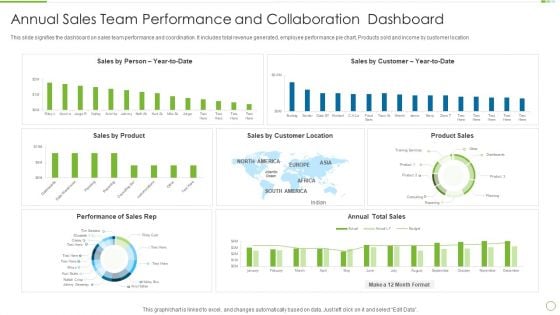
Annual Sales Team Performance And Collaboration Dashboard Themes PDF
This slide signifies the dashboard on sales team performance and coordination. It includes total revenue generated, employee performance pie chart, Products sold and income by customer location Showcasing this set of slides titled Annual Sales Team Performance And Collaboration Dashboard Themes PDF The topics addressed in these templates are Annual Sales, Team Performance, Collaboration Dashboard All the content presented in this PPT design is completely editable. Download it and make adjustments in color, background, font etc. as per your unique business setting.
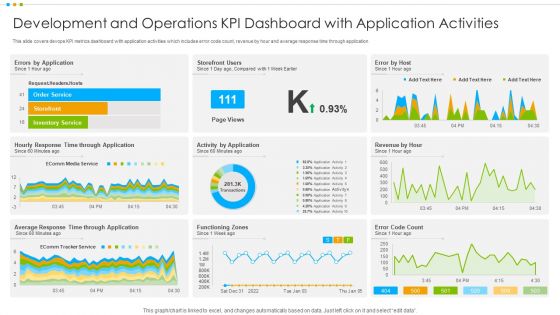
Development And Operations KPI Dashboard With Application Activities Information PDF
This slide covers devops KPI metrics dashboard with application activities which includes error code count, revenue by hour and average response time through application.Pitch your topic with ease and precision using this Development And Operations KPI Dashboard With Application Activities Information PDF This layout presents information on Development Operations Kpi Dashboard, Application Activities It is also available for immediate download and adjustment. So, changes can be made in the color, design, graphics or any other component to create a unique layout.
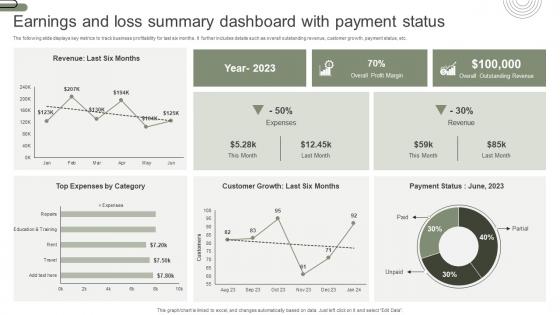
Earnings And Loss Summary Dashboard With Payment Status Elements Pdf
The following slide displays key metrics to track business profitability for last six months. It further includes details such as overall outstanding revenue, customer growth, payment status, etc. Pitch your topic with ease and precision using this Earnings And Loss Summary Dashboard With Payment Status Elements Pdf. This layout presents information on Earnings And Loss, Summary Dashboard, Payment Status. It is also available for immediate download and adjustment. So, changes can be made in the color, design, graphics or any other component to create a unique layout. The following slide displays key metrics to track business profitability for last six months. It further includes details such as overall outstanding revenue, customer growth, payment status, etc.
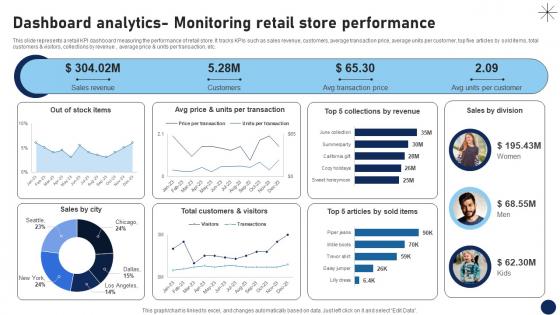
Dashboard Analytics Monitoring Retail Store Performance DT SS V
This slide represents a retail KPI dashboard measuring the performance of retail store. It tracks KPIs such as sales revenue, customers, average transaction price, average units per customer, top five articles by sold items, total customers and visitors, collections by revenue , average price and units per transaction, etc.Are you in need of a template that can accommodate all of your creative concepts This one is crafted professionally and can be altered to fit any style. Use it with Google Slides or PowerPoint. Include striking photographs, symbols, depictions, and other visuals. Fill, move around, or remove text boxes as desired. Test out color palettes and font mixtures. Edit and save your work, or work with colleagues. Download Dashboard Analytics Monitoring Retail Store Performance DT SS V and observe how to make your presentation outstanding. Give an impeccable presentation to your group and make your presentation unforgettable. This slide represents a retail KPI dashboard measuring the performance of retail store. It tracks KPIs such as sales revenue, customers, average transaction price, average units per customer, top five articles by sold items, total customers and visitors, collections by revenue , average price and units per transaction, etc.
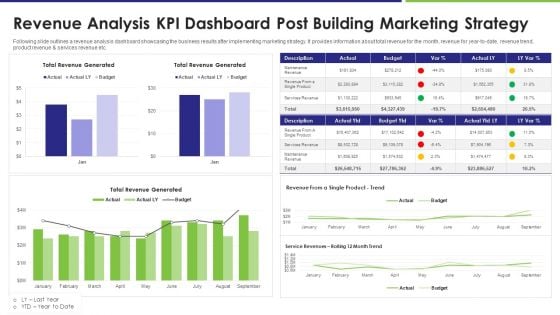
Revenue Analysis KPI Dashboard Post Building Marketing Strategy Infographics PDF
Following slide outlines a revenue analysis dashboard showcasing the business results after implementing marketing strategy. It provides information about total revenue for the month, revenue for year to date, revenue trend, product revenue and services revenue etc. Pitch your topic with ease and precision using this revenue analysis kpi dashboard post building marketing strategy infographics pdf. This layout presents information on revenue analysis kpi dashboard post building marketing strategy. It is also available for immediate download and adjustment. So, changes can be made in the color, design, graphics or any other component to create a unique layout.
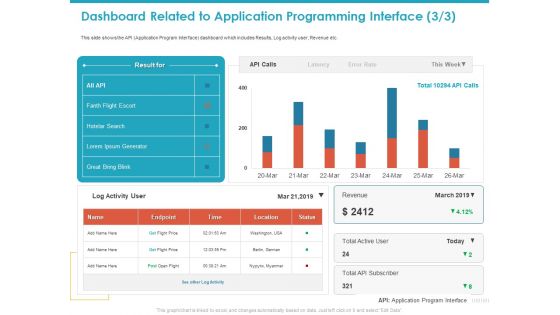
Dashboard Related To Application Programming Interface Status Slides PDF
This slide shows the API Application Program Interface dashboard which includes Results, Log activity user, Revenue etc. Deliver an awe-inspiring pitch with this creative dashboard related to application programming interface status slides pdf bundle. Topics like revenue, location, status, endpoint, time can be discussed with this completely editable template. It is available for immediate download depending on the needs and requirements of the user.
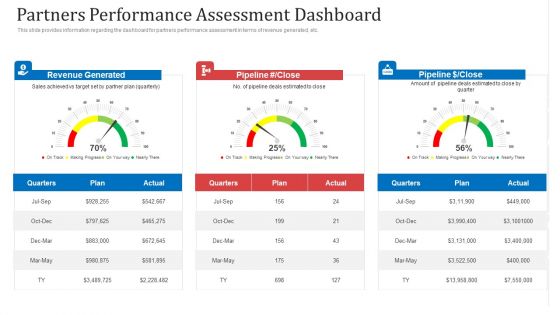
Partners Performance Assessment Dashboard Ppt File Format PDF
This slide provides information regarding the dashboard for partners performance assessment in terms of revenue generated, etc. Deliver an awe inspiring pitch with this creative partners performance assessment dashboard ppt file format pdf bundle. Topics like revenue generated, plan, sales can be discussed with this completely editable template. It is available for immediate download depending on the needs and requirements of the user.


 Continue with Email

 Home
Home


