Financial Dashboard
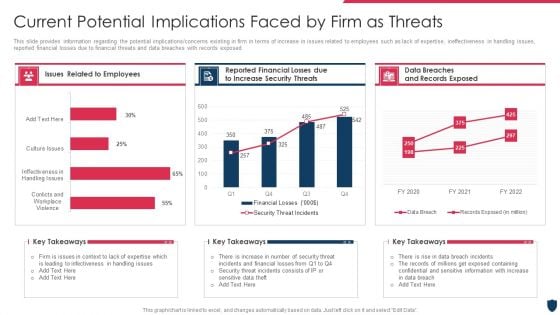
Cyber Safety Incident Management Current Potential Implications Faced By Firm As Threats Clipart PDF
This slide provides information regarding the potential implications or concerns existing in firm in terms of increase in issues related to employees such as lack of expertise, ineffectiveness in handling issues, reported financial losses due to financial threats and data breaches with records exposed. Deliver an awe inspiring pitch with this creative cyber safety incident management current potential implications faced by firm as threats clipart pdf bundle. Topics like issues related to employees, data breaches and records exposed, reported financial losses due to increase security threats can be discussed with this completely editable template. It is available for immediate download depending on the needs and requirements of the user.
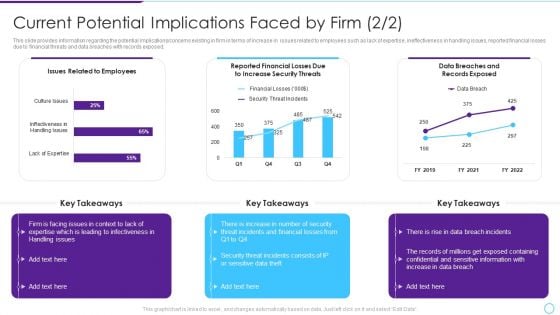
Current Potential Implications Faced By Firm Intelligent Infrastructure Rules PDF
This slide provides information regarding the potential implications or concerns existing in firm in terms of increase in issues related to employees such as lack of expertise, ineffectiveness in handling issues, reported financial losses due to financial threats and data breaches with records exposed. Deliver an awe inspiring pitch with this creative Current Potential Implications Faced By Firm Intelligent Infrastructure Rules PDF bundle. Topics like Issues Related To Employees, Reported Financial Losses, Due To Increase Security Threats, Data Breaches And can be discussed with this completely editable template. It is available for immediate download depending on the needs and requirements of the user.
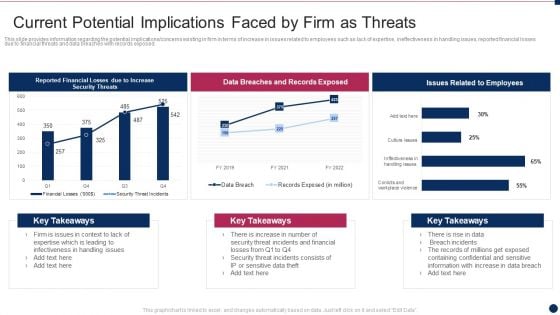
Threat Management At Workplace Current Potential Implications Faced By Firm As Threats Professional Pdf
This slide provides information regarding the potential implications concerns existing in firm in terms of increase in issues related to employees such as lack of expertise, ineffectiveness in handling issues, reported financial losses due to financial threats and data breaches with records exposed. Deliver and pitch your topic in the best possible manner with this threat management at workplace current potential implications faced by firm as threats professional pdf. Use them to share invaluable insights on data breaches and records exposed, breach incidents, financial losses and impress your audience. This template can be altered and modified as per your expectations. So, grab it now.
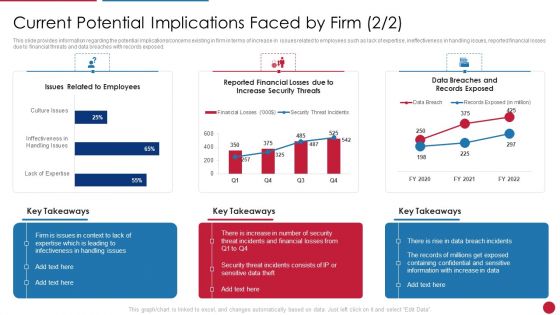
Facilitating IT Intelligence Architecture Current Potential Implications Faced By Firm Slides PDF
This slide provides information regarding the potential implications or poncerns existing in firm in terms of increase in issues related to employees such as lack of expertise, ineffectiveness in handling issues, reported financial losses due to financial threats and data breaches with records exposed. Deliver an awe inspiring pitch with this creative Facilitating IT Intelligence Architecture Current Potential Implications Faced By Firm Slides PDF bundle. Topics like Infectiveness In Handling, Expertise Which Is Leading, Incidents And Financial can be discussed with this completely editable template. It is available for immediate download depending on the needs and requirements of the user.
Business Planning And Strategy Playbook Company Overview Contd Ppt PowerPoint Presentation Infographic Template Rules PDF
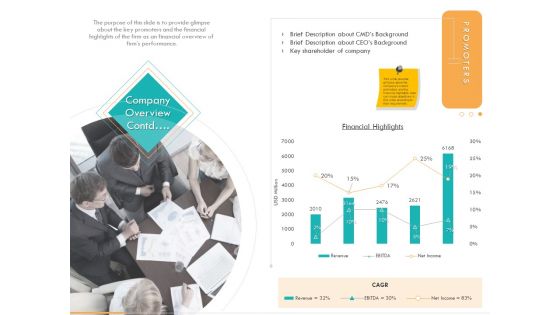
The purpose of this slide is to provide glimpse about the key promoters and the financial highlights of the firm as an financial overview of firms performance. Deliver and pitch your topic in the best possible manner with this business planning and strategy playbook company overview contd ppt powerpoint presentation infographic template rules pdf. Use them to share invaluable insights on revenue, ebitda, net income, financial highlights and impress your audience. This template can be altered and modified as per your expectations. So, grab it now.

Sharing Annual Report For Shareholder Communication Comprehensive Strategic Plan Template Pdf
This slide showcases overview annual report that can be uploaded by organization to engage shareholders. It also showcases key components of annual report which are notes to financial statements, financial highlights, cash flow and income statement. The Sharing Annual Report For Shareholder Communication Comprehensive Strategic Plan Template Pdf is a compilation of the most recent design trends as a series of slides. It is suitable for any subject or industry presentation, containing attractive visuals and photo spots for businesses to clearly express their messages. This template contains a variety of slides for the user to input data, such as structures to contrast two elements, bullet points, and slides for written information. Slidegeeks is prepared to create an impression. This slide showcases overview annual report that can be uploaded by organization to engage shareholders. It also showcases key components of annual report which are notes to financial statements, financial highlights, cash flow and income statement.
Business Diagram Big Data From Descriptive To Predictive Presentation Template
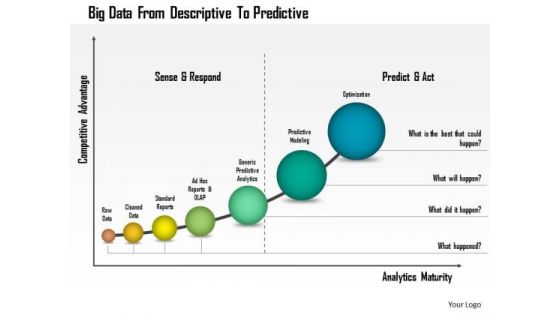
This business diagram has been designed with graphic of linear bar graph. This growing bar graph depicts the concept of big data analysis. Use this professional diagram for your financial and business analysis.
Business Diagram Diagram For Visual Data Display Presentation Template
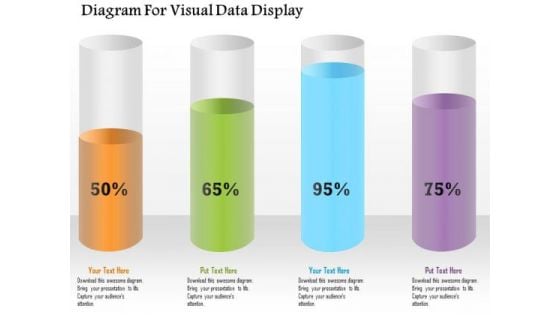
Four colored cylindrical bars with percentage values are used to design this power point template. This diagram slide helps to display financial data analysis. Use this diagram for your business and finance related presentations.
Quarterly Report Depicting Income And Cash Flow Statement KPIS Quarterly Report Ppt Example
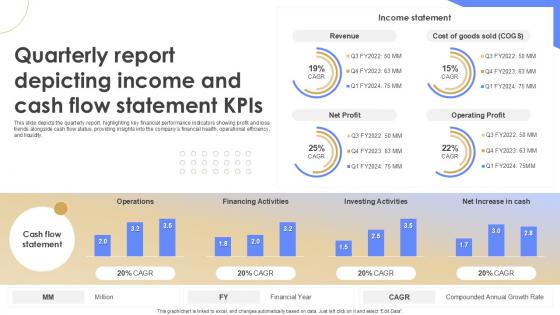
This slide depicts the quarterly report, highlighting key financial performance indicators showing profit and loss trends alongside cash flow status, providing insights into the companys financial health, operational efficiency, and liquidity. Do you have an important presentation coming up Are you looking for something that will make your presentation stand out from the rest Look no further than Quarterly Report Depicting Income And Cash Flow Statement KPIS Quarterly Report Ppt Example With our professional designs, you can trust that your presentation will pop and make delivering it a smooth process. And with Slidegeeks, you can trust that your presentation will be unique and memorable. So why wait Grab Quarterly Report Depicting Income And Cash Flow Statement KPIS Quarterly Report Ppt Example today and make your presentation stand out from the rest This slide depicts the quarterly report, highlighting key financial performance indicators showing profit and loss trends alongside cash flow status, providing insights into the companys financial health, operational efficiency, and liquidity.
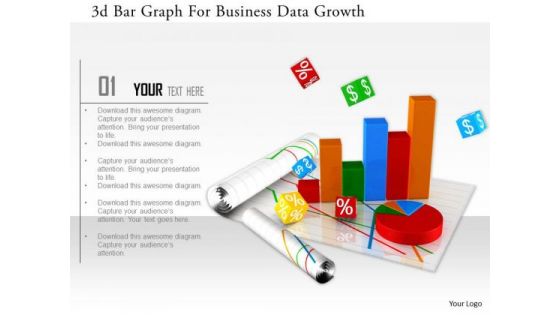
Stock Photo 3d Bar Graph For Business Data Growth Image Graphics For PowerPoint Slide
This image slide has graphics of financial charts and reports. This contains bar graph and pie chart to present business reports. Build an innovative presentations using this professional image slide.

Market Competitiveness Template 1 Ppt PowerPoint Presentation Slides Template
This is a market competitiveness template 1 ppt powerpoint presentation slides template. This is a three stage process. The stages in this process are financial position, advertising, market share, brand image, customer loyalty.
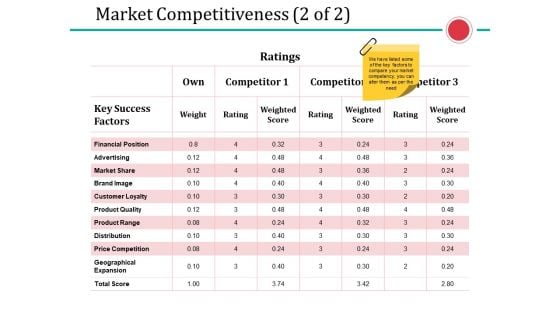
Market Competitiveness Template 2 Ppt PowerPoint Presentation Portfolio Graphic Tips
This is a market competitiveness template 2 ppt powerpoint presentation portfolio graphic tips. This is a three stage process. The stages in this process are financial position, advertising, market share, brand image, customer loyalty.
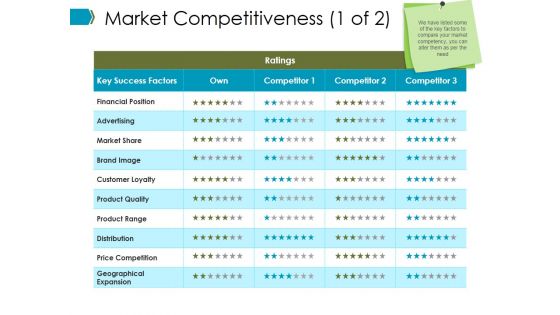
Market Competitiveness Template Ppt PowerPoint Presentation Summary Ideas
This is a market competitiveness template ppt powerpoint presentation summary ideas. This is a three stage process. The stages in this process are financial position, advertising, market share, brand image, customer loyalty.
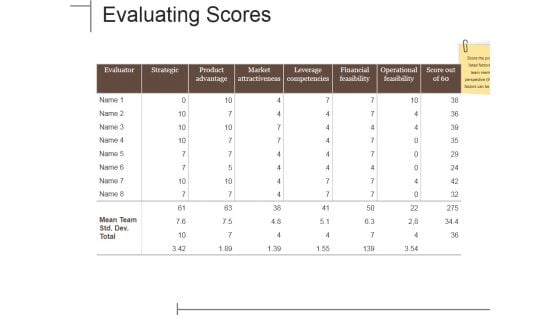
Evaluating Scores Ppt PowerPoint Presentation Infographics Rules
This is a evaluating scores ppt powerpoint presentation infographics rules. This is a seven stage process. The stages in this process are strategic, product advantage, market attractiveness, leverage competencies, financial feasibility, operational feasibility.
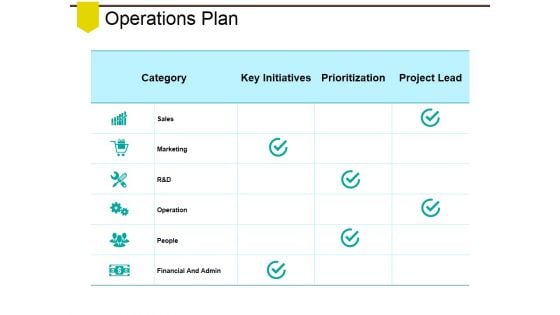
Operations Plan Ppt PowerPoint Presentation Model Samples
This is a operations plan ppt powerpoint presentation model samples. This is a three stage process. The stages in this process are sales, marketing, operation, people, financial and admin.
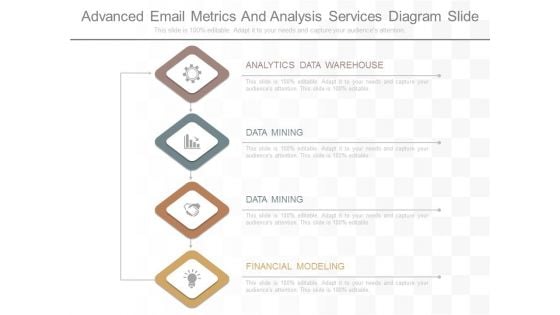
Advanced Email Metrics And Analysis Services Diagram Slide
This is a advanced email metrics and analysis services diagram slide. This is a four stage process. The stages in this process are analytics data warehouse, data mining, financial modeling.
Customer Service Focus Ppt PowerPoint Presentation Model Icon
This is a customer service focus ppt powerpoint presentation model icon. This is a four stage process. The stages in this process are marketing automation, sales force automation, customer service automation, financial system integration.
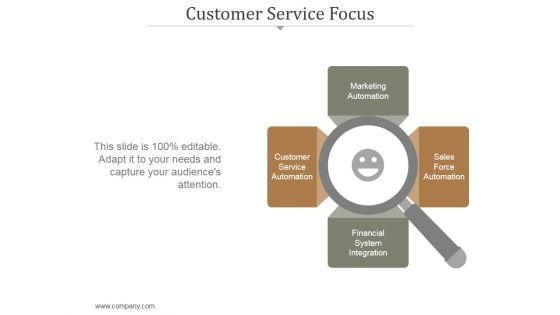
Customer Service Focus Ppt PowerPoint Presentation Model
This is a customer service focus ppt powerpoint presentation model. This is a one stage process. The stages in this process are marketing automation, customer service automation, sales force automation, financial system integration.
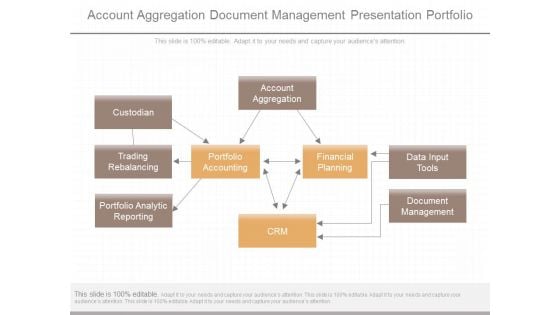
Account Aggregation Document Management Presentation Portfolio
This is a account aggregation document management presentation portfolio. This is a nine stage process. The stages in this process are custodian, trading rebalancing, portfolio analytic reporting, account aggregation, data input tools, document management, portfolio accounting, financial planning, crm.
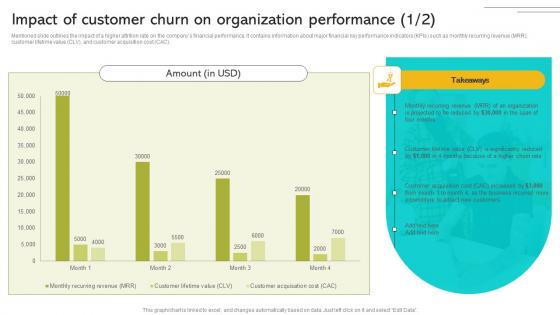
Implementing Strategies To Enhance Impact Of Customer Churn On Organization Performance Infographics PDF
Mentioned slide outlines the impact of a higher attrition rate on the companys financial performance. It contains information about major financial key performance indicators KPIs such as monthly recurring revenue MRR, customer lifetime value CLV, and customer acquisition cost CAC. Make sure to capture your audiences attention in your business displays with our gratis customizable Implementing Strategies To Enhance Impact Of Customer Churn On Organization Performance Infographics PDF These are great for business strategies, office conferences, capital raising or task suggestions. If you desire to acquire more customers for your tech business and ensure they stay satisfied, create your own sales presentation with these plain slides. Mentioned slide outlines the impact of a higher attrition rate on the companys financial performance. It contains information about major financial key performance indicators KPIs such as monthly recurring revenue MRR, customer lifetime value CLV, and customer acquisition cost CAC.
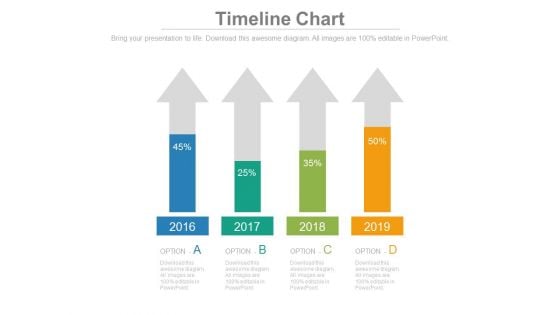
Four Arrows With Percentage Data Analysis Powerpoint Slides
This timeline template can be used for multiple purposes including financial planning, new milestones and tasks. It contains four upward arrows with percentage values. Download this PowerPoint timeline template to make impressive presentations.
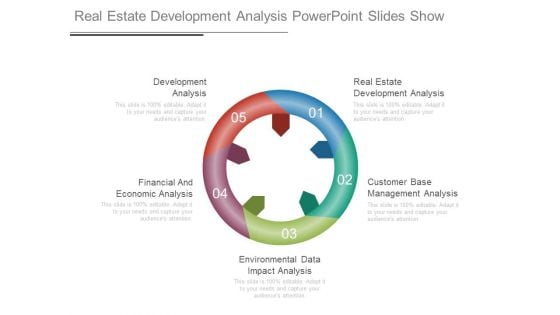
Real Estate Development Analysis Powerpoint Slides Show
This is a real estate development analysis powerpoint slides show. This is a five stage process. The stages in this process are development analysis, financial and economic analysis, environmental data impact analysis, customer base management analysis, real estate development analysis.
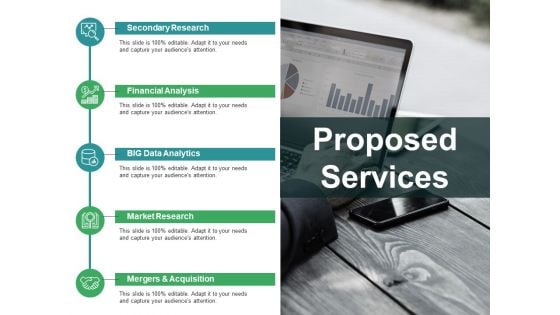
Proposed Services Ppt PowerPoint Presentation Pictures Backgrounds
This is a proposed services ppt powerpoint presentation pictures backgrounds. This is a five stage process. The stages in this process are secondary research, financial analysis, big data analytics, market research.
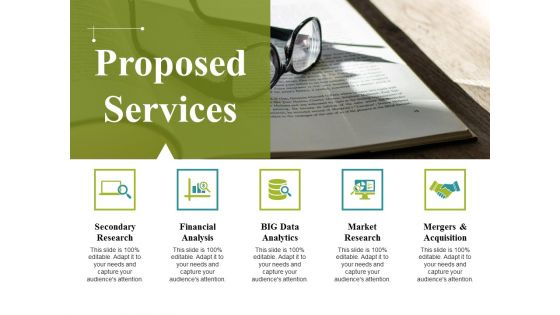
Proposed Services Ppt PowerPoint Presentation Summary Graphics
This is a proposed services ppt powerpoint presentation summary graphics. This is a five stage process. The stages in this process are secondary research, financial analysis, big data analytics, market research, mergers and acquisition.
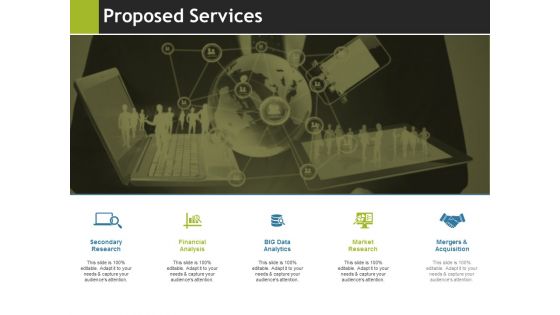
Proposed Services Ppt PowerPoint Presentation Model Samples
This is a proposed services ppt powerpoint presentation model samples. This is a five stage process. The stages in this process are secondary research, financial analysis, big data analytics, market research, mergers and acquisition.
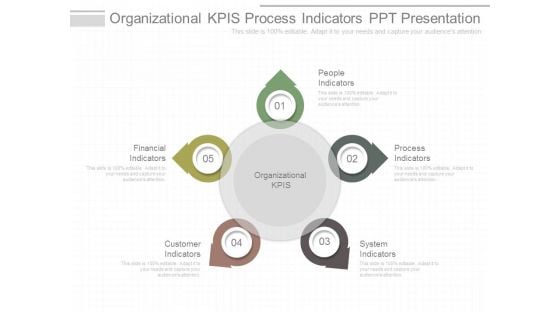
Organizational Kpis Process Indicators Ppt Presentation
This is a organizational kpis process indicators ppt presentation. This is a five stage process. The stages in this process are people indicators, process indicators, system indicators, customer indicators, financial indicators, organizational kpis.
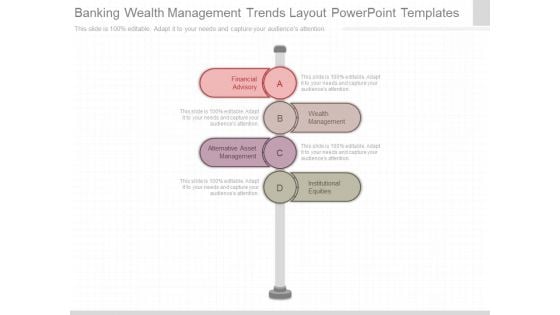
Banking Wealth Management Trends Layout Powerpoint Templates
This is a banking wealth management trends layout powerpoint templates. This is a four stage process. The stages in this process are financial advisory, wealth management, alternative asset management, institutional equities.
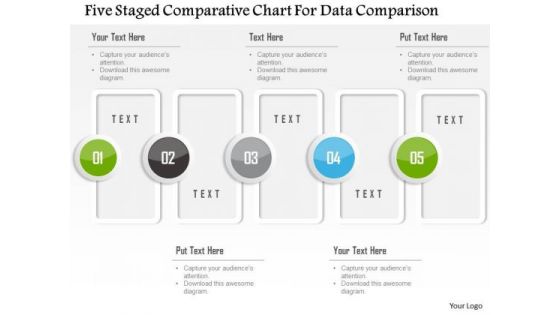
Business Diagram Five Staged Comparative Chart For Data Comparison Presentation Template
Five staged comparative chart has been used to design this power point template. This PPT contains the concept of data comparison. Use this PPT for your business and finance based data comparison in any financial presentation.
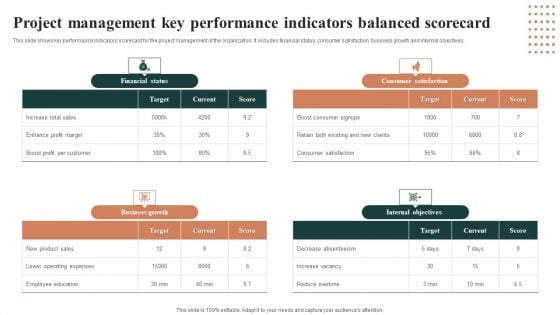
Project Management Key Performance Indicators Balanced Scorecard Introduction PDF
This slide shows key performance indicators scorecard for the project management of the organization. It includes financial status, consumer satisfaction, business growth and internal objectives. Pitch your topic with ease and precision using this Project Management Key Performance Indicators Balanced Scorecard Introduction PDF. This layout presents information on Financial Status, Business Growth, Consumer Satisfaction. It is also available for immediate download and adjustment. So, changes can be made in the color, design, graphics or any other component to create a unique layout.
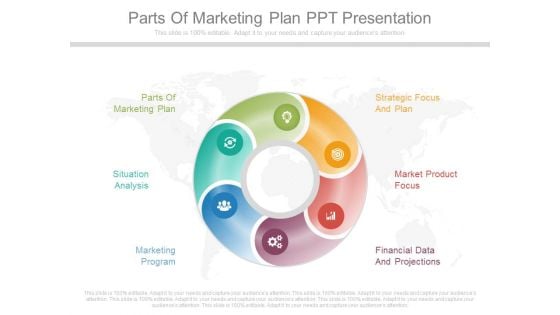
Parts Of Marketing Plan Ppt Presentation
This is a parts of marketing plan ppt presentation. This is a six stage process. The stages in this process are parts of marketing plan, strategic focus and plan, situation analysis, market product focus, marketing program, financial data and projections.
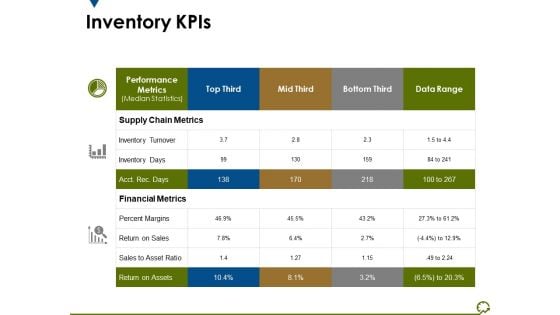
Inventory Kpis Ppt PowerPoint Presentation Infographic Template Display
This is a inventory kpis ppt powerpoint presentation infographic template display. This is a three stage process. The stages in this process are supply chain metrics, financial metrics, percent margins, return on assets, inventory turnover.
Economic Trends Analysis Dollar Sign With Four Arrows Ppt PowerPoint Presentation Layouts Icons
This is a economic trends analysis dollar sign with four arrows ppt powerpoint presentation layouts icons. This is a four stage process. The stages in this process are stock market, financial markets, bull market.

Annual Report Project Plan Ppt Slide
This is a annual report project plan ppt slide. This is a one stage process. The stages in this process are financial statement, 10 k report, directors report, green annual report, auditors report, grey literature.

Sales And Marketing Summary Annual Report Sample Ppt
This is a sales and marketing summary annual report sample ppt. This is a one stage process. The stages in this process are financial statement, 10 k report, directors report, auditors report.

Stock Market Trend Dollar Sign On Bar Graph Ppt Powerpoint Presentation Show Deck
This is a stock market trend dollar sign on bar graph ppt powerpoint presentation show deck. This is a four stage process. The stages in this process are stock market, financial market, bull market.

Stock Market Trends Of Five Countries Ppt Powerpoint Presentation Model Guidelines
This is a stock market trends of five countries ppt powerpoint presentation model guidelines. This is a four stage process. The stages in this process are stock market, financial market, bull market.

News Report Business PowerPoint Themes And PowerPoint Slides 0511
Microsoft PowerPoint Theme and Slide with financial news report Forge ahead with our News Report Business PowerPoint Themes And PowerPoint Slides 0511. Download without worries with our money back guaranteee.

Stock Trading Graph With Bull Showing Upward Trend Ppt Powerpoint Presentation Pictures Outfit
This is a stock trading graph with bull showing upward trend ppt powerpoint presentation pictures outfit. This is a four stage process. The stages in this process are stock market, financial market, bull market.

News Report Business PowerPoint Templates And PowerPoint Backgrounds 0511
Microsoft PowerPoint Template and Background with financial news report Help them fathom the depths of your mind. Give them a dive with our News Report Business PowerPoint Templates And PowerPoint Backgrounds 0511.
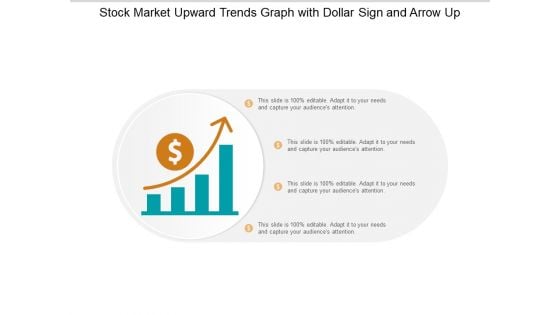
Stock Market Upward Trends Graph With Dollar Sign And Arrow Up Ppt PowerPoint Presentation Professional Graphics Download
This is a stock market upward trends graph with dollar sign and arrow up ppt powerpoint presentation professional graphics download. This is a four stage process. The stages in this process are stock market, financial markets, bull market.
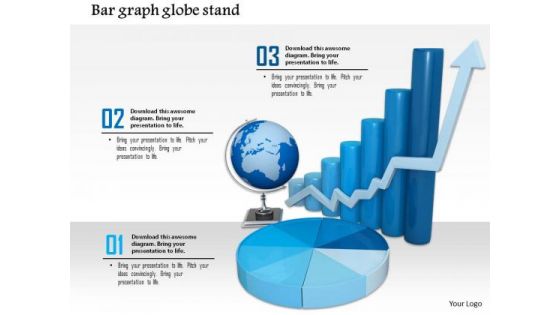
Stock Photo Graphics For Business Reports And Charts PowerPoint Slide
This image contains graphics of business reports and charts. Download this image for business and sales presentations where you have to focus on financial growth. Dazzle the audience with your thoughts.
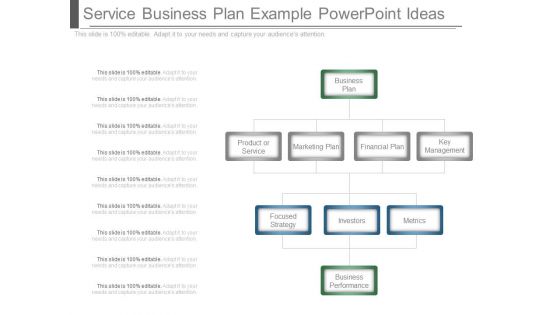
Service Business Plan Example Powerpoint Ideas
This is a service business plan example powerpoint ideas. This is a nine stage process. The stages in this process are business plan, product or service, marketing plan, financial plan, key management, focused strategy, investors, metrics.
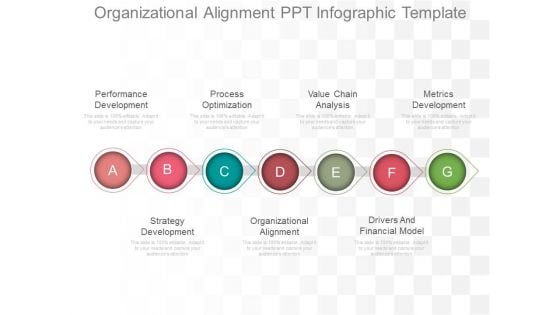
Organizational Alignment Ppt Infographic Template
This is a organizational alignment ppt infographic template. This is a seven stage process. The stages in this process are performance development, process optimization, value chain analysis, metrics development, strategy development, organizational alignment, drivers and financial model.
Business Diagram Four Stages Process With Percentage Presentation Template
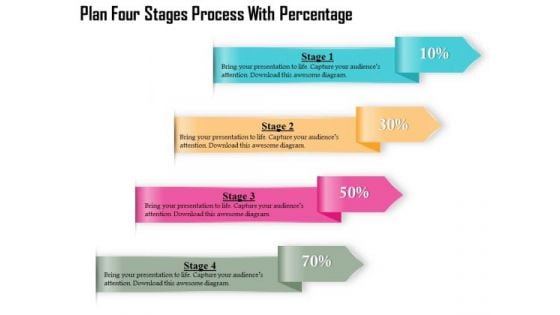
Four multicolored tags in vertical order has been used to decorate this business diagram. This diagram contains the concept of financial data display with percent values. This diagram can be used for management and finance related presentations.

Business Diagram Three Stages Process Percentage Presentation Template
Three multicolored tags in vertical order has been used to decorate this business diagram. This diagram contains the concept of financial data display with percent values. This diagram can be used for management and finance related presentations.
Application Of Real Time Analytics Topics PDF
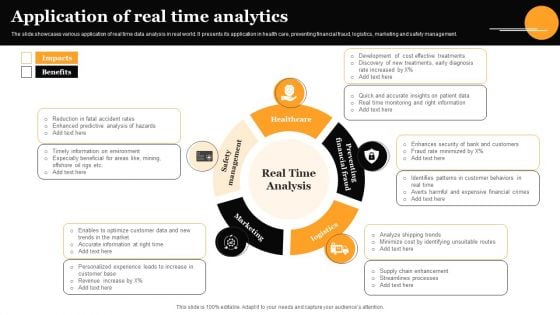
The slide showcases various application of real time data analysis in real world. It presents its application in health care, preventing financial fraud, logistics, marketing and safety management. Presenting Application Of Real Time Analytics Topics PDF to dispense important information. This template comprises five stages. It also presents valuable insights into the topics including Healthcare, Preventing Financial Fraud, Logistics. This is a completely customizable PowerPoint theme that can be put to use immediately. So, download it and address the topic impactfully.
Stock Market Survey Reporting With Pie Chat And Bar Graph Ppt PowerPoint Presentation Infographic Template Example 2015
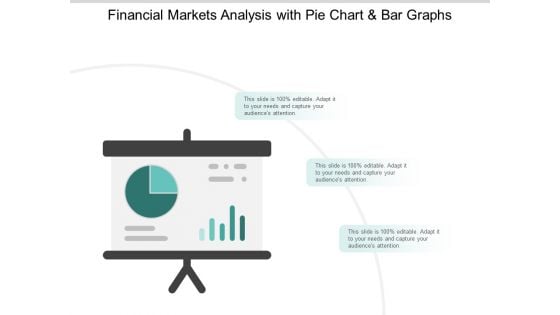
This is a stock market survey reporting with pie chat and bar graph ppt powerpoint presentation infographic template example 2015. This is a three stage process. The stages in this process are stock market, financial markets, bull market.
Benefits Of Big Data Ppt PowerPoint Presentation Slides Layout Ideas
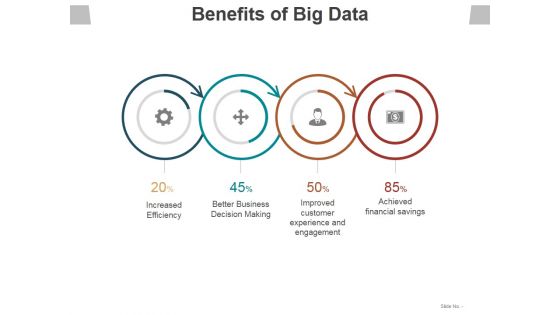
This is a benefits of big data ppt powerpoint presentation slides layout ideas. This is a four stage process. The stages in this process are increased efficiency, better business decision making, improved customer experience and engagement, achieved financial savings.
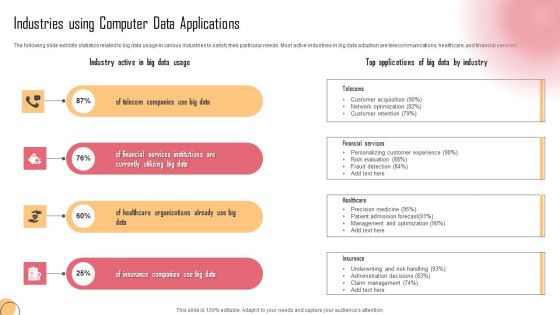
Industries Using Computer Data Applications Professional PDF
The following slide exhibits statistics related to big data usage in various industries to satisfy their particular needs. Most active industries in big data adoption are telecommunications, healthcare, and financial services. Presenting Industries Using Computer Data Applications Professional PDF to dispense important information. This template comprises four stages. It also presents valuable insights into the topics including Telecoms, Financial Services, Healthcare. This is a completely customizable PowerPoint theme that can be put to use immediately. So, download it and address the topic impactfully.
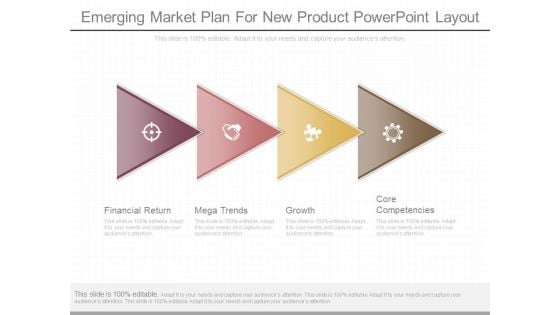
Emerging Market Plan For New Product Powerpoint Layout
This is a emerging market plan for new product powerpoint layout. This is a four stage process. The stages in this process are financial return, mega trends, growth, core competencies.
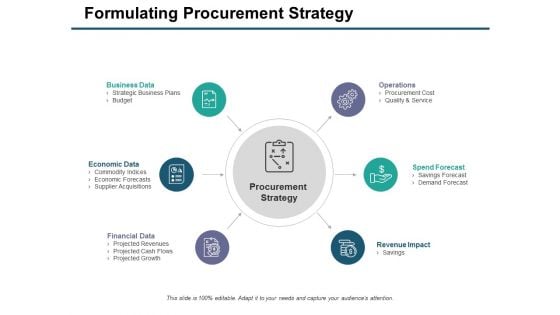
Formulating Procurement Strategy Ppt PowerPoint Presentation Model Visual Aids
This is a formulating procurement strategy ppt powerpoint presentation model visual aids. This is a six stage process. The stages in this process are business data, operations, revenue impact, financial data, economic data.

Table Of Content Template 2 Ppt PowerPoint Presentation Infographics Professional
This is a table of content template 2 ppt powerpoint presentation infographics professional. This is a six stage process. The stages in this process are financial performance, client and project updates, competitors analysis, future roadmap, csr miscellaneous activities.
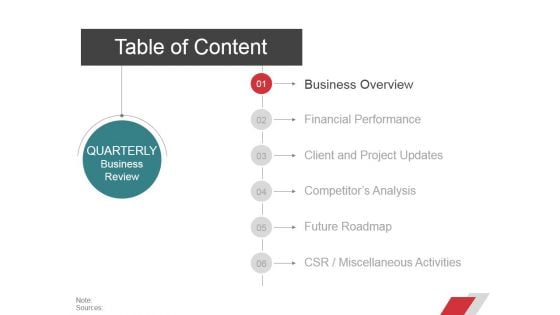
Table Of Content Template Ppt PowerPoint Presentation Infographic Template Summary
This is a table of content template ppt powerpoint presentation infographic template summary. This is a six stage process. The stages in this process are business overview, financial performance, client and project updates, competitors analysis, future roadmap.
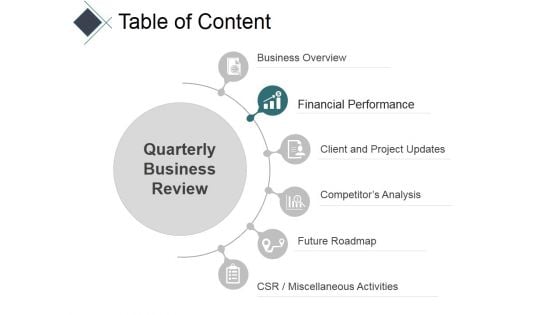
Table Of Content Template 1 Ppt PowerPoint Presentation Infographics Display
This is a table of content template 1 ppt powerpoint presentation infographics display. This is a six stage process. The stages in this process are business overview, financial performance, client and project updates, competitors analysis, future roadmap.
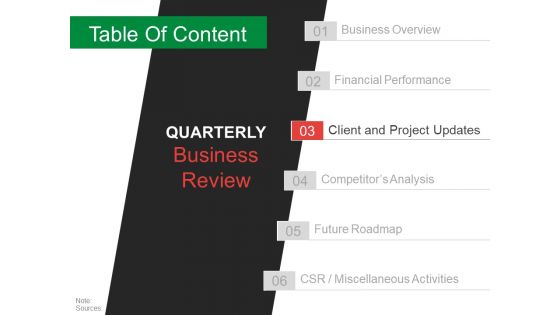
Table Of Content Template 4 Ppt PowerPoint Presentation Infographic Template
This is a table of content template 4 ppt powerpoint presentation infographic template. This is a six stage process. The stages in this process are business overview, financial performance, client and project updates, competitor s analysis, future roadmap.
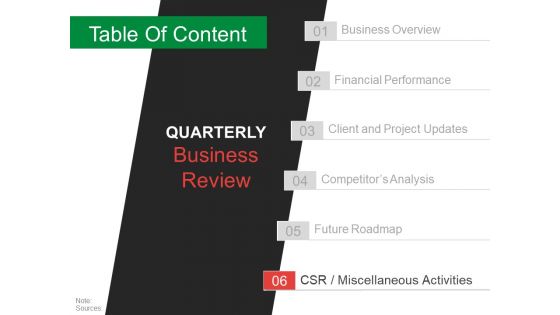
Table Of Content Template 7 Ppt PowerPoint Presentation Professional Infographics
This is a table of content template 7 ppt powerpoint presentation professional infographics. This is a six stage process. The stages in this process are business overview, financial performance, client and project updates, competitor s analysis, future roadmap.
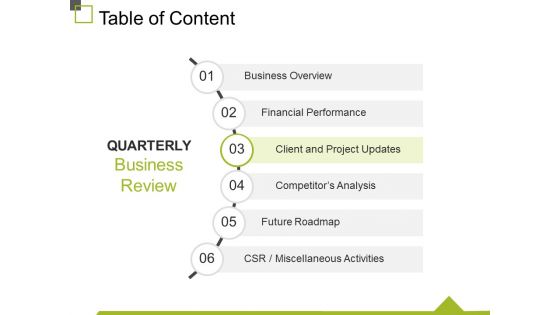
Table Of Content Template 4 Ppt PowerPoint Presentation Infographics Maker
This is a table of content template 1 ppt powerpoint presentation outline template. This is a six stage process. The stages in this process are business overview, financial performance, client and project updates, competitor s analysis, future roadmap.
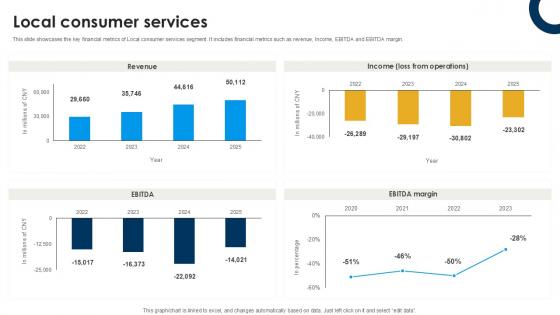
Local Consumer Services International Trade Of Products And Services PPT Example CP SS V
This slide showcases the key financial metrics of Local consumer services segment. It includes financial metrics such as revenue, Income, EBITDA and EBITDA margin. Welcome to our selection of the Local Consumer Services International Trade Of Products And Services PPT Example CP SS V. These are designed to help you showcase your creativity and bring your sphere to life. Planning and Innovation are essential for any business that is just starting out. This collection contains the designs that you need for your everyday presentations. All of our PowerPoints are 100Percent editable, so you can customize them to suit your needs. This multi-purpose template can be used in various situations. Grab these presentation templates today. This slide showcases the key financial metrics of Local consumer services segment. It includes financial metrics such as revenue, Income, EBITDA and EBITDA margin.
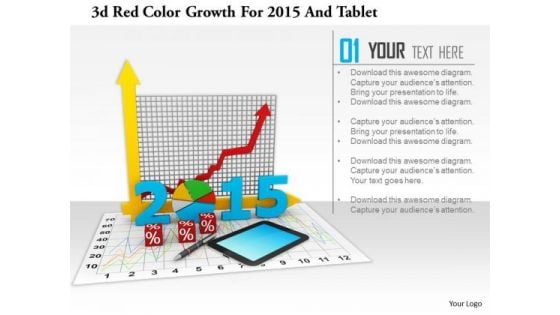
Stock Photo 3d Red Color Growth For 2015 And Tablet PowerPoint Slide
This image slide has graphics of financial charts and reports. This contains bar graph and pie chart to present business reports. Build an innovative presentation using this professional image slide.
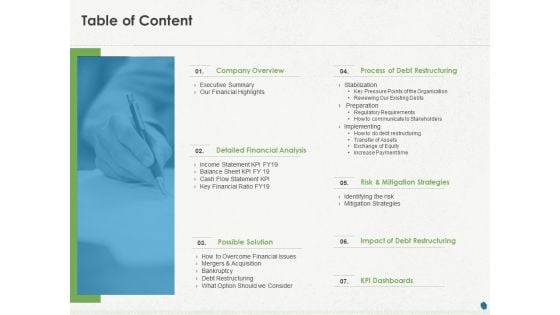
Distressed Debt Refinancing For Organizaton Table Of Content Ppt PowerPoint Presentation Professional Graphics Pictures PDF
Presenting this set of slides with name distressed debt refinancing for organizaton table of content ppt powerpoint presentation professional graphics pictures pdf. This is a seven stage process. The stages in this process are company overview, detailed financial analysis, possible solution, process of debt restructuring, risk and mitigation strategies, impact of debt restructuring, kpi dashboards . This is a completely editable PowerPoint presentation and is available for immediate download. Download now and impress your audience.


 Continue with Email

 Home
Home


