Financial Dashboard
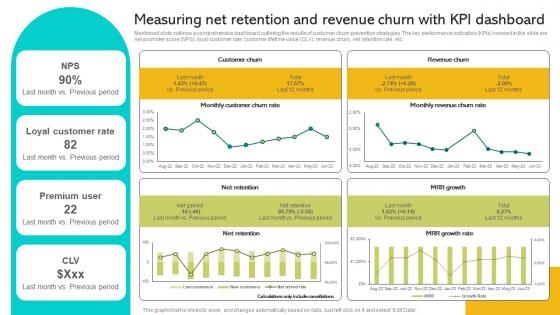
Implementing Strategies To Enhance Measuring Net Retention And Revenue Churn With Kpi Brochure PDF
Mentioned slide outlines a comprehensive dashboard outlining the results of customer churn prevention strategies. The key performance indicators KPIs covered in the slide are net promoter score NPS, loyal customer rate, customer lifetime value CLV, revenue churn, net retention rate, etc. Retrieve professionally designed ng Strategies To Enhance Measuring Net Retention And Revenue Churn With Kpi Brochure PDF to effectively convey your message and captivate your listeners. Save time by selecting pre-made slideshows that are appropriate for various topics, from business to educational purposes. These themes come in many different styles, from creative to corporate, and all of them are easily adjustable and can be edited quickly. Access them as PowerPoint templates or as Google Slides themes. You do not have to go on a hunt for the perfect presentation because Slidegeeks got you covered from everywhere. Mentioned slide outlines a comprehensive dashboard outlining the results of customer churn prevention strategies. The key performance indicators KPIs covered in the slide are net promoter score NPS, loyal customer rate, customer lifetime value CLV, revenue churn, net retention rate, etc.
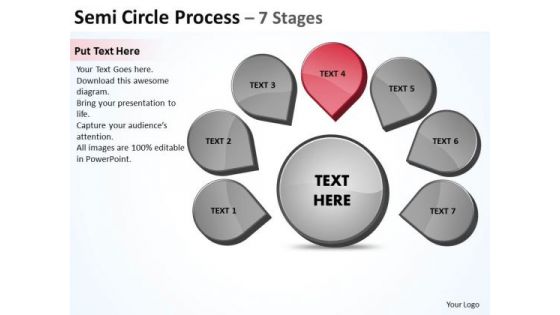
Seven Steps Business PowerPoint Templates Download Strategy Ppt Venn Diagram Slides
We present our seven steps business powerpoint templates download strategy ppt Venn Diagram Slides.Present our Process and Flows PowerPoint Templates because your listeners do not have to put on their thinking caps. Download our Finance PowerPoint Templates because you envisage some areas of difficulty in the near future. The overall financial situation could be a source of worry. Use our Circle Charts PowerPoint Templates because the Venn graphic comprising interlinking circles geometrically demonstate how various functions operating independantly, to a large extent, are essentially interdependant. Download and present our Shapes PowerPoint Templates because there are so many different pieces to the puzzle. Use our Marketing PowerPoint Templates because networking is an imperative in todays world. You need to access the views of others. Similarly you need to give access to them of your abilities.Use these PowerPoint slides for presentations relating to Business, chart, color, concept, connect, connection, corporate, data, design, diagram, financial, flow, flowchart, glassy, glossy, group, important, organize, plan, process, teamwork. The prominent colors used in the PowerPoint template are Pink, Gray, White. The feedback we get is that our seven steps business powerpoint templates download strategy ppt Venn Diagram Slides are Wistful. Customers tell us our connect PowerPoint templates and PPT Slides are designed by professionals Professionals tell us our seven steps business powerpoint templates download strategy ppt Venn Diagram Slides are Glamorous. Customers tell us our data PowerPoint templates and PPT Slides help you meet deadlines which are an element of today's workplace. Just browse and pick the slides that appeal to your intuitive senses. Use our seven steps business powerpoint templates download strategy ppt Venn Diagram Slides are the best it can get when it comes to presenting. Professionals tell us our design PowerPoint templates and PPT Slides are Fancy. Your thoughts will be engraved in the minds of your audience. Our Seven Steps Business PowerPoint Templates Download Strategy Ppt Venn Diagram Slides will etch them in.
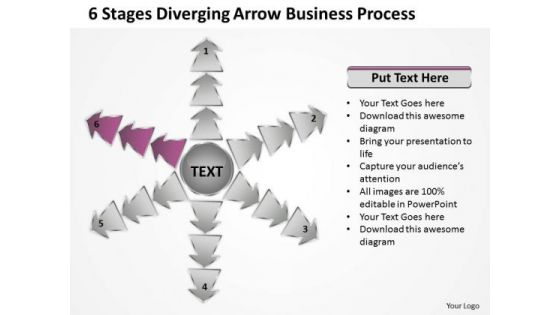
6 Stages Diverging Arrow Business Process Circular Spoke Network PowerPoint Template
We present our 6 stages diverging arrow business process Circular Spoke Network PowerPoint template.Download our Marketing PowerPoint Templates because Our PowerPoint Templates and Slides will let you Leave a lasting impression to your audiences. They possess an inherent longstanding recall factor. Download our Shapes PowerPoint Templates because you can Adorn them with your ideas and thoughts. Present our Arrows PowerPoint Templates because this slide brings grey areas to the table and explain in detail you assessment of the need for care to ensure continued smooth progress. Present our Business PowerPoint Templates because the fruits of your labour are beginning to show.Enlighten them on the great plans you have for their enjoyment. Use our Process and Flows PowerPoint Templates because you can Adorn them with your ideas and thoughts.Use these PowerPoint slides for presentations relating to Arrows, Business, Chart, Cyclic, Data, Diagram, Financial, Goal, Graph, Illustration, Info, Information, Marketing, Model, Option, Part, Pie, Presentation, Process, Result, Sphere, Statistics. The prominent colors used in the PowerPoint template are Purple, Gray, Black. The feedback we get is that our 6 stages diverging arrow business process Circular Spoke Network PowerPoint template will make the presenter successul in his career/life. People tell us our Data PowerPoint templates and PPT Slides are Endearing. Presenters tell us our 6 stages diverging arrow business process Circular Spoke Network PowerPoint template are Spiffy. Use our Cyclic PowerPoint templates and PPT Slides are Appealing. Use our 6 stages diverging arrow business process Circular Spoke Network PowerPoint template are Fancy. Use our Financial PowerPoint templates and PPT Slides are Appealing. Regain control with our 6 Stages Diverging Arrow Business Process Circular Spoke Network PowerPoint Template. Download without worries with our money back guaranteee.
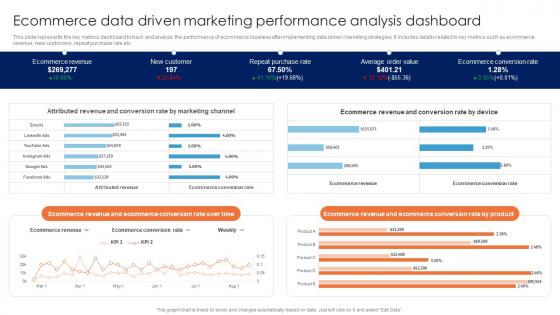
Ecommerce Data Driven Marketing Performance Guide For Data Driven Advertising Brochure Pdf
This slide represents the key metrics dashboard to track and analyze the performance of ecommerce business after implementing data driven marketing strategies. It includes details related to key metrics such as ecommerce revenue, new customers, repeat purchase rate etc.Here you can discover an assortment of the finest PowerPoint and Google Slides templates. With these templates, you can create presentations for a variety of purposes while simultaneously providing your audience with an eye-catching visual experience. Download Ecommerce Data Driven Marketing Performance Guide For Data Driven Advertising Brochure Pdf to deliver an impeccable presentation. These templates will make your job of preparing presentations much quicker, yet still, maintain a high level of quality. Slidegeeks has experienced researchers who prepare these templates and write high-quality content for you. Later on, you can personalize the content by editing the Ecommerce Data Driven Marketing Performance Guide For Data Driven Advertising Brochure Pdf. This slide represents the key metrics dashboard to track and analyze the performance of ecommerce business after implementing data driven marketing strategies. It includes details related to key metrics such as ecommerce revenue, new customers, repeat purchase rate etc.
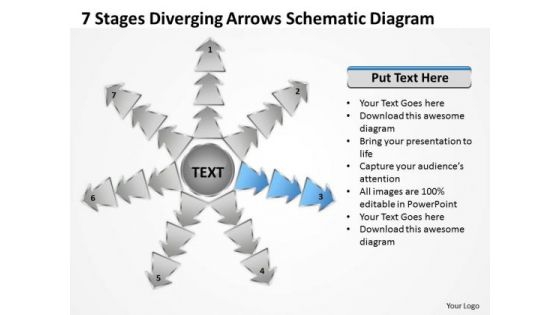
7 Stages Diverging Arrows Schematic Diagram Ppt Charts And Networks PowerPoint Slide
We present our 7 stages diverging arrows schematic diagram ppt Charts and Networks PowerPoint Slide.Use our Marketing PowerPoint Templates because you can Break it all down to Key Result Areas. Use our Shapes PowerPoint Templates because this diagram is designed to help your audience to develop their thoughts along the way. Use our Arrows PowerPoint Templates because this slide illuminates the spiritual brilliance of Jesus and showers the love for mankind he showed even while being crucified. Use our Business PowerPoint Templates because you can Lead your flock steadily to greater heights. Look around at the vast potential of achievement around you. Use our Process and Flows PowerPoint Templates because you can Highlight the key components of your entire manufacturing/ business process.Use these PowerPoint slides for presentations relating to Arrows, Business, Chart, Cyclic, Data, Diagram, Financial, Goal, Graph, Illustration, Info, Information, Marketing, Model, Option, Part, Pie, Presentation, Process, Result, Sphere, Statistics. The prominent colors used in the PowerPoint template are Blue, Gray, Black. The feedback we get is that our 7 stages diverging arrows schematic diagram ppt Charts and Networks PowerPoint Slide are Fashionable. People tell us our Data PowerPoint templates and PPT Slides are Perfect. Presenters tell us our 7 stages diverging arrows schematic diagram ppt Charts and Networks PowerPoint Slide will make the presenter successul in his career/life. Use our Goal PowerPoint templates and PPT Slides are Bold. Use our 7 stages diverging arrows schematic diagram ppt Charts and Networks PowerPoint Slide are Spiffy. Use our Financial PowerPoint templates and PPT Slides are Functional. Feather your nest with our 7 Stages Diverging Arrows Schematic Diagram Ppt Charts And Networks PowerPoint Slide. Your thoughts will evolve in a comfortable climate.
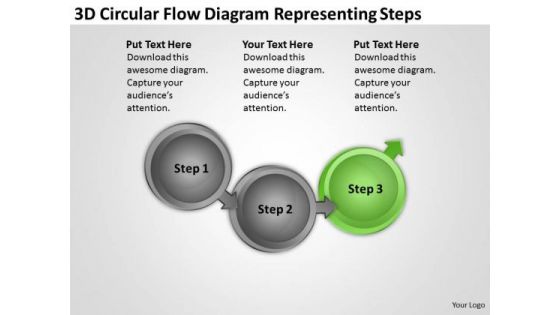
3d Circular Flow Diagram Representing Steps Ppt Score Business Plan Template PowerPoint Slides
We present our 3d circular flow diagram representing steps ppt score business plan template PowerPoint Slides.Present our Finance PowerPoint Templates because you envisage some areas of difficulty in the near future. The overall financial situation could be a source of worry. Use our Business PowerPoint Templates because you have selected your team man for man. Download our Circle Charts PowerPoint Templates because you will be able to Highlight the various ways in which we can maintain its efficiency. Download our Flow charts PowerPoint Templates because you have the people in place, selected the team leaders and all are raring to go. Use our Arrows PowerPoint Templates because you can Inform your team of the various means they have to achieve them.Use these PowerPoint slides for presentations relating to Arrow, Business, Chain, Chart, Circle, Circle, Frame, Color, Concept, Connect, Connection, Connectivity, Corporate, Data, Design, Diagram, Financial, Flow, Flowchart, Graph, Graphical, Group, Important, Organization, Organize, Plan, Process, Rectangle, Relation, Set, Steps, Structure, Teamwork. The prominent colors used in the PowerPoint template are Green, Gray, Black. Professionals tell us our 3d circular flow diagram representing steps ppt score business plan template PowerPoint Slides are Swanky. We assure you our Color PowerPoint templates and PPT Slides are Upbeat. People tell us our 3d circular flow diagram representing steps ppt score business plan template PowerPoint Slides are Dazzling. Customers tell us our Frame PowerPoint templates and PPT Slides are Zippy. Use our 3d circular flow diagram representing steps ppt score business plan template PowerPoint Slides are Adorable. We assure you our Circle PowerPoint templates and PPT Slides are Radiant. Expand your horizons with our 3d Circular Flow Diagram Representing Steps Ppt Score Business Plan Template PowerPoint Slides. Download without worries with our money back guaranteee.
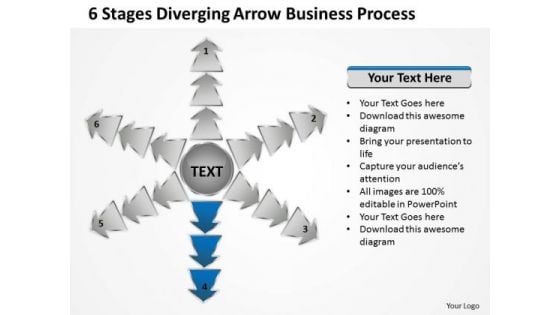
6 Stages Diverging Arrow Business Process Circular Spoke Network PowerPoint Templates
We present our 6 stages diverging arrow business process Circular Spoke Network PowerPoint templates.Present our Marketing PowerPoint Templates because this slide illuminates the spiritual brilliance of Jesus and showers the love for mankind he showed even while being crucified. Download our Shapes PowerPoint Templates because displaying your ideas and highlighting your ability will accelerate the growth of your company and yours. Use our Arrows PowerPoint Templates because you have what it takes to grow. Download and present our Business PowerPoint Templates because you can see clearly through to the bigger bowl ahead. Time your jump to perfection and hit the nail on the head. Download our Process and Flows PowerPoint Templates because the vision of being the market leader is clear to you.Use these PowerPoint slides for presentations relating to Arrows, Business, Chart, Cyclic, Data, Diagram, Financial, Goal, Graph, Illustration, Info, Information, Marketing, Model, Option, Part, Pie, Presentation, Process, Result, Sphere, Statistics. The prominent colors used in the PowerPoint template are Blue, Gray, Black. The feedback we get is that our 6 stages diverging arrow business process Circular Spoke Network PowerPoint templates are Clever. People tell us our Chart PowerPoint templates and PPT Slides are Nostalgic. Presenters tell us our 6 stages diverging arrow business process Circular Spoke Network PowerPoint templates are One-of-a-kind. Use our Financial PowerPoint templates and PPT Slides are Versatile. Use our 6 stages diverging arrow business process Circular Spoke Network PowerPoint templates are topically designed to provide an attractive backdrop to any subject. Use our Graph PowerPoint templates and PPT Slides are Elegant. Accomplish ambitions with our 6 Stages Diverging Arrow Business Process Circular Spoke Network PowerPoint Templates. They accompany you from arrival to ascent.
Social Media Performance Tracking Sales Performance Enhancement Infographics Pdf
The following slide showcases a dashboard to track and measure social media platforms performance. It includes key elements such as website traffic, social media referral rate, site revenue, social media site revenue, etc. Here you can discover an assortment of the finest PowerPoint and Google Slides templates. With these templates, you can create presentations for a variety of purposes while simultaneously providing your audience with an eye catching visual experience. Download Social Media Performance Tracking Sales Performance Enhancement Infographics Pdf to deliver an impeccable presentation. These templates will make your job of preparing presentations much quicker, yet still, maintain a high level of quality. Slidegeeks has experienced researchers who prepare these templates and write high quality content for you. Later on, you can personalize the content by editing the Social Media Performance Tracking Sales Performance Enhancement Infographics Pdf. The following slide showcases a dashboard to track and measure social media platforms performance. It includes key elements such as website traffic, social media referral rate, site revenue, social media site revenue, etc.
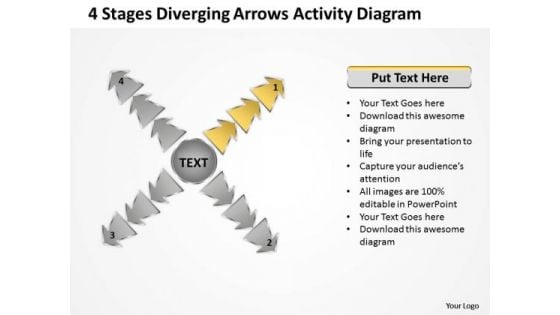
4 Stages Diverging Arrows Activity Diagram Cycle Chart PowerPoint Template
We present our 4 stages diverging arrows activity diagram Cycle Chart PowerPoint template.Download and present our Flow Charts PowerPoint Templates because you have the ideas, you have got a brainwave. Download our Business PowerPoint Templates because you have analysed many global markets and come up with possibilities. Highlight the pros and cons of other likely business oppurtunities. Use our Process and Flows PowerPoint Templates because health of the determines the quality of our lives. Download our Success PowerPoint Templates because the choices you make today will determine the future growth of your enterprise. Download our Arrows PowerPoint Templates because your business and plans for its growth consist of processes that are highly co-related.Use these PowerPoint slides for presentations relating to Business, Chart, Circle, Cyclic, Data, Diagram, Financial, Goal, Graph, Illustration, Info, Information, Marketing, Model, Option, Part, Pie, Presentation, Process, Result, Sphere, Statistics. The prominent colors used in the PowerPoint template are Yellow, Gray, White. People tell us our 4 stages diverging arrows activity diagram Cycle Chart PowerPoint template are Zippy. Customers tell us our Cyclic PowerPoint templates and PPT Slides are Beautiful. People tell us our 4 stages diverging arrows activity diagram Cycle Chart PowerPoint template are Whimsical. Professionals tell us our Cyclic PowerPoint templates and PPT Slides are Romantic. Customers tell us our 4 stages diverging arrows activity diagram Cycle Chart PowerPoint template help you meet deadlines which are an element of today's workplace. Just browse and pick the slides that appeal to your intuitive senses. Use our Financial PowerPoint templates and PPT Slides are Precious. Encourage teams with our 4 Stages Diverging Arrows Activity Diagram Cycle Chart PowerPoint Template. Download without worries with our money back guaranteee.
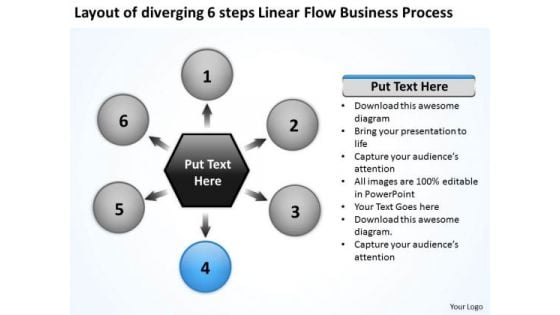
Linear Flow World Business PowerPoint Templates Process Gear
We present our linear flow world business powerpoint templates process Gear.Use our Ring Charts PowerPoint Templates because the chart is designed to give you the flavour of the kind of tools you may need and the work that is performed in the lifecycle. Download our Flow charts PowerPoint Templates because Our PowerPoint Templates and Slides will generate and maintain the level of interest you desire. They will create the impression you want to imprint on your audience. Use our Circle charts PowerPoint Templates because you can put down your ideas and present them using our innovative templates. Present our Process and Flows PowerPoint Templates because this diagram helps you to discuss each step slowly but surely move up the pyramid narrowing down to the best and most success oriented project. Download our Arrows PowerPoint Templates because visual appeal is a priority for us.Use these PowerPoint slides for presentations relating to Communication,competition, development, diagram,direction, element, finance, financial,forward, graphic, growth, guide,increase, investment, leader, leadership,management, marketing, motion,moving, organization, path, plan,presentation, price, profit, progress,report, representation, shape, sign,stakeholder, success, symbol, target,team, teamwork. The prominent colors used in the PowerPoint template are Blue, Black, Gray. People tell us our linear flow world business powerpoint templates process Gear are Bright. Customers tell us our finance PowerPoint templates and PPT Slides are Nostalgic. Professionals tell us our linear flow world business powerpoint templates process Gear are Ritzy. Presenters tell us our forward PowerPoint templates and PPT Slides will help them to explain complicated concepts. Use our linear flow world business powerpoint templates process Gear help you meet deadlines which are an element of today's workplace. Just browse and pick the slides that appeal to your intuitive senses. Presenters tell us our financial PowerPoint templates and PPT Slides are Elevated. Our Linear Flow World Business PowerPoint Templates Process Gear make it a cakewalk. You will dominate the event with authority.
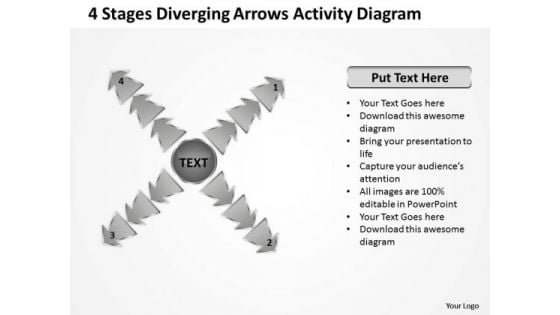
4 Stages Diverging Arrows Activity Diagram Cycle Chart PowerPoint Templates
We present our 4 stages diverging arrows activity diagram Cycle Chart PowerPoint templates.Present our Flow Charts PowerPoint Templates because you are buzzing with ideas. Download our Business PowerPoint Templates because everybody knows The world over it is a priority for many. Along with it there are so many oppurtunities waiting to be utilised. Download our Process and Flows PowerPoint Templates because let your words be the drops of wisdom spreading knowledge and peace like ripples through the expectant minds of your devoted followers. Download and present our Success PowerPoint Templates because you can Adorn them with your ideas and thoughts. Download and present our Arrows PowerPoint Templates because you are aware of some pitfalls ahead where you need to be cautious not to overrun and avoid a stall.Use these PowerPoint slides for presentations relating to Business, Chart, Circle, Cyclic, Data, Diagram, Financial, Goal, Graph, Illustration, Info, Information, Marketing, Model, Option, Part, Pie, Presentation, Process, Result, Sphere, Statistics. The prominent colors used in the PowerPoint template are Black, Gray, White. People tell us our 4 stages diverging arrows activity diagram Cycle Chart PowerPoint templates are Nice. Customers tell us our Financial PowerPoint templates and PPT Slides are Vintage. People tell us our 4 stages diverging arrows activity diagram Cycle Chart PowerPoint templates are Nostalgic. Professionals tell us our Data PowerPoint templates and PPT Slides are Luxuriant. Customers tell us our 4 stages diverging arrows activity diagram Cycle Chart PowerPoint templates are Attractive. Use our Cyclic PowerPoint templates and PPT Slides will make the presenter look like a pro even if they are not computer savvy. The adaptability of our 4 Stages Diverging Arrows Activity Diagram Cycle Chart PowerPoint Templates is a fact. They will align with your bidding.
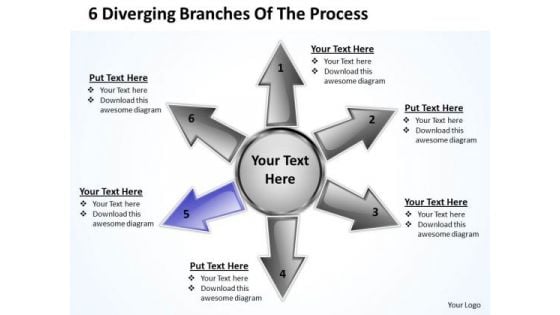
6 Diverging Branches Of The Process Ppt Relative Circular Arrow Chart PowerPoint Templates
We present our 6 diverging branches of the process ppt Relative Circular Arrow Chart PowerPoint templates.Download and present our Communication PowerPoint Templates because your group can behave steady in the top bracket. Use our Business PowerPoint Templates because this diagram can set an example to enthuse your team with the passion and fervour of your ideas. Use our Process and Flows PowerPoint Templates because this diagram helps you to light up enthusiasm in your team like dream emerge.ge. Use our Shapes PowerPoint Templates because Our PowerPoint Templates and Slides will Activate the energies of your audience. Get their creative juices flowing with your words. Download our Arrows PowerPoint Templates because this template project the knowledge gained to your colleagues to guide them along the way in days to come.Use these PowerPoint slides for presentations relating to Arrow, Brochure, Business, Chart, Circle, Cyclic, Data, Diagram, Financial, Goal, Graph, Illustration, Info, Information, Investment, Manage, Marketing, Model, Option, Part, Pie, Presentation, Process, Result, Sphere, Statistics, Stock, Strategy, Template, Wheel. The prominent colors used in the PowerPoint template are Purple, Gray, Black. The feedback we get is that our 6 diverging branches of the process ppt Relative Circular Arrow Chart PowerPoint templates are Elegant. People tell us our Data PowerPoint templates and PPT Slides are Stunning. Presenters tell us our 6 diverging branches of the process ppt Relative Circular Arrow Chart PowerPoint templates will make you look like a winner. Use our Circle PowerPoint templates and PPT Slides are Second to none. Use our 6 diverging branches of the process ppt Relative Circular Arrow Chart PowerPoint templates are topically designed to provide an attractive backdrop to any subject. Use our Financial PowerPoint templates and PPT Slides are Stunning. Experience the striking graphics of our 6 Diverging Branches Of The Process Ppt Relative Circular Arrow Chart PowerPoint Templates. They bring good quality to the table.

4 Diverging Steps Of A Logical Sequence Arrows Cycle Chart PowerPoint Templates
We present our 4 diverging steps of a logical sequence arrows Cycle Chart PowerPoint templates.Download our Business PowerPoint Templates because the majestic tiger lord of all it surveys.It exudes power even when it is in repose. Use our Shapes PowerPoint Templates because Our PowerPoint Templates and Slides will let you Clearly mark the path for others to follow. Use our Flow Charts PowerPoint Templates because this diagram depicts the essence of this chain reaction like sequence of events. Use our Arrows PowerPoint Templates because you can spread the fruits of your efforts and elaborate your ideas on the prevention, diagnosis, control and cure of prevalent diseases. Present our Process and Flows PowerPoint Templates because all elements of the venture are equally critical.Use these PowerPoint slides for presentations relating to Arrow, Brochure, Business, Chart, Circle, Cyclic, Data, Diagram, Financial, Goal, Graph, Illustration, Info, Information, Investment, Manage, Marketing, Model, Option, Part, Pie, Presentation, Process, Result, Sphere, Statistics, Stock, Strategy, Template, Wheel. The prominent colors used in the PowerPoint template are Blue, Gray, White. People tell us our 4 diverging steps of a logical sequence arrows Cycle Chart PowerPoint templates provide you with a vast range of viable options. Select the appropriate ones and just fill in your text. Customers tell us our Financial PowerPoint templates and PPT Slides are designed to make your presentations professional. People tell us our 4 diverging steps of a logical sequence arrows Cycle Chart PowerPoint templates are Dynamic. Professionals tell us our Business PowerPoint templates and PPT Slides are Pleasant. Customers tell us our 4 diverging steps of a logical sequence arrows Cycle Chart PowerPoint templates are Excellent. Use our Cyclic PowerPoint templates and PPT Slides are Appealing. However faint their hopes may be. Buck them up with our 4 Diverging Steps Of A Logical Sequence Arrows Cycle Chart PowerPoint Templates.
Monthly Sales Performance Tracking Sales Performance Enhancement Background Pdf
This slide showcases a dashboard presenting various metrics to measure and analyze sales performance for revenue growth. It includes key components such as number of sales, revenue, profit, cost, sales revenue, sales increment, cost analysis and cross sell. Coming up with a presentation necessitates that the majority of the effort goes into the content and the message you intend to convey. The visuals of a PowerPoint presentation can only be effective if it supplements and supports the story that is being told. Keeping this in mind our experts created Monthly Sales Performance Tracking Sales Performance Enhancement Background Pdf to reduce the time that goes into designing the presentation. This way, you can concentrate on the message while our designers take care of providing you with the right template for the situation. This slide showcases a dashboard presenting various metrics to measure and analyze sales performance for revenue growth. It includes key components such as number of sales, revenue, profit, cost, sales revenue, sales increment, cost analysis and cross sell.
Performance Enhancement Plan Monthly Sales Performance Tracking And Monitoring Portrait Pdf
This slide showcases a dashboard presenting various metrics to measure and analyze sales performance for revenue growth. It includes key components such as number of sales, revenue, profit, cost, sales revenue, sales increment, cost analysis and cross sell. Coming up with a presentation necessitates that the majority of the effort goes into the content and the message you intend to convey. The visuals of a PowerPoint presentation can only be effective if it supplements and supports the story that is being told. Keeping this in mind our experts created Performance Enhancement Plan Monthly Sales Performance Tracking And Monitoring Portrait Pdf to reduce the time that goes into designing the presentation. This way, you can concentrate on the message while our designers take care of providing you with the right template for the situation. This slide showcases a dashboard presenting various metrics to measure and analyze sales performance for revenue growth. It includes key components such as number of sales, revenue, profit, cost, sales revenue, sales increment, cost analysis and cross sell.
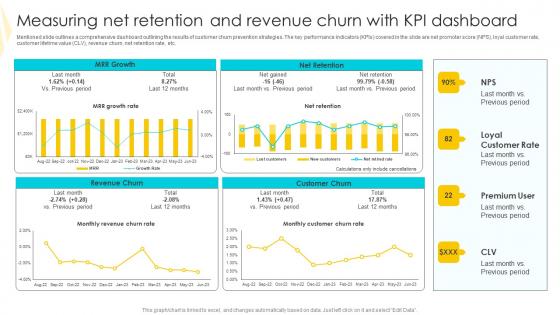
Measuring Net Retention And Strategies To Mitigate Customer Churn Elements Pdf
Mentioned slide outlines a comprehensive dashboard outlining the results of customer churn prevention strategies. The key performance indicators KPIs covered in the slide are net promoter score NPS, loyal customer rate, customer lifetime value CLV, revenue churn, net retention rate, etc. The Measuring Net Retention And Strategies To Mitigate Customer Churn Elements Pdf is a compilation of the most recent design trends as a series of slides. It is suitable for any subject or industry presentation, containing attractive visuals and photo spots for businesses to clearly express their messages. This template contains a variety of slides for the user to input data, such as structures to contrast two elements, bullet points, and slides for written information. Slidegeeks is prepared to create an impression. Mentioned slide outlines a comprehensive dashboard outlining the results of customer churn prevention strategies. The key performance indicators KPIs covered in the slide are net promoter score NPS, loyal customer rate, customer lifetime value CLV, revenue churn, net retention rate, etc.
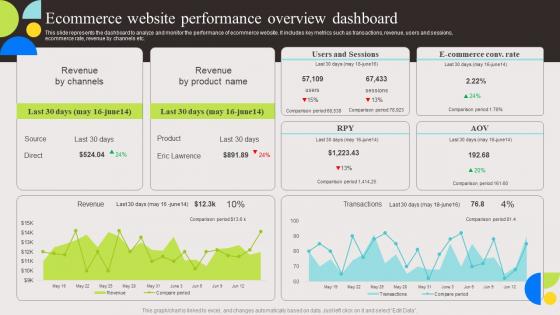
Ecommerce Website Performance Evaluation And Deployment Of Enhanced Elements Pdf
This slide represents the dashboard to analyze and monitor the performance of ecommerce website. It includes key metrics such as transactions, revenue, users and sessions, ecommerce rate, revenue by channels etc. If you are looking for a format to display your unique thoughts, then the professionally designed Ecommerce Website Performance Evaluation And Deployment Of Enhanced Elements Pdf is the one for you. You can use it as a Google Slides template or a PowerPoint template. Incorporate impressive visuals, symbols, images, and other charts. Modify or reorganize the text boxes as you desire. Experiment with shade schemes and font pairings. Alter, share or cooperate with other people on your work. Download Ecommerce Website Performance Evaluation And Deployment Of Enhanced Elements Pdf and find out how to give a successful presentation. Present a perfect display to your team and make your presentation unforgettable. This slide represents the dashboard to analyze and monitor the performance of ecommerce website. It includes key metrics such as transactions, revenue, users and sessions, ecommerce rate, revenue by channels etc.
Performance Enhancement Plan Social Media Performance Tracking Professional Pdf
The following slide showcases a dashboard to track and measure social media platforms performance. It includes key elements such as website traffic, social media referral rate, site revenue, social media site revenue, etc. Presenting this PowerPoint presentation, titled Performance Enhancement Plan Social Media Performance Tracking Professional Pdf, with topics curated by our researchers after extensive research. This editable presentation is available for immediate download and provides attractive features when used. Download now and captivate your audience. Presenting this Performance Enhancement Plan Social Media Performance Tracking Professional Pdf. Our researchers have carefully researched and created these slides with all aspects taken into consideration. This is a completely customizable Performance Enhancement Plan Social Media Performance Tracking Professional Pdf that is available for immediate downloading. Download now and make an impact on your audience. Highlight the attractive features available with our PPTs. The following slide showcases a dashboard to track and measure social media platforms performance. It includes key elements such as website traffic, social media referral rate, site revenue, social media site revenue, etc.
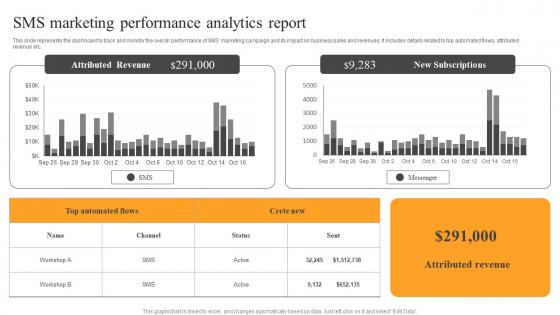
SMS Marketing Performance Analytics Text Message Advertising Solutions Enhancing Microsoft Pdf
This slide represents the dashboard to track and monitor the overall performance of SMS marketing campaign and its impact on business sales and revenues. It includes details related to top automated flows, attributed revenue etc. Do you have an important presentation coming up Are you looking for something that will make your presentation stand out from the rest Look no further than SMS Marketing Performance Analytics Text Message Advertising Solutions Enhancing Microsoft Pdf With our professional designs, you can trust that your presentation will pop and make delivering it a smooth process. And with Slidegeeks, you can trust that your presentation will be unique and memorable. So why wait Grab SMS Marketing Performance Analytics Text Message Advertising Solutions Enhancing Microsoft Pdf today and make your presentation stand out from the rest This slide represents the dashboard to track and monitor the overall performance of SMS marketing campaign and its impact on business sales and revenues. It includes details related to top automated flows, attributed revenue etc.
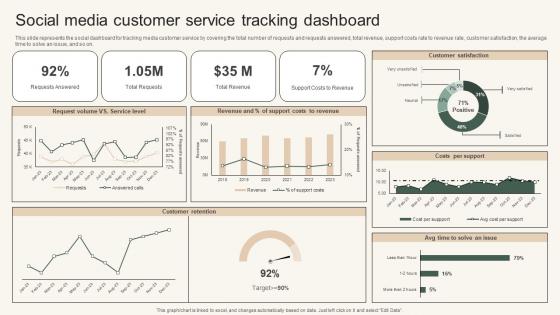
Social Media Customer Service Instant Messenger For Internal Business Operations Diagrams Pdf
This slide represents the social dashboard for tracking media customer service by covering the total number of requests and requests answered, total revenue, support costs rate to revenue rate, customer satisfaction, the average time to solve an issue, and so on. Whether you have daily or monthly meetings, a brilliant presentation is necessary. Social Media Customer Service Instant Messenger For Internal Business Operations Diagrams Pdf can be your best option for delivering a presentation. Represent everything in detail using Social Media Customer Service Instant Messenger For Internal Business Operations Diagrams Pdf and make yourself stand out in meetings. The template is versatile and follows a structure that will cater to your requirements. All the templates prepared by Slidegeeks are easy to download and edit. Our research experts have taken care of the corporate themes as well. So, give it a try and see the results. This slide represents the social dashboard for tracking media customer service by covering the total number of requests and requests answered, total revenue, support costs rate to revenue rate, customer satisfaction, the average time to solve an issue, and so on.
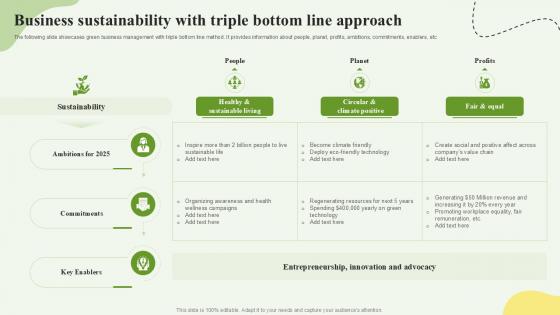
Business Sustainability With Triple Bottom Line Approach Ppt Example SS
This slide mentions the KPI dashboard for pharmaceutical companies. The purpose of this slide is analysis the 6 months gross selling of the company that can be utilized by the managers to determine actual revenue and profits. It includes details regarding discounts, unit sold per segment, profit by product, monthly revenue, etc. Get a simple yet stunning designed Business Sustainability With Triple Bottom Line Approach Ppt Example SS It is the best one to establish the tone in your meetings. It is an excellent way to make your presentations highly effective. So, download this PPT today from Slidegeeks and see the positive impacts. Our easy-to-edit Business Sustainability With Triple Bottom Line Approach Ppt Example SS can be your go-to option for all upcoming conferences and meetings. So, what are you waiting for Grab this template today. This slide mentions the KPI dashboard for pharmaceutical companies. The purpose of this slide is analysis the 6 months gross selling of the company that can be utilized by the managers to determine actual revenue and profits. It includes details regarding discounts, unit sold per segment, profit by product, monthly revenue, etc.
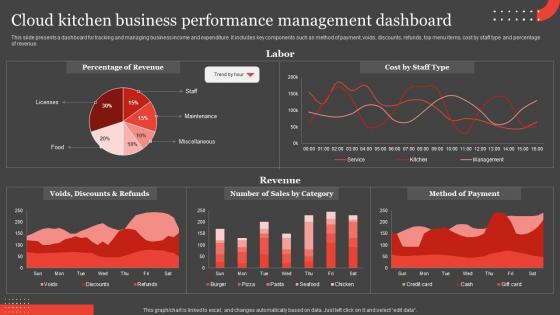
International Food Delivery Market Cloud Kitchen Business Performance Management Slides Pdf
This slide presents a dashboard for tracking and managing business income and expenditure. It includes key components such as method of payment, voids, discounts, refunds, top menu items, cost by staff type and percentage of revenue. Do you have an important presentation coming up Are you looking for something that will make your presentation stand out from the rest Look no further than International Food Delivery Market Cloud Kitchen Business Performance Management Slides Pdf. With our professional designs, you can trust that your presentation will pop and make delivering it a smooth process. And with Slidegeeks, you can trust that your presentation will be unique and memorable. So why wait Grab International Food Delivery Market Cloud Kitchen Business Performance Management Slides Pdf today and make your presentation stand out from the rest. This slide presents a dashboard for tracking and managing business income and expenditure. It includes key components such as method of payment, voids, discounts, refunds, top menu items, cost by staff type and percentage of revenue.

Analysis Of Ecommerce Sales In Power BI Ppt Slide SS
This slide showcases dashboard for customer segmentation analysis. This template aims to provide opportunities to focus on more customers for selling cosmetics products and can be used to predict business growth. It helps business organization to enhance revenue from sales by focusing on the profit margins. Create an editable Analysis Of Ecommerce Sales In Power BI Ppt Slide SS that communicates your idea and engages your audience. Whether you are presenting a business or an educational presentation, pre-designed presentation templates help save time. Analysis Of Ecommerce Sales In Power BI Ppt Slide SS is highly customizable and very easy to edit, covering many different styles from creative to business presentations. Slidegeeks has creative team members who have crafted amazing templates. So, go and get them without any delay. This slide showcases dashboard for customer segmentation analysis. This template aims to provide opportunities to focus on more customers for selling cosmetics products and can be used to predict business growth. It helps business organization to enhance revenue from sales by focusing on the profit margins.

Quarterly Report Powerpoint Presentation Slides PPT Example
This Quarterly Report Powerpoint Presentation Slides PPT Example is a primer on how to capitalize on business opportunities through planning, innovation, and market intelligence. The content-ready format of the complete deck will make your job as a decision-maker a lot easier. Use this ready-made PowerPoint Template to help you outline an extensive and legible plan to capture markets and grow your company on the right path, at an exponential pace. What is even more amazing is that this presentation is completely editable and 100 percent customizable. This twenty six slide complete deck helps you impress a roomful of people with your expertise in business and even presentation. Craft such a professional and appealing presentation for that amazing recall value. Download now. Our comprehensive Quarterly Report Template is a professionally created presentation that can help organizations in representing key data, performance metrics and progress updates. This ppt streamlines the reporting process by providing structured sections for financial results, project updates, strategic insights, etc. It is ideal for internal reviews, stakeholder presentations, and executive summaries, ensuring your quarterly updates are communicated effectively and positively.
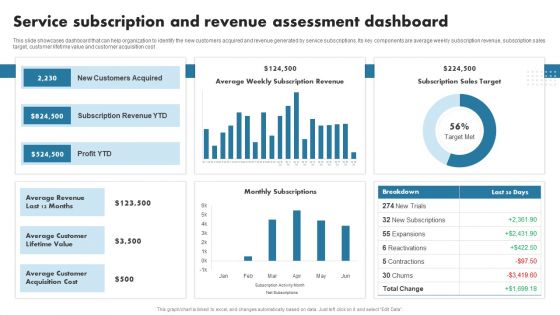
Enhancing Customer Outreach Service Subscription And Revenue Assessment Summary PDF
This slide showcases dashboard that can help organization to identify the new customers acquired and revenue generated by service subscriptions. Its key components are average weekly subscription revenue, subscription sales target, customer lifetime value and customer acquisition cost. This modern and well-arranged Enhancing Customer Outreach Service Subscription And Revenue Assessment Summary PDF provides lots of creative possibilities. It is very simple to customize and edit with the Powerpoint Software. Just drag and drop your pictures into the shapes. All facets of this template can be edited with Powerpoint, no extra software is necessary. Add your own material, put your images in the places assigned for them, adjust the colors, and then you can show your slides to the world, with an animated slide included.
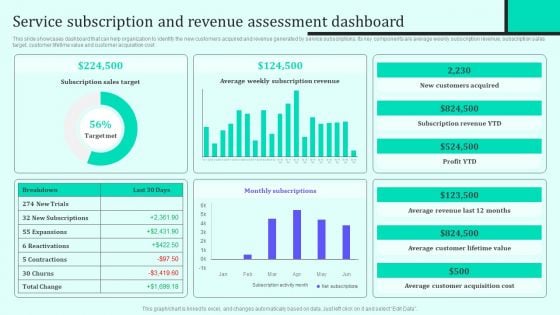
Implementing New Sales And Marketing Process For Services Service Subscription And Revenue Assessment Infographics PDF
This slide showcases dashboard that can help organization to identify the new customers acquired and revenue generated by service subscriptions. Its key components are average weekly subscription revenue, subscription sales target, customer lifetime value and customer acquisition cost. Do you have to make sure that everyone on your team knows about any specific topic I yes, then you should give Implementing New Sales And Marketing Process For Services Service Subscription And Revenue Assessment Infographics PDF a try. Our experts have put a lot of knowledge and effort into creating this impeccable Implementing New Sales And Marketing Process For Services Service Subscription And Revenue Assessment Infographics PDF. You can use this template for your upcoming presentations, as the slides are perfect to represent even the tiniest detail. You can download these templates from the Slidegeeks website and these are easy to edit. So grab these today.
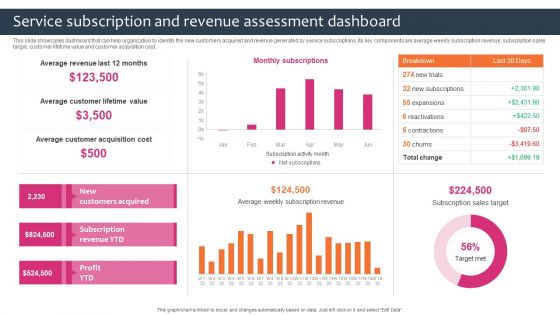
Promotion Sales Techniques For New Service Introduction Service Subscription Revenue Assessment Infographics PDF
This slide showcases dashboard that can help organization to identify the new customers acquired and revenue generated by service subscriptions. Its key components are average weekly subscription revenue, subscription sales target, customer lifetime value and customer acquisition cost. Are you searching for a Promotion Sales Techniques For New Service Introduction Service Subscription Revenue Assessment Infographics PDF that is uncluttered, straightforward, and original Its easy to edit, and you can change the colors to suit your personal or business branding. For a presentation that expresses how much effort you have put in, this template is ideal. With all of its features, including tables, diagrams, statistics, and lists, its perfect for a business plan presentation. Make your ideas more appealing with these professional slides. Download Promotion Sales Techniques For New Service Introduction Service Subscription Revenue Assessment Infographics PDF from Slidegeeks today.
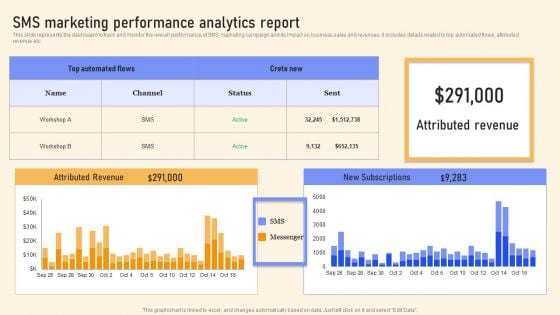
SMS Marketing Performance Analytics Report Ppt PowerPoint Presentation File Infographics PDF
This slide represents the dashboard to track and monitor the overall performance of SMS marketing campaign and its impact on business sales and revenues. It includes details related to top automated flows, attributed revenue etc. Slidegeeks is here to make your presentations a breeze with SMS Marketing Performance Analytics Report Ppt PowerPoint Presentation File Infographics PDF With our easy to use and customizable templates, you can focus on delivering your ideas rather than worrying about formatting. With a variety of designs to choose from, you are sure to find one that suits your needs. And with animations and unique photos, illustrations, and fonts, you can make your presentation pop. So whether you are giving a sales pitch or presenting to the board, make sure to check out Slidegeeks first.
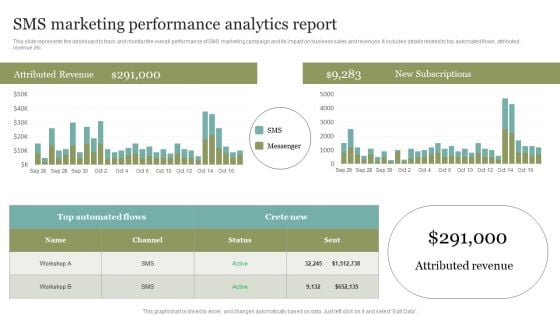
SMS Marketing Performance Analytics Report Summary PDF
This slide represents the dashboard to track and monitor the overall performance of SMS marketing campaign and its impact on business sales and revenues. It includes details related to top automated flows, attributed revenue etc. This SMS Marketing Performance Analytics Report Summary PDF from Slidegeeks makes it easy to present information on your topic with precision. It provides customization options, so you can make changes to the colors, design, graphics, or any other component to create a unique layout. It is also available for immediate download, so you can begin using it right away. Slidegeeks has done good research to ensure that you have everything you need to make your presentation stand out. Make a name out there for a brilliant performance.
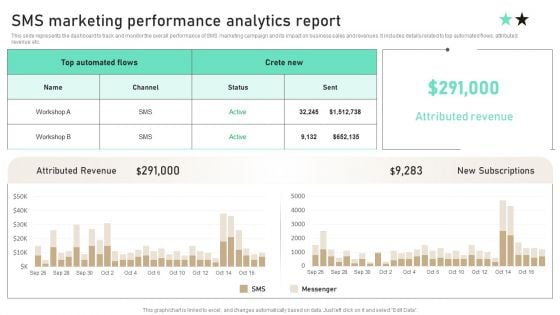
SMS Marketing Performance Analytics Report Ppt PowerPoint Presentation Diagram Templates PDF
This slide represents the dashboard to track and monitor the overall performance of SMS marketing campaign and its impact on business sales and revenues. It includes details related to top automated flows, attributed revenue etc. Slidegeeks is here to make your presentations a breeze with SMS Marketing Performance Analytics Report Ppt PowerPoint Presentation Diagram Templates PDF With our easy to use and customizable templates, you can focus on delivering your ideas rather than worrying about formatting. With a variety of designs to choose from, you are sure to find one that suits your needs. And with animations and unique photos, illustrations, and fonts, you can make your presentation pop. So whether you are giving a sales pitch or presenting to the board, make sure to check out Slidegeeks first.
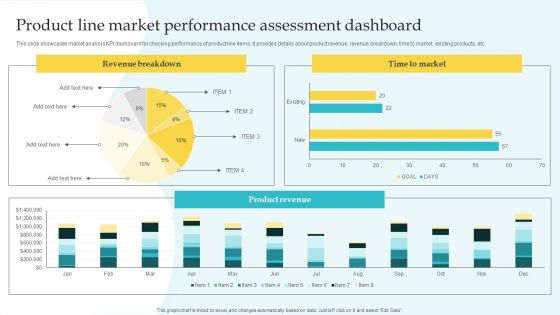
Commodity Line Expansion Product Line Market Performance Assessment Download PDF
This slide showcases market analysis KPI dashboard for checking performance of product line items. It provides details about product revenue, revenue breakdown, time to market, existing products, etc. Explore a selection of the finest Commodity Line Expansion Product Line Market Performance Assessment Download PDF here. With a plethora of professionally designed and pre-made slide templates, you can quickly and easily find the right one for your upcoming presentation. You can use our Commodity Line Expansion Product Line Market Performance Assessment Download PDF to effectively convey your message to a wider audience. Slidegeeks has done a lot of research before preparing these presentation templates. The content can be personalized and the slides are highly editable. Grab templates today from Slidegeeks.
Role Of IT In Business Communication Social Media Customer Service Tracking Ideas PDF
This slide represents the social dashboard for tracking media customer service by covering the total number of requests and requests answered, total revenue, support costs rate to revenue rate, customer satisfaction, the average time to solve an issue, and so on. This Role Of IT In Business Communication Social Media Customer Service Tracking Ideas PDF from Slidegeeks makes it easy to present information on your topic with precision. It provides customization options, so you can make changes to the colors, design, graphics, or any other component to create a unique layout. It is also available for immediate download, so you can begin using it right away. Slidegeeks has done good research to ensure that you have everything you need to make your presentation stand out. Make a name out there for a brilliant performance.
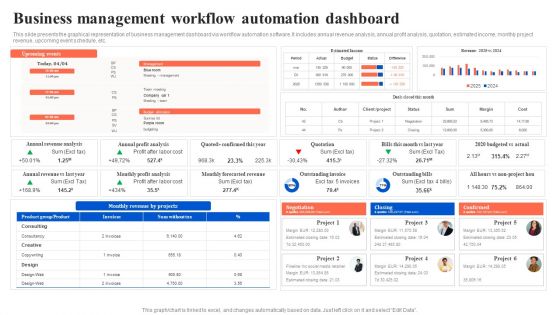
Workflow Automation For Optimizing Organizational Processes Business Management Workflow Infographics PDF
This slide presents the graphical representation of business management dashboard via workflow automation software. It includes annual revenue analysis, annual profit analysis, quotation, estimated income, monthly project revenue, upcoming event schedule, etc. Here you can discover an assortment of the finest PowerPoint and Google Slides templates. With these templates, you can create presentations for a variety of purposes while simultaneously providing your audience with an eye catching visual experience. Download Workflow Automation For Optimizing Organizational Processes Business Management Workflow Infographics PDF to deliver an impeccable presentation. These templates will make your job of preparing presentations much quicker, yet still, maintain a high level of quality. Slidegeeks has experienced researchers who prepare these templates and write high quality content for you. Later on, you can personalize the content by editing the Workflow Automation For Optimizing Organizational Processes Business Management Workflow Infographics PDF.
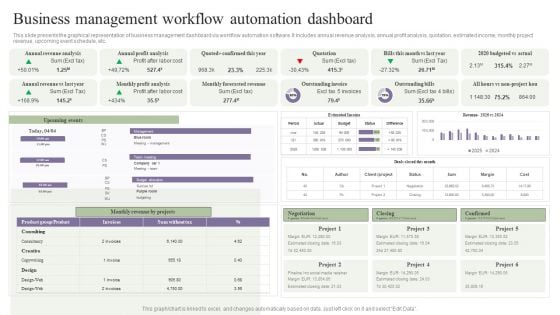
Deployment Of Process Automation To Increase Organisational Performance Business Management Workflow Themes PDF
This slide presents the graphical representation of business management dashboard via workflow automation software. It includes annual revenue analysis, annual profit analysis, quotation, estimated income, monthly project revenue, upcoming event schedule, etc. Presenting this PowerPoint presentation, titled Deployment Of Process Automation To Increase Organisational Performance Business Management Workflow Themes PDF, with topics curated by our researchers after extensive research. This editable presentation is available for immediate download and provides attractive features when used. Download now and captivate your audience. Presenting this Deployment Of Process Automation To Increase Organisational Performance Business Management Workflow Themes PDF. Our researchers have carefully researched and created these slides with all aspects taken into consideration. This is a completely customizable Deployment Of Process Automation To Increase Organisational Performance Business Management Workflow Themes PDF that is available for immediate downloading. Download now and make an impact on your audience. Highlight the attractive features available with our PPTs.
Planning Sales Campaign To Improve Tracking The Actual Sales Figures After Deal Finalizing Introduction PDF
This slide provides glimpse about dashboard analysis that can help the business to track the performance of the sales team. It includes KPIs such as revenues, profit, orders placed, conversion placed, conversion rate, customers, etc. Want to ace your presentation in front of a live audience Our Planning Sales Campaign To Improve Tracking The Actual Sales Figures After Deal Finalizing Introduction PDF can help you do that by engaging all the users towards you.. Slidegeeks experts have put their efforts and expertise into creating these impeccable powerpoint presentations so that you can communicate your ideas clearly. Moreover, all the templates are customizable, and easy-to-edit and downloadable. Use these for both personal and commercial use.
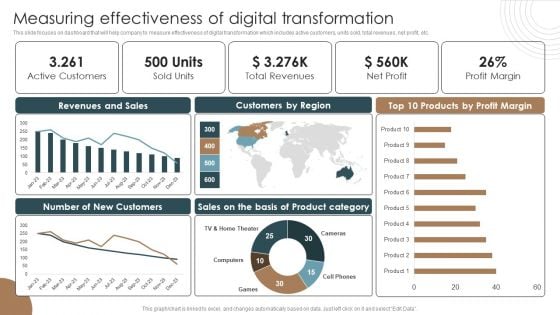
Measuring Effectiveness Of Digital Transformation Integrating Technology To Transform Change Designs PDF
This slide focuses on dashboard that will help company to measure effectiveness of digital transformation which includes active customers, units sold, total revenues, net profit, etc.Are you searching for a Measuring Effectiveness Of Digital Transformation Integrating Technology To Transform Change Designs PDF that is uncluttered, straightforward, and original Its easy to edit, and you can change the colors to suit your personal or business branding. For a presentation that expresses how much effort you have put in, this template is ideal With all of its features, including tables, diagrams, statistics, and lists, its perfect for a business plan presentation. Make your ideas more appealing with these professional slides. Download Measuring Effectiveness Of Digital Transformation Integrating Technology To Transform Change Designs PDF from Slidegeeks today.
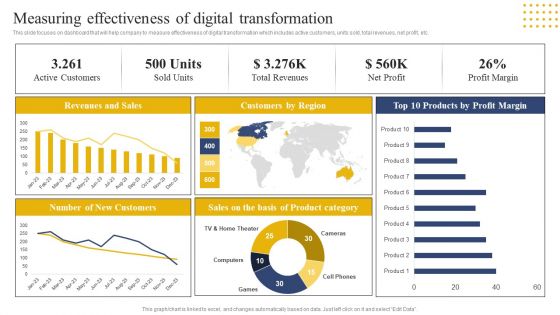
Transition Plan For Business Management Measuring Effectiveness Of Digital Transformation Sample PDF
This slide focuses on dashboard that will help company to measure effectiveness of digital transformation which includes active customers, units sold, total revenues, net profit, etc. This modern and well-arranged Transition Plan For Business Management Measuring Effectiveness Of Digital Transformation Sample PDF provides lots of creative possibilities. It is very simple to customize and edit with the Powerpoint Software. Just drag and drop your pictures into the shapes. All facets of this template can be edited with Powerpoint no extra software is necessary. Add your own material, put your images in the places assigned for them, adjust the colors, and then you can show your slides to the world, with an animated slide included.
Implementing Effective Strategy Product And Customer Performance Tracking Sample PDF
This slide provides information regarding dashboard utilized by firm to monitor performance of products offered and customer associated. The performance is tracked through revenues generated, new customer acquired, customer satisfaction, sales comparison, etc. This Implementing Effective Strategy Product And Customer Performance Tracking Sample PDF from Slidegeeks makes it easy to present information on your topic with precision. It provides customization options, so you can make changes to the colors, design, graphics, or any other component to create a unique layout. It is also available for immediate download, so you can begin using it right away. Slidegeeks has done good research to ensure that you have everything you need to make your presentation stand out. Make a name out there for a brilliant performance.
2 Stages Overlapping Circles Logical Relations Business Plan Worksheet PowerPoint Slides
We present our 2 stages overlapping circles logical relations business plan worksheet PowerPoint Slides.Use our Business PowerPoint Templates because You can Raise a toast with our PowerPoint Templates and Slides. Spread good cheer amongst your audience. Present our Marketing PowerPoint Templates because Our PowerPoint Templates and Slides are the chords of your song. String them along and provide the lilt to your views. Present our Shapes PowerPoint Templates because Our PowerPoint Templates and Slides will definately Enhance the stature of your presentation. Adorn the beauty of your thoughts with their colourful backgrounds. Use our Spheres PowerPoint Templates because Our PowerPoint Templates and Slides will provide you a launch platform. Give a lift off to your ideas and send them into orbit. Download our Success PowerPoint Templates because You can Hit a home run with our PowerPoint Templates and Slides. See your ideas sail into the minds of your audience.Use these PowerPoint slides for presentations relating to Chart, vector, diagram, market, business, concept, sign, success, presentation, symbol, template, finance, data, report, marketing, management, illustration, icon, strategy, research, web, design, growth, text, infographic, banner, profit, information, background, financial . The prominent colors used in the PowerPoint template are Green, Gray, White. Navigate difficult territory with our 2 Stages Overlapping Circles Logical Relations Business Plan Worksheet PowerPoint Slides. Download without worries with our money back guaranteee.
2 Stages Overlapping Circles Logical Relations Ppt Your Business Plan PowerPoint Templates
We present our 2 stages overlapping circles logical relations ppt your business plan PowerPoint templates.Download our Business PowerPoint Templates because Our PowerPoint Templates and Slides will let your team Walk through your plans. See their energy levels rise as you show them the way. Use our Marketing PowerPoint Templates because It will get your audience in sync. Download our Shapes PowerPoint Templates because Our PowerPoint Templates and Slides offer you the widest possible range of options. Download and present our Spheres PowerPoint Templates because Our PowerPoint Templates and Slides are designed to help you succeed. They have all the ingredients you need. Present our Success PowerPoint Templates because Our PowerPoint Templates and Slides will let you Illuminate the road ahead to Pinpoint the important landmarks along the way.Use these PowerPoint slides for presentations relating to Chart, vector, diagram, market, business, concept, sign, success, presentation, symbol, template, finance, data, report, marketing, management, illustration, icon, strategy, research, web, design, growth, text, infographic, banner, profit, information, background, financial . The prominent colors used in the PowerPoint template are Yellow, Gray, White. Dispatch your thoughts on our 2 Stages Overlapping Circles Logical Relations Ppt Your Business Plan PowerPoint Templates. They will take them the farthest possible.
2 Stages Overlapping Circles Logical Relations Sample Business Plan PowerPoint Slides
We present our 2 stages overlapping circles logical relations sample business plan PowerPoint Slides.Present our Business PowerPoint Templates because It can be used to Set your controls for the heart of the sun. Our PowerPoint Templates and Slides will be the propellant to get you there. Use our Marketing PowerPoint Templates because You can Stir your ideas in the cauldron of our PowerPoint Templates and Slides. Cast a magic spell on your audience. Download our Shapes PowerPoint Templates because You are an avid believer in ethical practices. Highlight the benefits that accrue with our PowerPoint Templates and Slides. Download our Spheres PowerPoint Templates because Your success is our commitment. Our PowerPoint Templates and Slides will ensure you reach your goal. Use our Success PowerPoint Templates because These PowerPoint Templates and Slides will give the updraft to your ideas. See them soar to great heights with ease.Use these PowerPoint slides for presentations relating to Chart, vector, diagram, market, business, concept, sign, success, presentation, symbol, template, finance, data, report, marketing, management, illustration, icon, strategy, research, web, design, growth, text, infographic, banner, profit, information, background, financial . The prominent colors used in the PowerPoint template are Green, Gray, White. Dont follow, lead the crowd with our 2 Stages Overlapping Circles Logical Relations Sample Business Plan PowerPoint Slides. Try us out and see what a difference our templates make.
Market Segmentation 3 Stages Creating Small Business Plan PowerPoint Templates
We present our market segmentation 3 stages creating small business plan PowerPoint templates.Present our Process and Flows PowerPoint Templates because Our PowerPoint Templates and Slides are topically designed to provide an attractive backdrop to any subject. Present our Marketing PowerPoint Templates because Our PowerPoint Templates and Slides provide you with a vast range of viable options. Select the appropriate ones and just fill in your text. Use our Business PowerPoint Templates because you can Break through with our PowerPoint Templates and Slides. Bring down the mental barriers of your audience. Download and present our Future PowerPoint Templates because Our PowerPoint Templates and Slides ensures Effective communication. They help you put across your views with precision and clarity. Use our Success PowerPoint Templates because You have the co-ordinates for your destination of success. Let our PowerPoint Templates and Slides map out your journey.Use these PowerPoint slides for presentations relating to Diagram, market, rise, statistics, grow, green, white, arrow, vector, line, glossy, bright, internet, shadow, circle, light, graphic, finance, pointer, simple, positive, trend, icon, chart, round, drop, shiny, money, web, growth, blue, set, progress, increase, financial . The prominent colors used in the PowerPoint template are Blue, Green , White. Conserve your energy with our Market Segmentation 3 Stages Creating Small Business Plan PowerPoint Templates. Download without worries with our money back guaranteee.
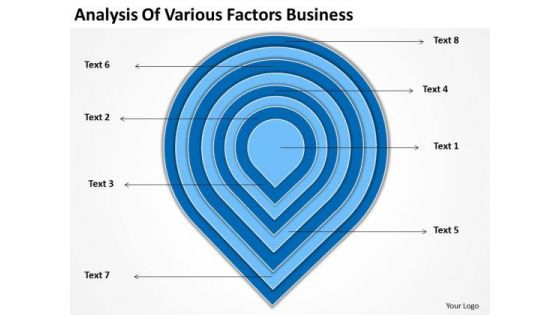
Various Factors Business Downloadable Plan Template PowerPoint Templates
We present our various factors business downloadable plan template PowerPoint templates.Use our Flow Charts PowerPoint Templates because Our PowerPoint Templates and Slides will bullet point your ideas. See them fall into place one by one. Download our Process and Flows PowerPoint Templates because You should Kick up a storm with our PowerPoint Templates and Slides. The heads of your listeners will swirl with your ideas. Download and present our Shapes PowerPoint Templates because you can Add colour to your speech with our PowerPoint Templates and Slides. Your presentation will leave your audience speechless. Download our Marketing PowerPoint Templates because They will bring a lot to the table. Their alluring flavours will make your audience salivate. Download and present our Success PowerPoint Templates because You can Zap them with our PowerPoint Templates and Slides. See them reel under the impact.Use these PowerPoint slides for presentations relating to Diagram, market, rise, statistics, grow, green, white, arrow, vector, line, glossy, bright, internet, shadow, circle, light, graphic, finance, pointer, simple, positive, trend, icon, chart, round, drop, shiny, money, web, growth, blue, set, progress, increase, financial . The prominent colors used in the PowerPoint template are Blue, Blue light, Black. Get a blue-chip client list with your ideas. Attract the best customers with our Various Factors Business Downloadable Plan Template PowerPoint Templates.
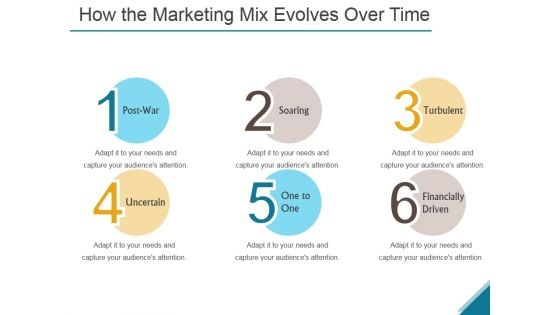
How The Marketing Mix Evolves Over Time Ppt PowerPoint Presentation Infographics
This is a how the marketing mix evolves over time ppt powerpoint presentation infographics. This is a six stage process. The stages in this process are post war, uncertain, soaring, one to one, turbulent, financially driven.
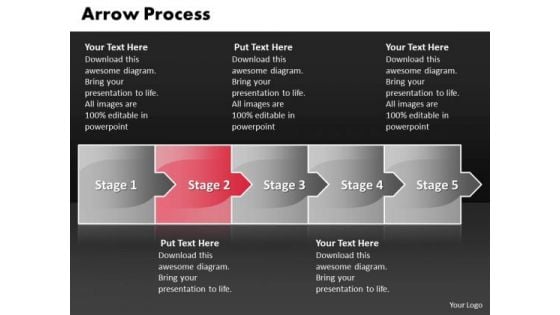
Marketing Ppt Template Arrow Process 5 Stages Business Strategy PowerPoint 3 Design
marketing PPT template arrow Process 5 stages business strategy powerpoint 3 design-This arrow process diagram allows managers to configure critical deviation alerts for any metric and provides real-time dashboards for a quick overview of the current situation. Organize your thoughts and Troubleshoot problems with our Marketing Ppt Template Arrow Process 5 Stages Business Strategy PowerPoint 3 Design. Download without worries with our money back guaranteee.
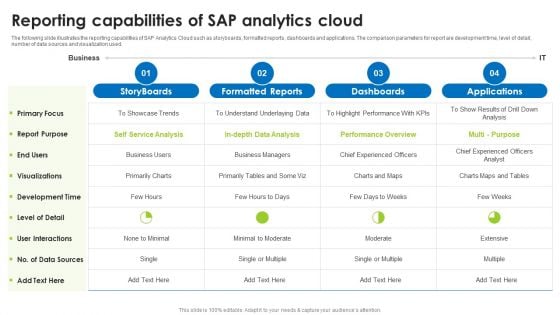
BI Technique For Data Informed Decisions Reporting Capabilities Of Sap Analytics Cloud Demonstration PDF
The following slide illustrates the reporting capabilities of SAP Analytics Cloud such as storyboards, formatted reports, dashboards and applications. The comparison parameters for report are development time, level of detail, number of data sources and visualization used. Make sure to capture your audiences attention in your business displays with our gratis customizable BI Technique For Data Informed Decisions Reporting Capabilities Of Sap Analytics Cloud Demonstration PDF. These are great for business strategies, office conferences, capital raising or task suggestions. If you desire to acquire more customers for your tech business and ensure they stay satisfied, create your own sales presentation with these plain slides.
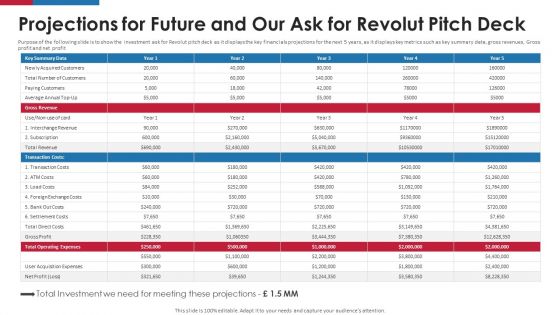
Revolut Capital Funding Projections For Future And Our Ask For Revolut Pitch Deck Ppt Pictures PDF
Purpose of the following slide is to show the investment ask for Revolut pitch deck as it displays the key financials projections for the next 5 years, as it displays key metrics such as key summary data, gross revenues, Gross profit and net profit. Purpose of the following slide is to show the investment ask for Revolut pitch deck as it displays the key financials projections for the next 5 years, as it displays key metrics such as key summary data, gross revenues, Gross profit and net profit. Deliver and pitch your topic in the best possible manner with this Revolut Capital Funding Projections For Future And Our Ask For Revolut Pitch Deck Ppt Pictures PDF. Use them to share invaluable insights on Key Summary Data, Gross Revenue, Transaction Costs and impress your audience. This template can be altered and modified as per your expectations. So, grab it now.

Examples Of Data Breaches Ppt PowerPoint Presentation Summary Portrait PDF
Presenting this set of slides with name examples of data breaches ppt powerpoint presentation summary portrait pdf. This is a five stage process. The stages in this process are inadequate cyber secure technology, lack of skilled human resource, security projects may fail if they are not financially supported adequately, security program is not aligned to business objective . This is a completely editable PowerPoint presentation and is available for immediate download. Download now and impress your audience.

Types Of Data Breach Ppt PowerPoint Presentation Inspiration Ideas PDF
Presenting this set of slides with name types of data breach ppt powerpoint presentation inspiration ideas pdf. This is a five stage process. The stages in this process are inadequate cyber secure technology, lack of skilled human resource, security projects may fail if they are not financially supported adequately, security program is not aligned to business objective . This is a completely editable PowerPoint presentation and is available for immediate download. Download now and impress your audience.
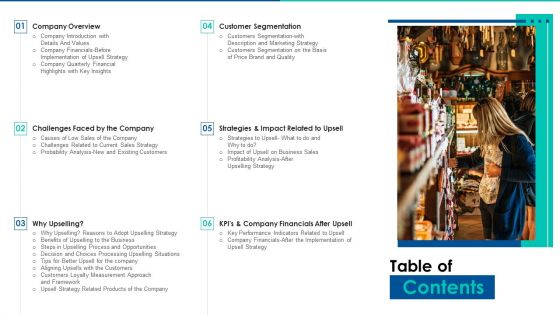
Sales Promotion Of Upgraded Product Through Upselling Table Of Contents Diagrams PDF
Deliver an awe inspiring pitch with this creative sales promotion of upgraded product through upselling table of contents diagrams pdf bundle. Topics like company overview, challenges faced by the company, customer segmentation, strategies and impact related to upsell, kpis and company financials after upsell can be discussed with this completely editable template. It is available for immediate download depending on the needs and requirements of the user.
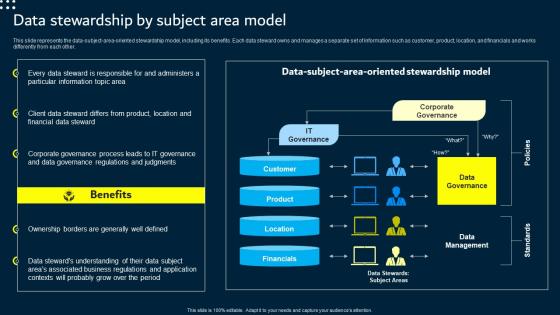
Data Stewardship By Subject Area Model Data Custodianship Infographics Pdf
This slide represents the data subject area oriented stewardship model, including its benefits. Each data steward owns and manages a separate set of information such as customer, product, location, and financials and works differently from each other. Do you know about Slidesgeeks Data Stewardship By Subject Area Model Data Custodianship Infographics Pdf These are perfect for delivering any kind od presentation. Using it, create PowerPoint presentations that communicate your ideas and engage audiences. Save time and effort by using our pre designed presentation templates that are perfect for a wide range of topic. Our vast selection of designs covers a range of styles, from creative to business, and are all highly customizable and easy to edit. Download as a PowerPoint template or use them as Google Slides themes. This slide represents the data subject area oriented stewardship model, including its benefits. Each data steward owns and manages a separate set of information such as customer, product, location, and financials and works differently from each other.
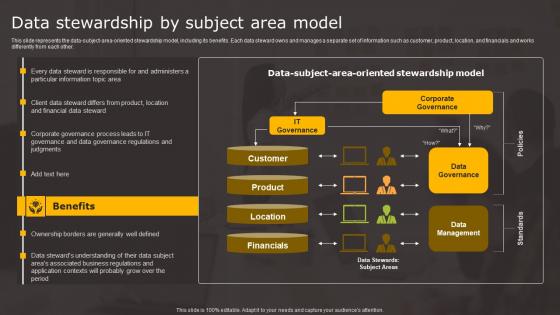
Data Stewardship By Subject Area Data Stewardship In Business Processes Information Pdf
This slide represents the data subject area oriented stewardship model, including its benefits. Each data steward owns and manages a separate set of information such as customer, product, location, and financials and works differently from each other. Crafting an eye catching presentation has never been more straightforward. Let your presentation shine with this tasteful yet straightforward Data Stewardship By Subject Area Data Stewardship In Business Processes Information Pdf template. It offers a minimalistic and classy look that is great for making a statement. The colors have been employed intelligently to add a bit of playfulness while still remaining professional. Construct the ideal Data Stewardship By Subject Area Data Stewardship In Business Processes Information Pdf that effortlessly grabs the attention of your audience Begin now and be certain to wow your customers This slide represents the data subject area oriented stewardship model, including its benefits. Each data steward owns and manages a separate set of information such as customer, product, location, and financials and works differently from each other.
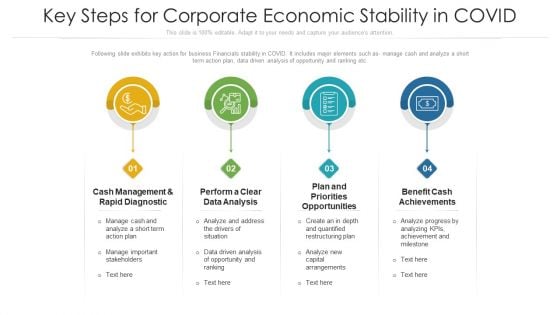
Key Steps For Corporate Economic Stability In COVID Ppt PowerPoint Presentation File Clipart Images PDF
Following slide exhibits key action for business Financials stability in COVID. It includes major elements such as- manage cash and analyze a short term action plan, data driven analysis of opportunity and ranking etc. Persuade your audience using this key steps for corporate economic stability in covid ppt powerpoint presentation file clipart images pdf. This PPT design covers four stages, thus making it a great tool to use. It also caters to a variety of topics including cash management and rapid diagnostic, perform a clear data analysis, benefit cash achievements. Download this PPT design now to present a convincing pitch that not only emphasizes the topic but also showcases your presentation skills.
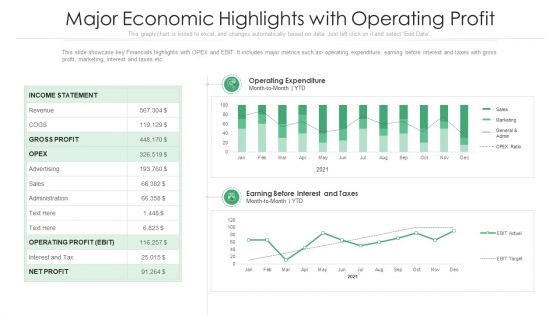
Major Economic Highlights With Operating Profit Ppt PowerPoint Presentation File Portfolio PDF
This slide showcase key Financials highlights with OPEX and EBIT. It includes major metrics such as- operating expenditure, earning before interest and taxes with gross profit, marketing, interest and taxes etc. Showcasing this set of slides titled major economic highlights with operating profit ppt powerpoint presentation file portfolio pdf. The topics addressed in these templates are revenue, sales, administration. All the content presented in this PPT design is completely editable. Download it and make adjustments in color, background, font etc. as per your unique business setting.
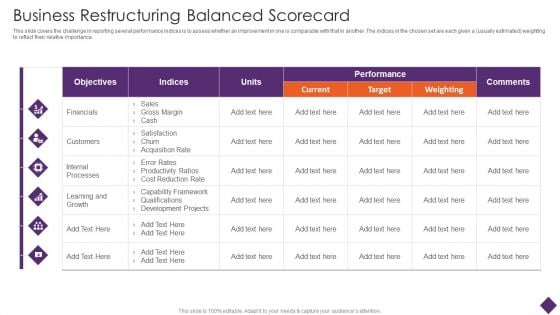
Business Restructuring Business Restructuring Balanced Scorecard Ppt Infographics Skills PDF
This slide covers the challenge in reporting several performance indices is to assess whether an improvement in one is comparable with that in another. The indices in the chosen set are each given a usually estimated weighting to reflect their relative importance. Deliver and pitch your topic in the best possible manner with this Business Restructuring Business Restructuring Balanced Scorecard Ppt Infographics Skills PDF. Use them to share invaluable insights on Objectives Financials Customers, Internal Processes Units and impress your audience. This template can be altered and modified as per your expectations. So, grab it now.
Selling Strategy And Operational Plan Business Overview Of The Target Company Amm Company Ppt Infographics Icon PDF
The slide provides the business overview of the target company the purchasing company.Business overview includes business introduction, mission and vision statement, financials highlights and non-performing assets for five years. Make sure to capture your audiences attention in your business displays with our gratis customizable Selling Strategy And Operational Plan Business Overview Of The Target Company Amm Company Ppt Infographics Icon PDF. These are great for business strategies, office conferences, capital raising or task suggestions. If you desire to acquire more customers for your tech business and ensure they stay satisfied, create your own sales presentation with these plain slides.
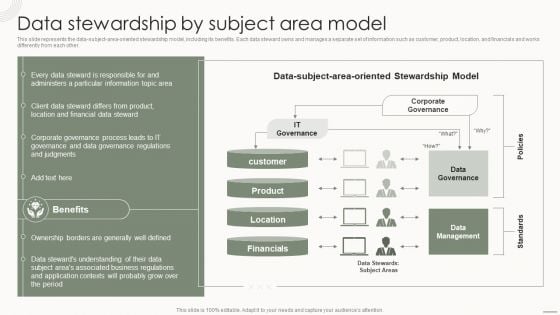
Data Governance IT Data Stewardship By Subject Area Model Microsoft PDF
This slide represents the data subject area oriented stewardship model, including its benefits. Each data steward owns and manages a separate set of information such as customer, product, location, and financials and works differently from each other. Present like a pro with Data Governance IT Data Stewardship By Subject Area Model Microsoft PDF Create beautiful presentations together with your team, using our easy to use presentation slides. Share your ideas in real time and make changes on the fly by downloading our templates. So whether you are in the office, on the go, or in a remote location, you can stay in sync with your team and present your ideas with confidence. With Slidegeeks presentation got a whole lot easier. Grab these presentations today.
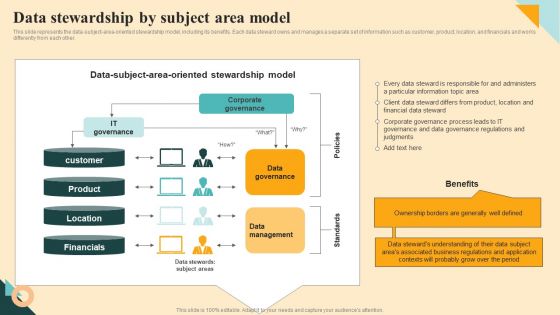
Data Stewardship By Subject Area Model Formats PDF
This slide represents the data-subject-area-oriented stewardship model, including its benefits. Each data steward owns and manages a separate set of information such as customer, product, location, and financials and works differently from each other. Do you have to make sure that everyone on your team knows about any specific topic I yes, then you should give Data Stewardship By Subject Area Model Formats PDF a try. Our experts have put a lot of knowledge and effort into creating this impeccable Data Stewardship By Subject Area Model Formats PDF. You can use this template for your upcoming presentations, as the slides are perfect to represent even the tiniest detail. You can download these templates from the Slidegeeks website and these are easy to edit. So grab these today.

Power BI Tool Powerpoint Ppt Template Bundles
This Power BI Tool Powerpoint Ppt Template Bundles is a primer on how to capitalize on business opportunities through planning, innovation, and market intelligence. The content-ready format of the complete deck will make your job as a decision-maker a lot easier. Use this ready-made PowerPoint Template to help you outline an extensive and legible plan to capture markets and grow your company on the right path, at an exponential pace. What is even more amazing is that this presentation is completely editable and 100 percent customizable. This Data Visualization, Project Report, Business Intelligence, Data Model, Machine Learning-slide complete deck helps you impress a roomful of people with your expertise in business and even presentation. Craft such a professional and appealing presentation for that amazing recall value. Download now. Introducing the game-changing Power BI solutions are the best solution for comprehensive data analysis and intelligent business intelligence. Power BI allows you to realize the full potential of your data by transforming it into relevant visualizations and interactive reports. Connect to numerous data sources seamlessly, combine them, and receive useful insights using Power BI analysis. Create attractive Power BI dashboards that provide a holistic perspective of your organizations performance, allowing you to confidently make educated decisions. Real-time data exploration, powerful analytics, and collaboration features may all help your team succeed. Power BI is your reliable partner for harnessing the power of data to drive growth and success. Power BI represents the future of data-driven decision-making.
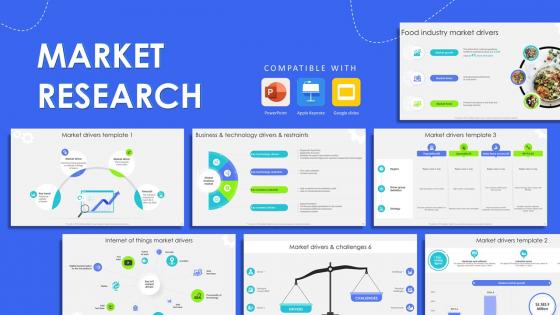
Market Research Power Point Presentation Slides
This Market Research Power Point Presentation Slides is a primer on how to capitalize on business opportunities through planning, innovation, and market intelligence. The content-ready format of the complete deck will make your job as a decision-maker a lot easier. Use this ready-made PowerPoint Template to help you outline an extensive and legible plan to capture markets and grow your company on the right path, at an exponential pace. What is even more amazing is that this presentation is completely editable and 100 percent customizable. This N-slide complete deck helps you impress a roomful of people with your expertise in business and even presentation. Craft such a professional and appealing presentation for that amazing recall value. Download now. Use our professionally designed presentation on Market Research that helps to shape shape your organizations strategy and evaluate the viability of business projects. This PPT covers key market drivers, constraints, forecasts, and industry-specific drivers such as the Internet of Things, the food industry, and technology market trends. Utilize data through visually appealing and easy to understand dashboards and KPI tracker sheet that allow you to effectively showcase research findings.Get access to this valuable tool by downloading this presentation that helps to drive sales, boost profits and foster strategic discussions.


 Continue with Email

 Home
Home


