Financial Icons
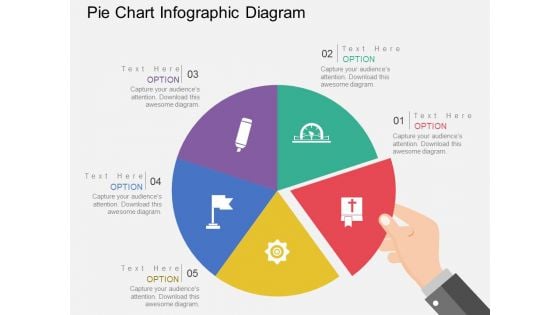
Pie Chart Infographic Diagram Powerpoint Templates
This Power Point template has been designed with pie chart infographic. This business slide is useful to present financial ratio analysis. Use this diagram to make business presentation. Illustrate these thoughts with this slide.
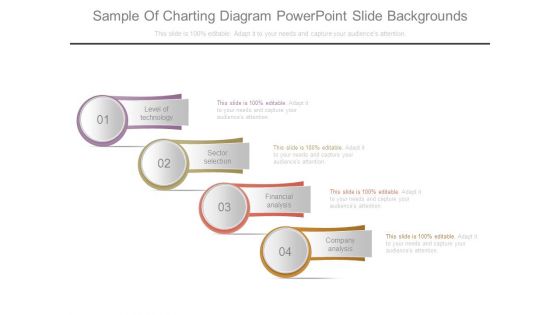
Sample Of Charting Diagram Powerpoint Slide Backgrounds
This is a sample of charting diagram powerpoint slide backgrounds. This is a four stage process. The stages in this process are level of technology, sector selection, financial analysis, company analysis.
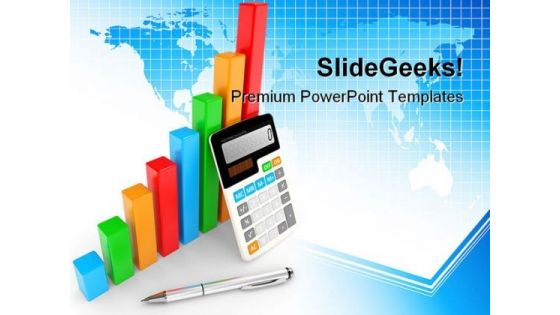
Business Chart Showing Finance PowerPoint Themes And PowerPoint Slides 0411
Microsoft PowerPoint Theme and Slide with business chart showing financial success objects Take care of your organizationwith our Business Chart Showing Finance PowerPoint Themes And PowerPoint Slides 0411. You'll deliver your best presentation yet.
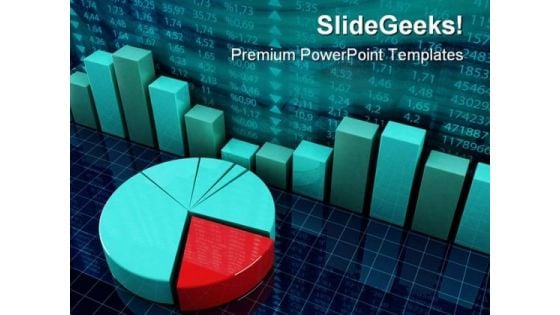
Pie Chart Finance PowerPoint Themes And PowerPoint Slides 0511
Microsoft PowerPoint Slide and Theme with pie chart with financial success concept Our Pie Chart Finance PowerPoint Themes And PowerPoint Slides 0511 ensure a creditable performance. You will certainly recieve more than due applause.
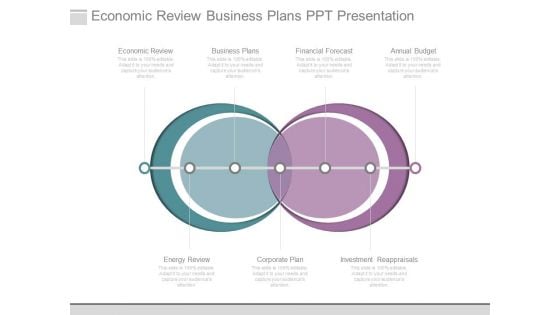
Economic Review Business Plans Ppt Presentation
This is a economic review business plans ppt presentation. This is a two stage process. The stages in this process are economic review, business plans, financial forecast, annual budget, energy review, corporate plan, investment reappraisals.
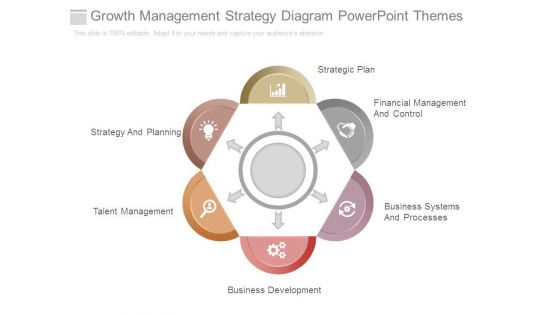
Growth Management Strategy Diagram Powerpoint Themes
This is a growth management strategy diagram powerpoint themes. This is a six stage process. The stages in this process are strategic plan, financial management and control, strategy and planning, talent management, business development, business systems and processes.
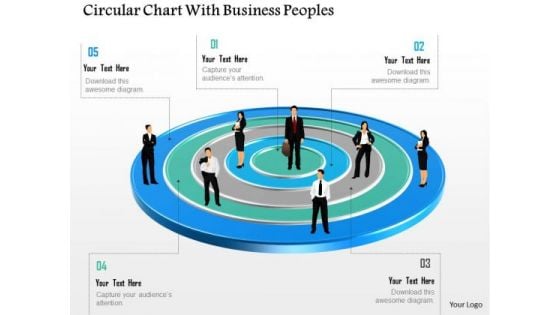
Business Diagram Circular Chart With Business Peoples Presentation Template
This business diagram has been designed with graphic of business people on circular chart. This diagram is designed to depict team meeting on financial matter. This diagram offers a way for your audience to visually conceptualize the process.

Client Testimonials Template 1 Ppt PowerPoint Presentation Diagrams
This is a client testimonials template 1 ppt powerpoint presentation diagrams. This is a two stage process. The stages in this process are john doe, julie star, financial advisor.
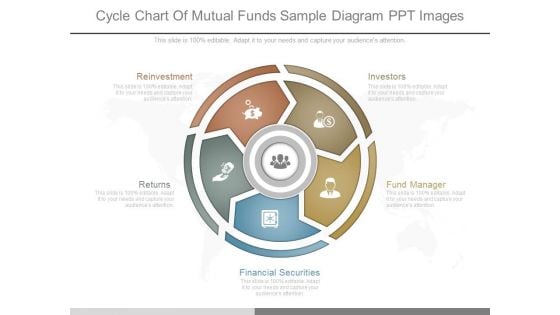
Cycle Chart Of Mutual Funds Sample Diagram Ppt Images
This is a cycle chart of mutual funds sample diagram ppt images. This is a five stage process. The stages in this process are reinvestment, returns, investors, fund manager, financial securities.
Business 2013 Money PowerPoint Templates And PowerPoint Themes 0712
Business 2013 Money PowerPoint Templates And PowerPoint Themes 0712-Microsoft Powerpoint Templates and Background with financial and business chart Access our Business 2013 Money PowerPoint Templates And PowerPoint Themes 0712 anytime,anywhere. They are available around the clock.
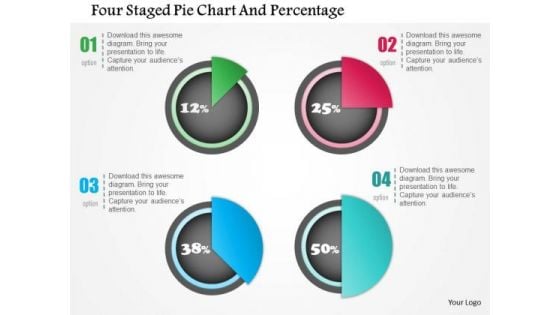
Business Diagram Four Staged Pie Chart And Percentage Presentation Template
Four staged pie chart and percentage values has been used to design this power point template. This PPT contains the concept of financial result analysis. Use this PPT for business and marketing related presentations.
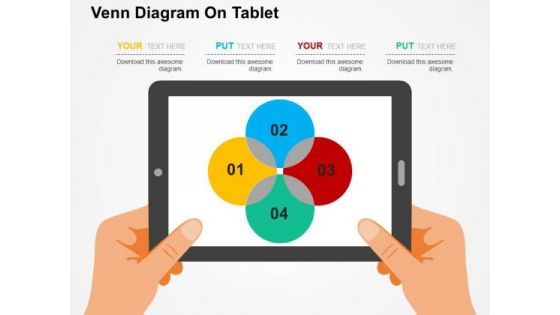
Venn Diagram On Tablet PowerPoint Template
Adjust the above image into your Presentations to visually support your content. This slide has been professionally designed with Venn diagram. This template offers an excellent background to display financial analysis.
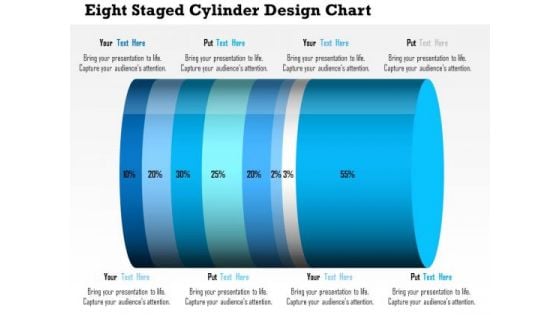
Business Daigram Eight Staged Cylinder Design Chart Presentation Templets
This business diagram contains eight staged cylinder design chart with percentage ratio. Download this diagram to display financial analysis. Use this diagram to make business and marketing related presentations.
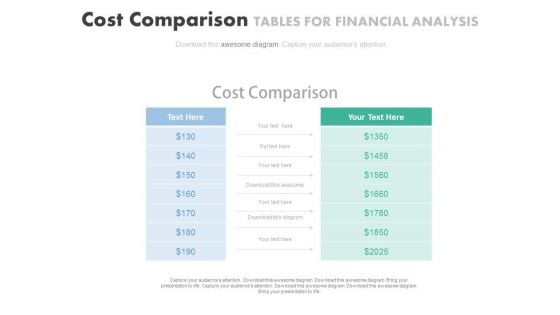
Cost Comparison Table Chart Powerpoint Slides
Our above PPT slide displays cost comparison table chart. This diagram may be used to display cost comparison and financial analysis. Download this PowerPoint template to leave permanent impression on your audience.
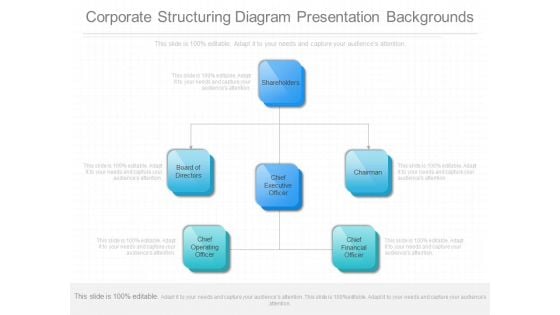
Corporate Structuring Diagram Presentation Backgrounds
This is a corporate structuring diagram presentation backgrounds. This is a three stage process. The stages in this process are shareholders, board of directors, chief executive officer, chairman, chief operating officer, chief financial officer.
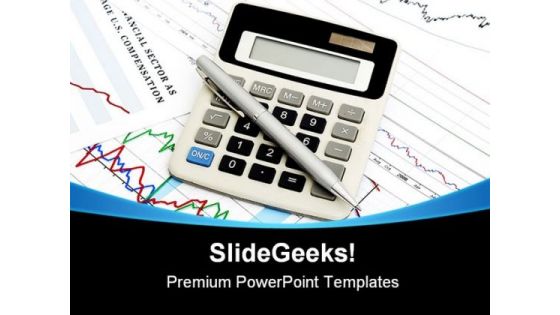
Business Chart Finance PowerPoint Templates And PowerPoint Backgrounds 0211
Microsoft PowerPoint Template and Background with business chart shows financial success at the stock market Our Business Chart Finance PowerPoint Templates And PowerPoint Backgrounds 0211 will benefit your Ideas. They will deliver better dividends.
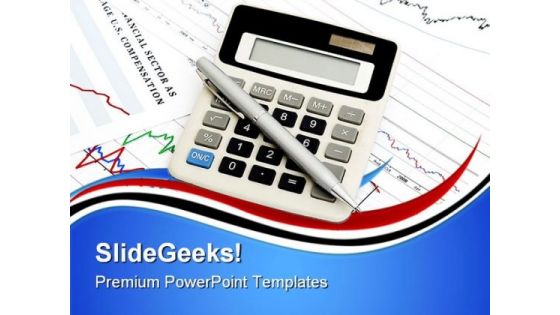
Business Chart Finance PowerPoint Templates And PowerPoint Backgrounds 1011
Microsoft PowerPoint Template and Background with business chart showing financial success at the stock market Our Business Chart Finance PowerPoint Templates And PowerPoint Backgrounds 1011 define the standards. Like you they excel at what they do.
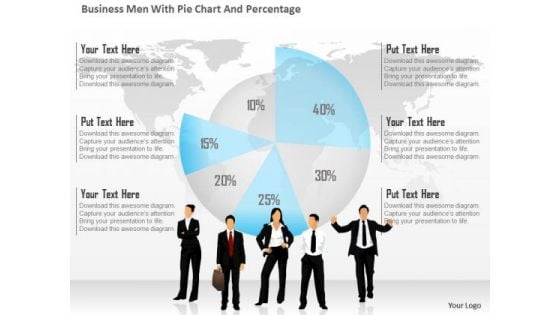
Business Diagram Business Men With Pie Chart And Percentage Presentation Template
This business diagram has been designed with graphic of business people and pie chart with percentage. This diagram is designed to depict team meeting on financial matter. This diagram offers a way for your audience to visually conceptualize the process.
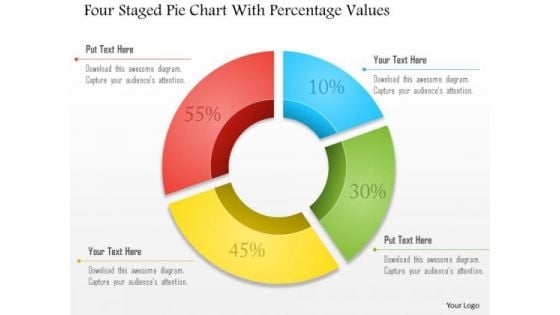
Business Diagram Four Staged Pie Chart With Percentage Values Presentation Template
Four staged pie chart and percentage values are used to design this business slide. Download this diagram to make business and financial reports. Use our above diagram to express information in a visual way.
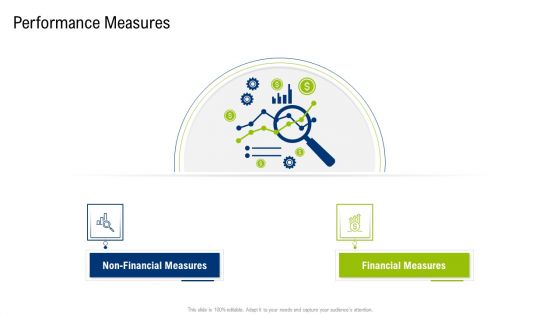
Multiple Phases For Supply Chain Management Performance Measures Themes PDF
This is a multiple phases for supply chain management performance measures themes pdf template with various stages. Focus and dispense information on two stages using this creative set, that comes with editable features. It contains large content boxes to add your information on topics like non financial measures, financial measures. You can also showcase facts, figures, and other relevant content using this PPT layout. Grab it now.

Graph Finance PowerPoint Themes And PowerPoint Slides 0511
Microsoft PowerPoint Slide and Theme with financial success concept golden compass with growing bar chart from golden coins Expose your audience to your brilliance. Our Graph Finance PowerPoint Themes And PowerPoint Slides 0511 will spotlight you on centrestage.
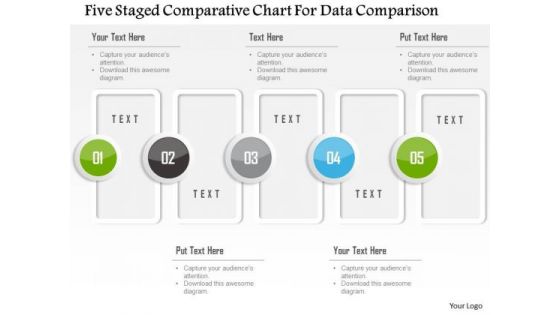
Business Diagram Five Staged Comparative Chart For Data Comparison Presentation Template
Five staged comparative chart has been used to design this power point template. This PPT contains the concept of data comparison. Use this PPT for your business and finance based data comparison in any financial presentation.
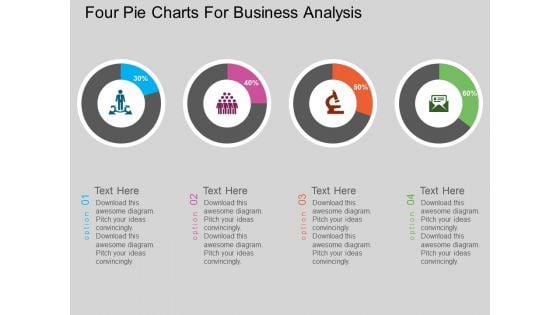
Four Pie Charts For Business Analysis Powerpoint Template
This PowerPoint template has been designed with graphics of four pie charts This diagram can be used to display financial planning and business analysis. Capture the attention of your audience with this slide.

Graph01 Finance PowerPoint Themes And PowerPoint Slides 0511
Microsoft PowerPoint Slide and Theme with financial computing deskto computer with bar chart Interpret plans with our Graph01 Finance PowerPoint Themes And PowerPoint Slides 0511. Download without worries with our money back guaranteee.
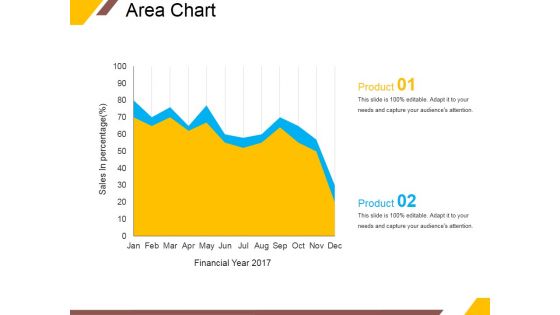
Area Chart Ppt PowerPoint Presentation Layouts Vector
This is a area chart ppt powerpoint presentation layouts vector. This is a two stage process. The stages in this process are area chart, product, sales in percentage, financial year.
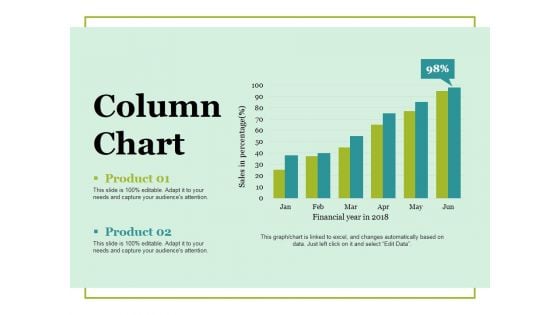
Column Chart Ppt PowerPoint Presentation Ideas Vector
This is a column chart ppt powerpoint presentation ideas vector. This is a two stage process. The stages in this process are column chart, product, financial years, sales in percentage, growth.
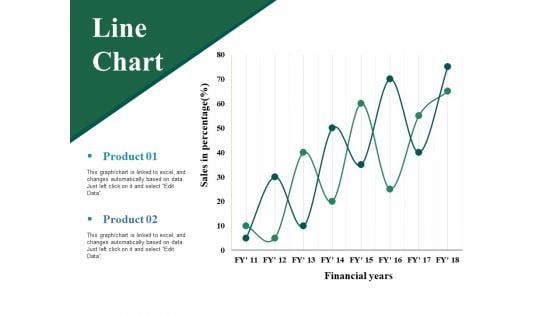
Line Chart Ppt PowerPoint Presentation Professional Grid
This is a line chart ppt powerpoint presentation professional grid. This is a two stage process. The stages in this process are sales in percentage, financial years, product, line chart.
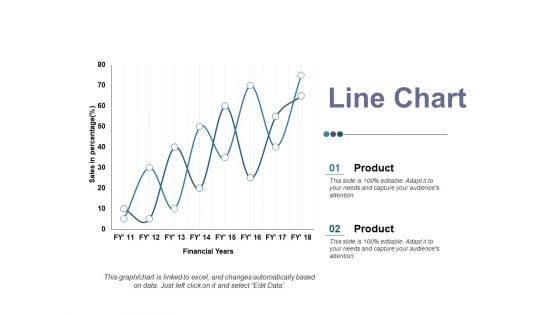
Line Chart Ppt PowerPoint Presentation Ideas Elements
This is a line chart ppt powerpoint presentation ideas elements. This is a two stage process. The stages in this process are product, sales in percentage, financial year, business, line chart.
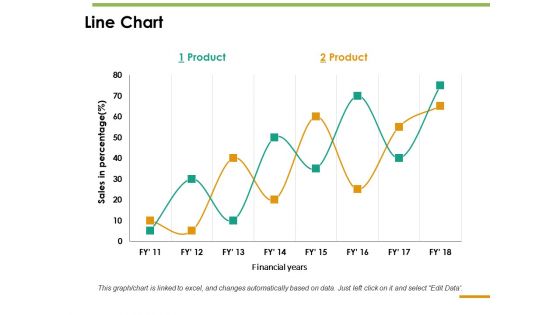
Line Chart Ppt PowerPoint Presentation Inspiration Guide
This is a line chart ppt powerpoint presentation inspiration guide. This is a two stage process. The stages in this process are line chart, sales in percentage, product, financial years.
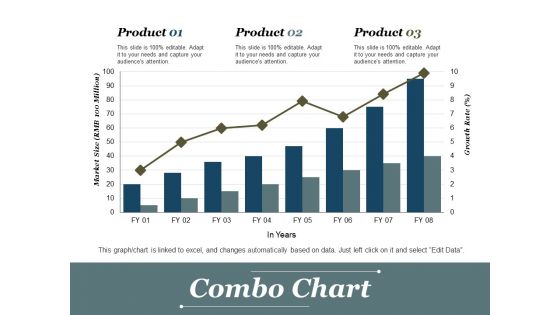
Combo Chart Ppt PowerPoint Presentation Slides Outline
This is a combo chart ppt powerpoint presentation slides outline. This is a three stage process. The stages in this process are combo chart, growth, product, financial year, business.
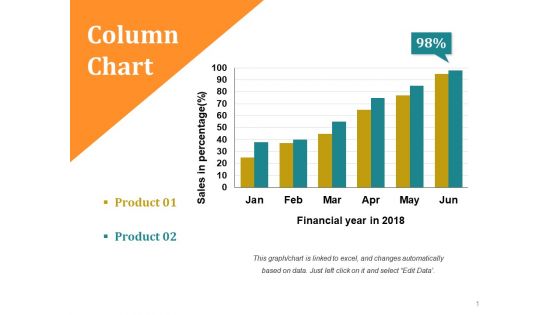
Column Chart Ppt PowerPoint Presentation Slides Smartart
This is a column chart ppt powerpoint presentation slides smartart. This is a two stage process. The stages in this process are sales in percentage, financial year in, business, growth, strategy.
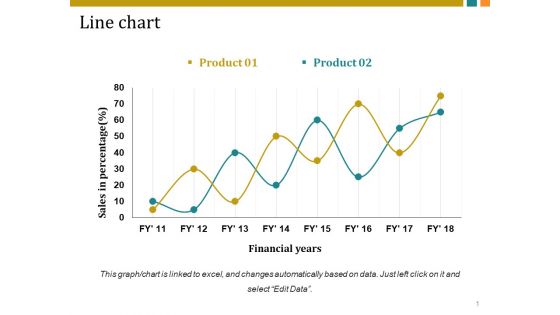
Line Chart Ppt PowerPoint Presentation Inspiration Vector
This is a line chart ppt powerpoint presentation inspiration vector. This is a two stage process. The stages in this process are sales in percentage, financial years, business, marketing, growth.
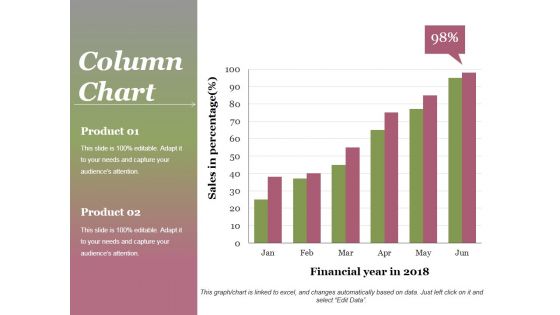
Column Chart Ppt PowerPoint Presentation Gallery Background
This is a column chart ppt powerpoint presentation gallery background. This is a two stage process. The stages in this process are product, sales in percentage, financial year, graph, success.
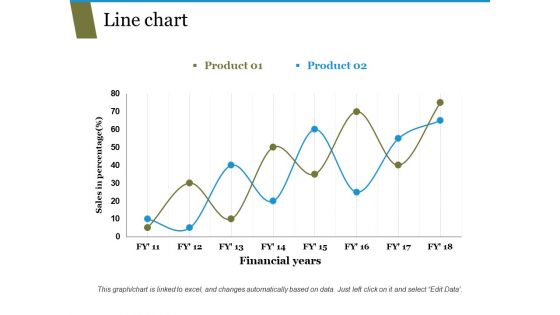
Line Chart Ppt PowerPoint Presentation Pictures Templates
This is a line chart ppt powerpoint presentation pictures templates. This is a two stage process. The stages in this process are sales in percentage, financial years, business, marketing, growth.
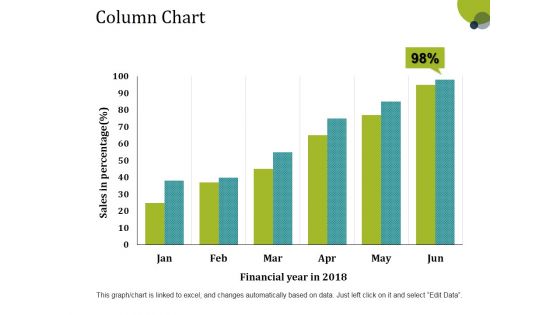
Column Chart Ppt PowerPoint Presentation Layouts Tips
This is a column chart ppt powerpoint presentation layouts tips. This is a six stage process. The stages in this process are sales in percentage, financial year, bar graph, growth, success.
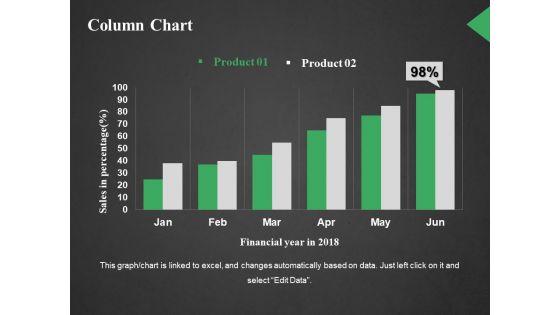
Column Chart Ppt PowerPoint Presentation Outline Styles
This is a column chart ppt powerpoint presentation outline styles. This is a two stage process. The stages in this process are sales in percentage, financial year in, business, marketing, graph.
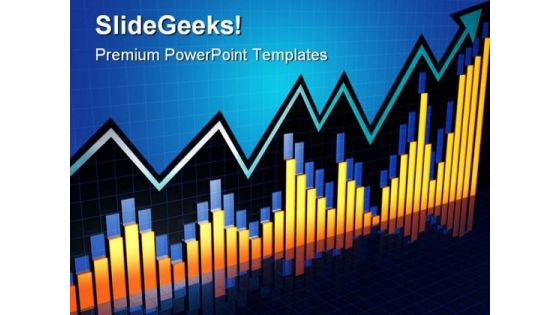
Chart Growth Business PowerPoint Template 0910
Arrow pointing to the higher financial chart bar 3d illustration Enter onto your new path with our Chart Growth Business PowerPoint Template 0910. Your thoughts will make a solid beginning.
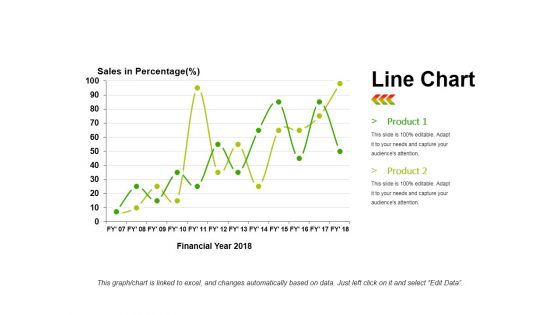
Line Chart Ppt PowerPoint Presentation Infographics Infographics
This is a line chart ppt powerpoint presentation infographics infographics. This is a two stage process. The stages in this process are product, sales in percentage, financial year, line chart, finance.
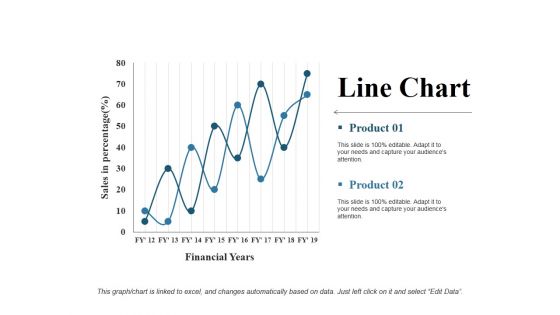
Line Chart Ppt PowerPoint Presentation Gallery Rules
This is a line chart ppt powerpoint presentation gallery rules. This is a two stage process. The stages in this process are financial years, product, sales in percentage, line chart, growth.
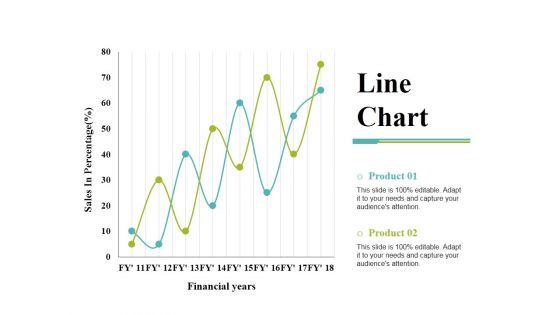
Line Chart Ppt PowerPoint Presentation Gallery Templates
This is a line chart ppt powerpoint presentation gallery templates. This is a two stage process. The stages in this process are product, financial years, sales in percentage, line chart.
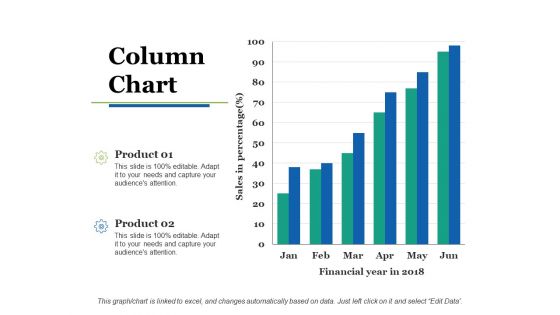
Column Chart Ppt PowerPoint Presentation Slides Show
This is a column chart ppt powerpoint presentation slides show. This is a two stage process. The stages in this process are column chart, product, sales in percentage, financial year, growth.
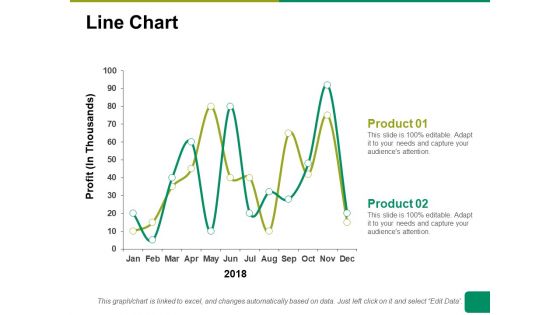
Line Chart Ppt PowerPoint Presentation Summary Ideas
This is a line chart ppt powerpoint presentation summary ideas. This is a two stage process. The stages in this process are line chart, profit, product, financial years, business.
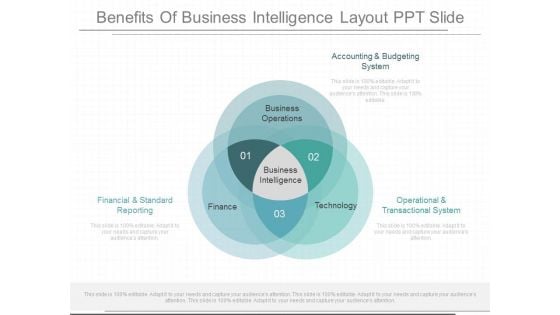
Benefits Of Business Intelligence Layout Ppt Slide
This is a benefits of business intelligence layout ppt slide. This is a three stage process. The stages in this process are accounting and budgeting system, financial and standard reporting, operational and transactional system, business operations, business intelligence, finance, technology.
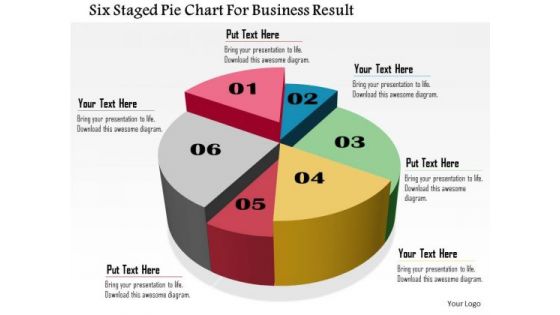
Business Daigram Six Staged Pie Chart For Business Result Presentation Templets
Six staged pie chart is used to design this business slide. Download this diagram to make business and financial reports. Use our above diagram to express information in a visual way.
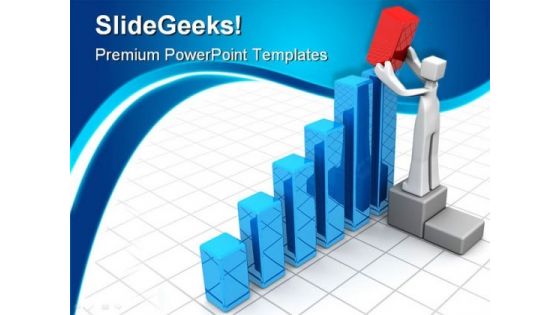
Growth Graph Finance PowerPoint Themes And PowerPoint Slides 0511
Microsoft PowerPoint Theme and Slide with businessman adding a red bar chart to increase financial growth Our Growth Graph Finance PowerPoint Themes And PowerPoint Slides 0511 empower educators. Conveying concepts and ideas becomes easier.
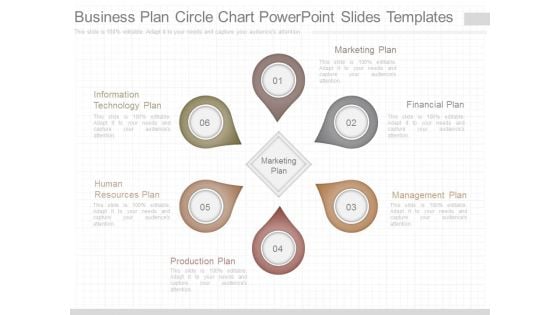
Business Plan Circle Chart Powerpoint Slides Templates
This is a business plan circle chart powerpoint slides templates. This is a six stage process. The stages in this process are information technology plan, human resources plan, production plan, marketing plan, marketing plan, financial plan, management plan.
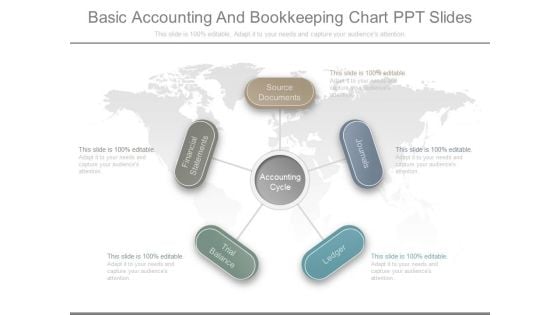
Basic Accounting And Bookkeeping Chart Ppt Slides
This is a basic accounting and bookkeeping chart ppt slides. This is a five stage process. The stages in this process are financial statements, source documents, accounting cycle, journals, ledger, trial balance.
Circular Flow Of Income Chart Ppt Presentation
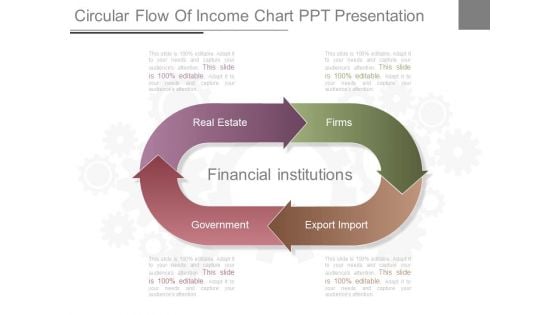
This is a circular flow of income chart ppt presentation. This is a four stage process. The stages in this process are real estate, government, financial institutions, export import, firms.
Marchandise Management System Chart Ppt Sample
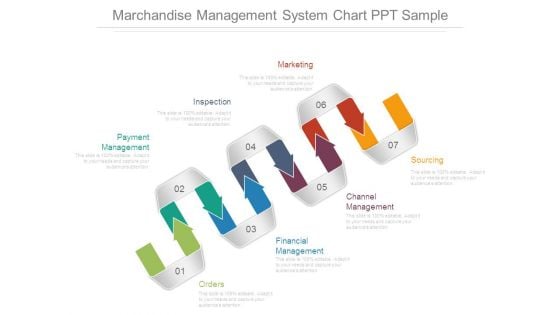
This is a marchandise management system chart ppt sample. This is a seven stage process. The stages in this process are payment management, inspection, marketing, sourcing, channel management, financial management, orders.
Corporate Leadership Skills Chart Presentation Design
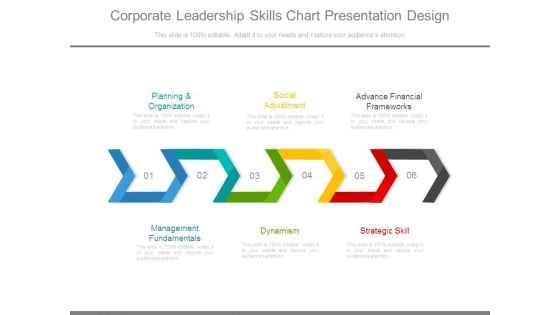
This is a corporate leadership skills chart presentation design. This is a six stage process. The stages in this process are planning and organization, social adjustment, advance financial frameworks, management fundamentals, dynamism, strategic skill.
Area Chart Ppt PowerPoint Presentation Pictures Files
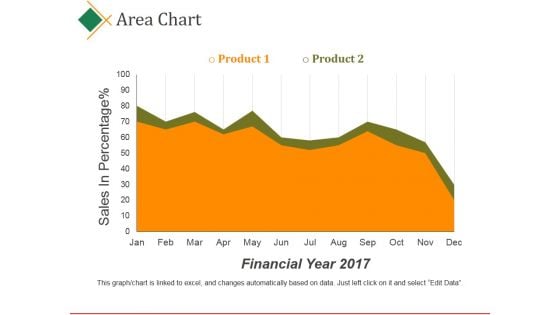
This is a area chart ppt powerpoint presentation pictures files. This is a two stage process. The stages in this process are product, sales, in percentage, financial year, business.
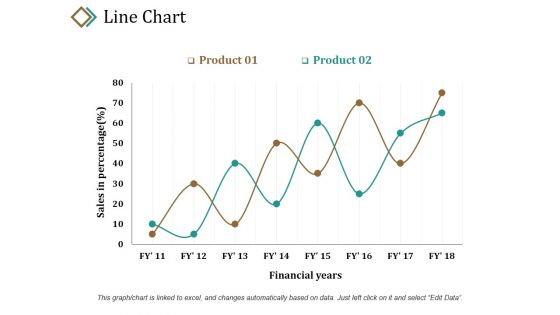
Line Chart Ppt PowerPoint Presentation Layouts Example
This is a line chart ppt powerpoint presentation layouts example. This is a two stage process. The stages in this process are sales in percentage, product, financial years, growth, success.

Line Chart Ppt PowerPoint Presentation Show Guide
This is a line chart ppt powerpoint presentation show guide. This is a two stage process. The stages in this process are product, sales in percentage, financial years, growth, success.
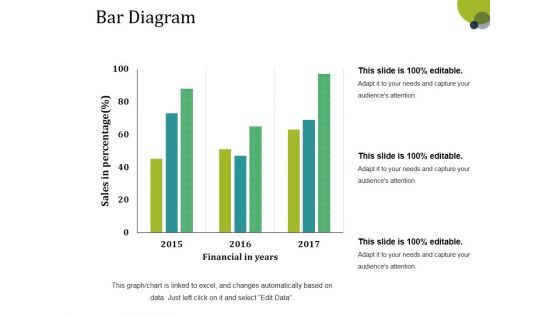
Bar Diagram Ppt PowerPoint Presentation Gallery Structure
This is a bar diagram ppt powerpoint presentation gallery structure. This is a three stage process. The stages in this process are financial in years, sales in percentage, bar graph, growth, success.
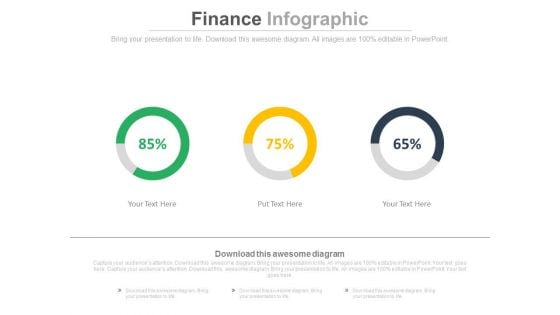
Linear Circles Percentage Analysis Charts Powerpoint Slides
This PowerPoint template has been designed with graphics of three circles and percentage ratios. You may use this dashboard slide design for topics like profit growth and financial planning. This PPT slide is powerful tool to describe your ideas.
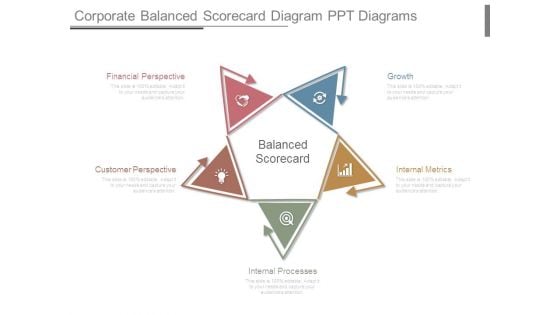
Corporate Balanced Scorecard Diagram Ppt Diagrams
This is a corporate balanced scorecard diagram ppt diagrams. This is a five stage process. The stages in this process are financial perspective, customer perspective, internal processes, growth, internal metrics, balanced scorecard.

Blue Arrow Success PowerPoint Themes And PowerPoint Slides 0511
Microsoft PowerPoint Theme and Slide with diagram of financial growth Club your thoughts with our Blue Arrow Success PowerPoint Themes And PowerPoint Slides 0511. Together they will create an astounding effect.
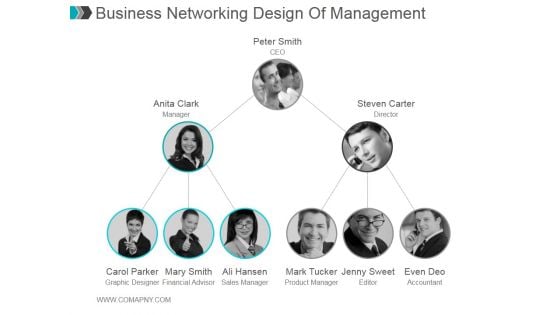
Business Networking Design Of Management Ppt PowerPoint Presentation Show
This is a business networking design of management ppt powerpoint presentation show. This is a three stage process. The stages in this process are ceo, manager, director, graphic designer, financial advisor, sales manager, product manager, editor, accountant.
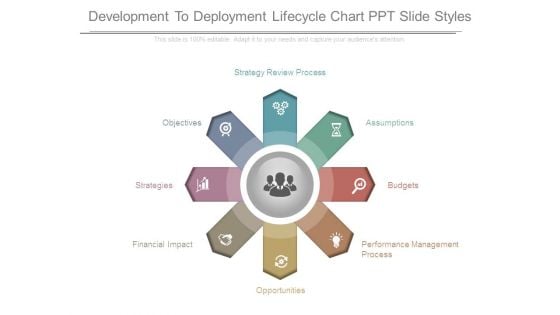
Development To Deployment Lifecycle Chart Ppt Slide Styles
This is a development to deployment lifecycle chart ppt slide styles. This is a eight stage process. The stages in this process are performance management process, opportunities, financial impact, strategies, objectives, strategy review process, assumptions, budgets.
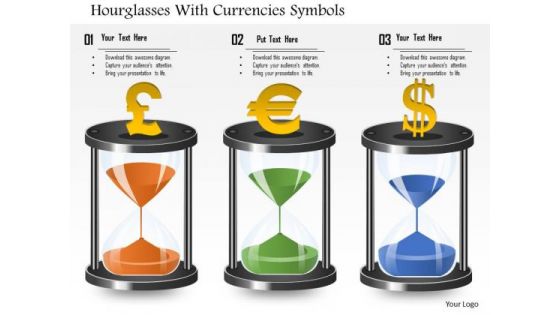
Business Diagram Hourglasses With Currencies Symbols Presentation Template
Download this diagram to display time management tips for financial professionals. This business diagram contains the graphic of hourglasses with currency symbols. Use this template to highlight the key issues of your presentation.

 Home
Home