Financial Icons
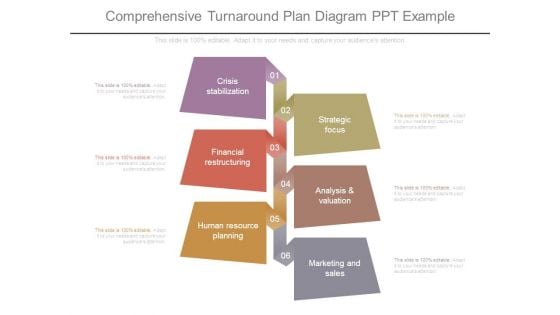
Comprehensive Turnaround Plan Diagram Ppt Example
This is a comprehensive turnaround plan diagram ppt example. This is a six stage process. The stages in this process are crisis stabilization, financial restructuring, human resource planning, strategic focus, analysis and valuation, marketing and sales.
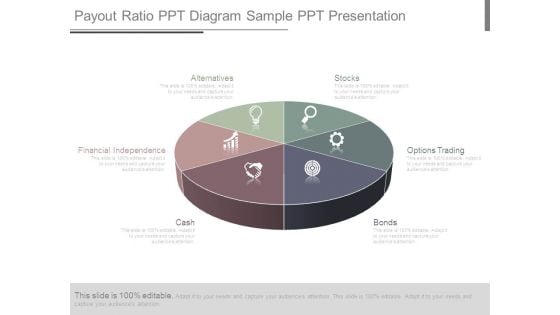
Payout Ratio Ppt Diagram Sample Ppt Presentation
This is a payout ratio ppt diagram sample ppt presentation. This is a six stage process. The stages in this process are stocks, options trading, bonds, cash, financial independence, alternatives.
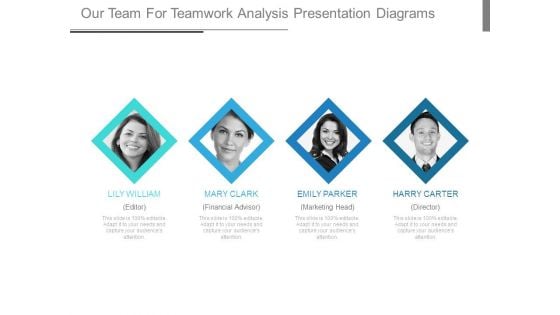
Our Team For Teamwork Analysis Presentation Diagrams
This is a our team for teamwork analysis presentation diagrams. This is a four stage process. The stages in this process are lily william editor, mary clark financial advisor, emily parker marketing head, harry carter director.
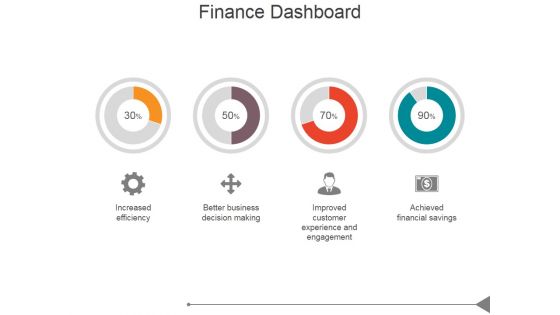
Finance Dashboard Ppt PowerPoint Presentation Diagrams
This is a finance dashboard ppt powerpoint presentation diagrams. This is a four stage process. The stages in this process are increased efficiency, better business decision making, improved customer experience and engagement, achieved financial savings.
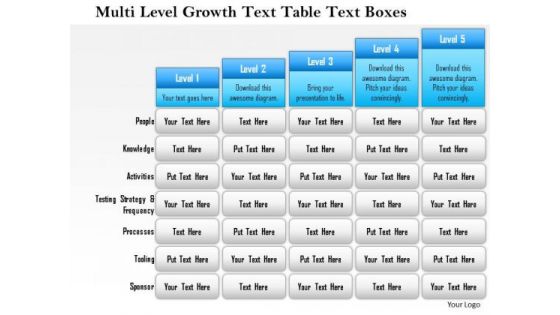
Business Framework Multi Level Growth Text Table Text Boxes 2 PowerPoint Presentation
Five staged text box style chart in bar graph design has been used to decorate this power point template slide. This diagram slide contains the multilevel growth concept. Use this PPT slide for financial growth and result analysis related topics.
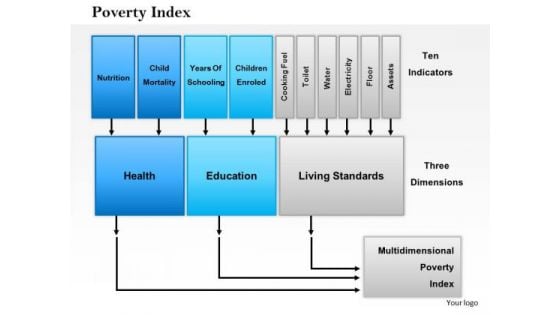
Business Framework Poverty Index PowerPoint Presentation
A linear growth chart with text boxes has been used to decorate this Power Point template slide. This diagram slide contains the concept of poverty index. Use this index in your financial presentations to show poverty based calculation.
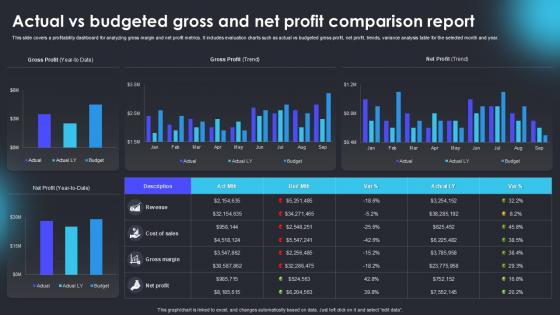
Actual Vs Budgeted Gross And Net Profit Comparison Report
Boost your pitch with our creative Actual Vs Budgeted Gross And Net Profit Comparison Report. Deliver an awe-inspiring pitch that will mesmerize everyone. Using these presentation templates you will surely catch everyones attention. You can browse the ppts collection on our website. We have researchers who are experts at creating the right content for the templates. So you do not have to invest time in any additional work. Just grab the template now and use them. This PowerPoint template is designed to present a detailed comparison between actual financial performance and budgeted projections for gross and net profit. It includes charts, graphs, and tables to effectively illustrate variances, percentage differences, and key financial insights. The template helps in identifying discrepancies, evaluating financial strategies, and guiding corrective measures. Ideal for finance professionals, analysts, and business executives for quarterly, annual, or project-based financial reviews.
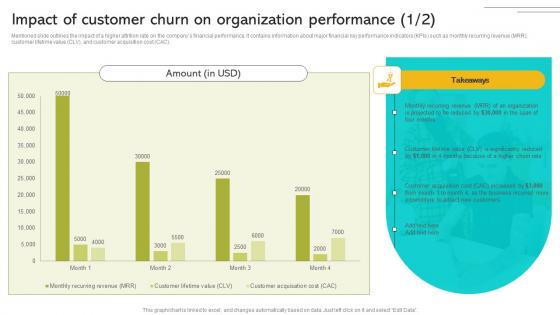
Implementing Strategies To Enhance Impact Of Customer Churn On Organization Performance Infographics PDF
Mentioned slide outlines the impact of a higher attrition rate on the companys financial performance. It contains information about major financial key performance indicators KPIs such as monthly recurring revenue MRR, customer lifetime value CLV, and customer acquisition cost CAC. Make sure to capture your audiences attention in your business displays with our gratis customizable Implementing Strategies To Enhance Impact Of Customer Churn On Organization Performance Infographics PDF These are great for business strategies, office conferences, capital raising or task suggestions. If you desire to acquire more customers for your tech business and ensure they stay satisfied, create your own sales presentation with these plain slides. Mentioned slide outlines the impact of a higher attrition rate on the companys financial performance. It contains information about major financial key performance indicators KPIs such as monthly recurring revenue MRR, customer lifetime value CLV, and customer acquisition cost CAC.
Strategy Diagram Profit And Loss Balance And Cash Flow Statements Mba Models And Frameworks
Be The Doer With Our Strategy Diagram Profit And Loss Balance And Cash Flow Statements MBA Models And Frameworks Powerpoint Templates. Put Your Thoughts Into Practice.
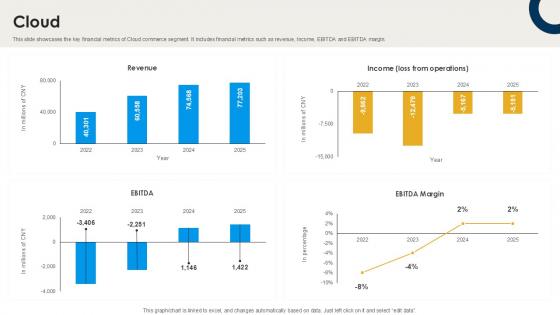
Cloud International Trade Of Products And Services PPT Sample CP SS V
This slide showcases the key financial metrics of Cloud commerce segment. It includes financial metrics such as revenue, Income, EBITDA and EBITDA margin. Do you have to make sure that everyone on your team knows about any specific topic I yes, then you should give Cloud International Trade Of Products And Services PPT Sample CP SS V a try. Our experts have put a lot of knowledge and effort into creating this impeccable Cloud International Trade Of Products And Services PPT Sample CP SS V. You can use this template for your upcoming presentations, as the slides are perfect to represent even the tiniest detail. You can download these templates from the Slidegeeks website and these are easy to edit. So grab these today This slide showcases the key financial metrics of Cloud commerce segment. It includes financial metrics such as revenue, Income, EBITDA and EBITDA margin.
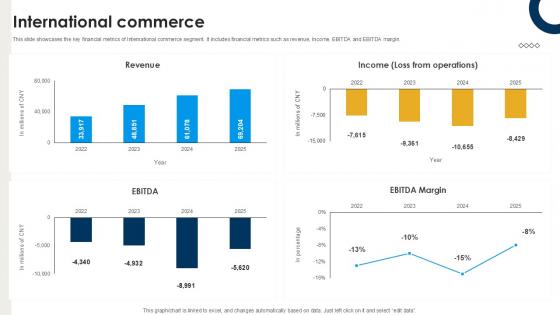
International Commerce International Trade Of Products And Services PPT Presentation CP SS V
This slide showcases the key financial metrics of International commerce segment. It includes financial metrics such as revenue, Income, EBITDA and EBITDA margin. Coming up with a presentation necessitates that the majority of the effort goes into the content and the message you intend to convey. The visuals of a PowerPoint presentation can only be effective if it supplements and supports the story that is being told. Keeping this in mind our experts created International Commerce International Trade Of Products And Services PPT Presentation CP SS V to reduce the time that goes into designing the presentation. This way, you can concentrate on the message while our designers take care of providing you with the right template for the situation. This slide showcases the key financial metrics of International commerce segment. It includes financial metrics such as revenue, Income, EBITDA and EBITDA margin.
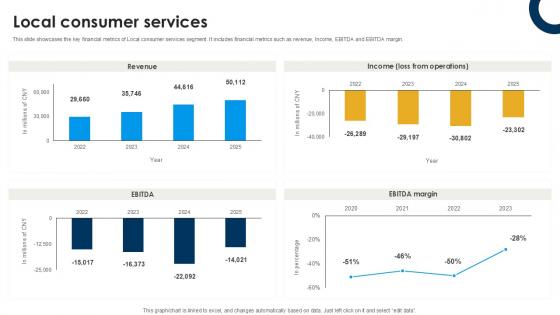
Local Consumer Services International Trade Of Products And Services PPT Example CP SS V
This slide showcases the key financial metrics of Local consumer services segment. It includes financial metrics such as revenue, Income, EBITDA and EBITDA margin. Welcome to our selection of the Local Consumer Services International Trade Of Products And Services PPT Example CP SS V. These are designed to help you showcase your creativity and bring your sphere to life. Planning and Innovation are essential for any business that is just starting out. This collection contains the designs that you need for your everyday presentations. All of our PowerPoints are 100Percent editable, so you can customize them to suit your needs. This multi-purpose template can be used in various situations. Grab these presentation templates today. This slide showcases the key financial metrics of Local consumer services segment. It includes financial metrics such as revenue, Income, EBITDA and EBITDA margin.
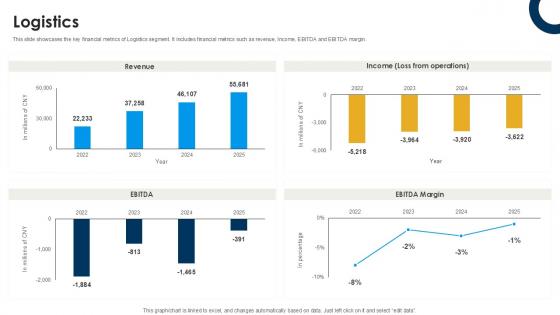
Logistics International Trade Of Products And Services PPT Sample CP SS V
This slide showcases the key financial metrics of Logistics segment. It includes financial metrics such as revenue, Income, EBITDA and EBITDA margin. Explore a selection of the finest Logistics International Trade Of Products And Services PPT Sample CP SS V here. With a plethora of professionally designed and pre-made slide templates, you can quickly and easily find the right one for your upcoming presentation. You can use our Logistics International Trade Of Products And Services PPT Sample CP SS V to effectively convey your message to a wider audience. Slidegeeks has done a lot of research before preparing these presentation templates. The content can be personalized and the slides are highly editable. Grab templates today from Slidegeeks. This slide showcases the key financial metrics of Logistics segment. It includes financial metrics such as revenue, Income, EBITDA and EBITDA margin.

Graph Finance PowerPoint Templates And PowerPoint Backgrounds 0511
Microsoft PowerPoint Template and Background with financial success concept golden compass with growing bar chart from golden coins Instruct your team with our Graph Finance PowerPoint Templates And PowerPoint Backgrounds 0511. Make sure your presentation gets the attention it deserves.
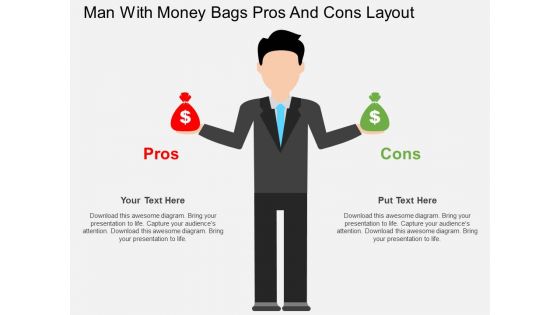
Man With Money Bags Pros And Cons Layout Powerpoint Templates
Create dynamic presentations with our professional template containing graphics of man with money bag in hands. This diagram is useful to display pros and cons of financial plan. Download this template to leave permanent impression on your audience.
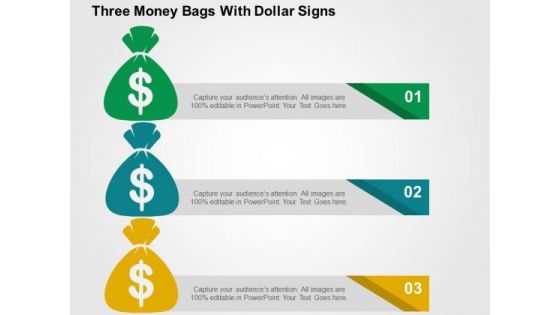
Three Money Bags With Dollar Signs PowerPoint Templates
This unique template displays diagram of three money bags with dollar symbol. This professional slide helps to represent financial planning and execution. This graphic slide is an effective tool to make your clients understand the topic.
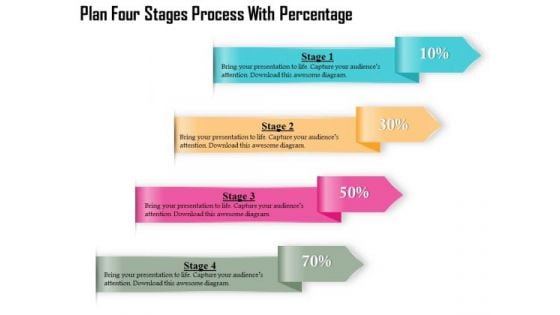
Business Diagram Four Stages Process With Percentage Presentation Template
Four multicolored tags in vertical order has been used to decorate this business diagram. This diagram contains the concept of financial data display with percent values. This diagram can be used for management and finance related presentations.

Business Diagram Three Stages Process Percentage Presentation Template
Three multicolored tags in vertical order has been used to decorate this business diagram. This diagram contains the concept of financial data display with percent values. This diagram can be used for management and finance related presentations.
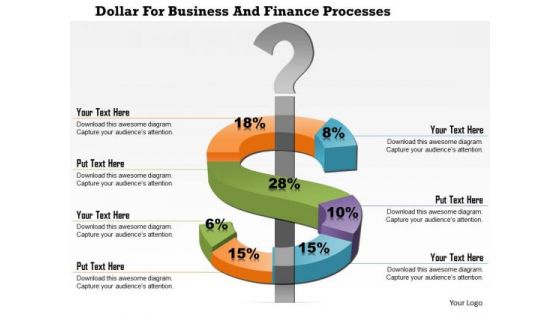
Business Diagram Dollar For Business And Finance Processes Presentation Template
This business diagram displays dollar symbol around a question mark. This diagram depicts change in dollar currency value. Use this slide to make financial and business reports and presentations.
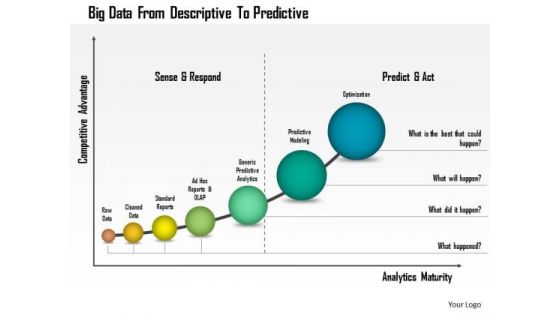
Business Diagram Big Data From Descriptive To Predictive Presentation Template
This business diagram has been designed with graphic of linear bar graph. This growing bar graph depicts the concept of big data analysis. Use this professional diagram for your financial and business analysis.

Business Diagram Silver Capsule For Medication And Treatment Presentation Template
This business diagram displays graphics of capsule with currency symbol. It contains silver capsule with different currency signs inside it. Use this slide for health care and financial topics. Get professional with this exclusive business slide.
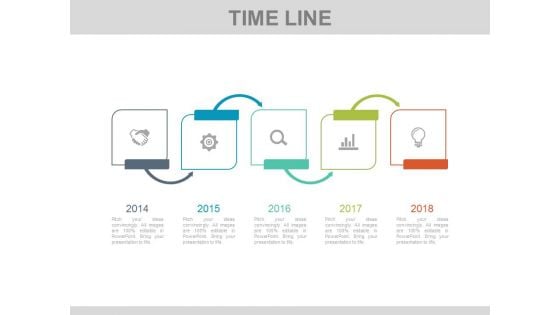
Five Steps Linear Timeline Infographic Diagram Powerpoint Slides
This infographic timeline template can be used for multiple purposes including financial planning, new milestones and tasks. It contains linear timeline infographic diagram. Download this PowerPoint timeline template to make impressive presentations.
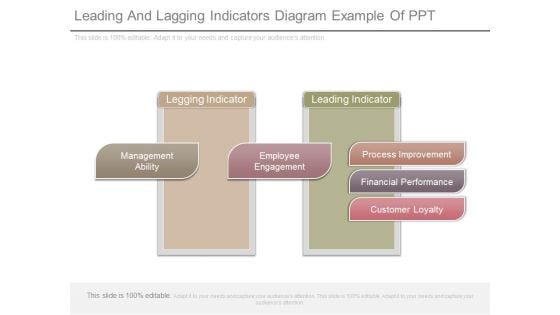
Leading And Lagging Indicators Diagram Example Of Ppt
This is a leading and lagging indicators diagram example of ppt. This is a two stage process. The stages in this process are legging indicator, management ability, employee engagement, leading indicator, process improvement, financial performance, customer loyalty.
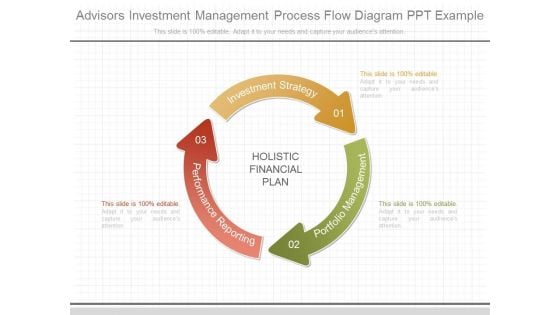
Advisors Investment Management Process Flow Diagram Ppt Example
This is a advisors investment management process flow diagram ppt example. This is a three stage process. The stages in this process are investment strategy, portfolio management, performance reporting, holistic financial plan.

Practice Management Systems For Law Firms Ppt Diagrams
This is a practice management systems for law firms ppt diagrams. This is a five stage process. The stages in this process are financial management, contact management, case management, time management, document management.
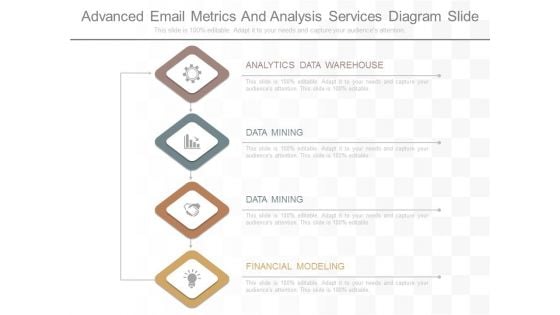
Advanced Email Metrics And Analysis Services Diagram Slide
This is a advanced email metrics and analysis services diagram slide. This is a four stage process. The stages in this process are analytics data warehouse, data mining, financial modeling.
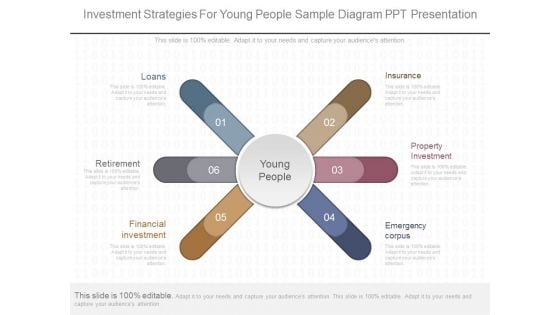
Investment Strategies For Young People Sample Diagram Ppt Presentation
This is a investment strategies for young people sample diagram ppt presentation. This is a six stage process. The stages in this process are loans, retirement, financial investment, emergency corpus, property investment, insurance.
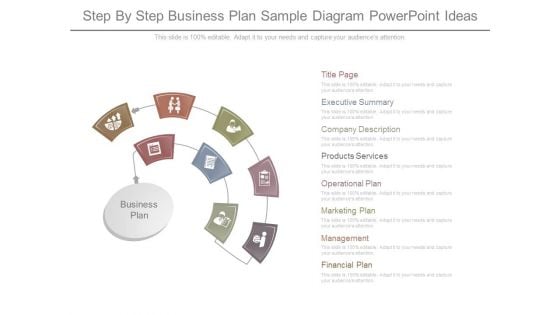
Step By Step Business Plan Sample Diagram Powerpoint Ideas
This is a step by step business plan sample diagram powerpoint ideas. This is a eight stage process. The stages in this process are business plan, title page, executive summary, products services, operational plan, marketing plan, management, financial plan.
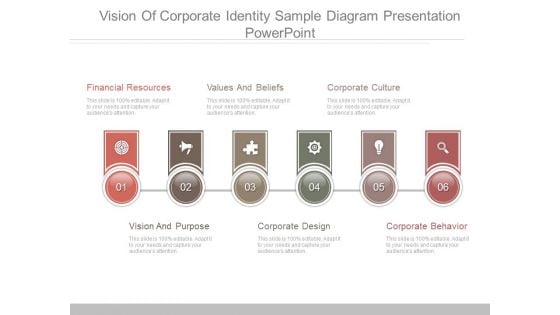
Vision Of Corporate Identity Sample Diagram Presentation Powerpoint
This is a vision of corporate identity sample diagram presentation powerpoint. This is a six stage process. The stages in this process are financial resources, values and beliefs, corporate culture, vision and purpose, corporate design, corporate behavior.
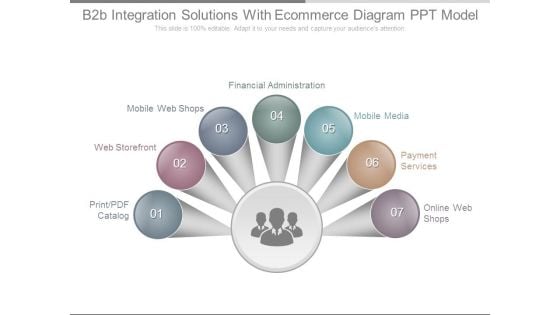
B2b Integration Solutions With Ecommerce Diagram Ppt Model
This is a b2b integration solutions with ecommerce diagram ppt model. This is a seven stage process. The stages in this process are print pdf catalog, web storefront, mobile web shops, financial administration, mobile media, payment services, online web shops.
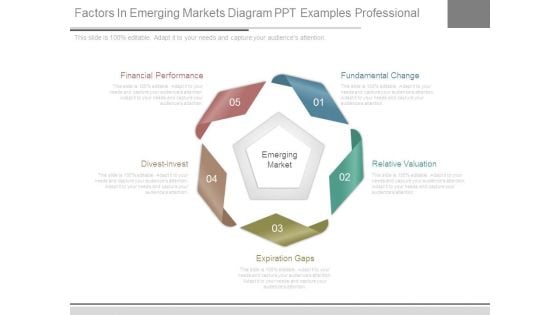
Factors In Emerging Markets Diagram Ppt Examples Professional
This is a factors in emerging markets diagram ppt examples professional. This is a five stage process. The stages in this process are financial performance, fundamental change, relative valuation, expiration gaps, divest invest, emerging market.
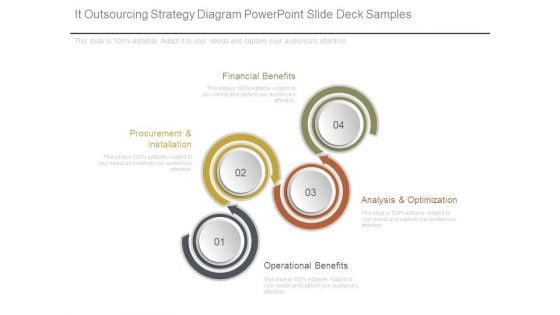
It Outsourcing Strategy Diagram Powerpoint Slide Deck Samples
This is a it outsourcing strategy diagram powerpoint slide deck samples. This is a four stage process. The stages in this process are procurement and installation, financial benefits, operational benefits, analysis and optimization.
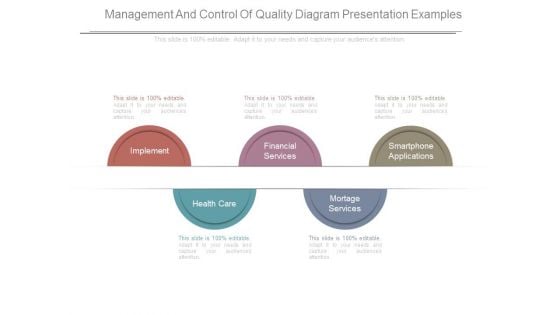
Management And Control Of Quality Diagram Presentation Examples
This is a management and control of quality diagram presentation examples. This is a five stage process. The stages in this process are implement, financial services, smartphone applications, mortage services, health care.
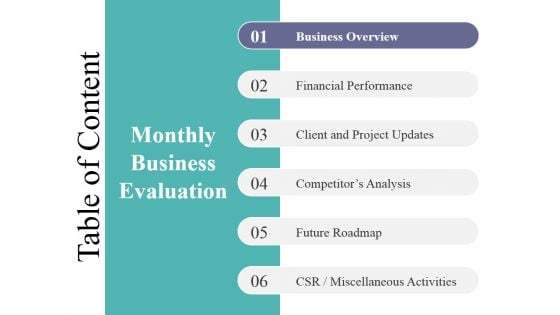
Table Of Content Template 2 Ppt PowerPoint Presentation Model Diagrams
This is a table of content template 2 ppt powerpoint presentation model diagrams. This is a six stage process. The stages in this process are business overview, financial performance, client and project updates, competitors analysis, future roadmap, csr miscellaneous activities.
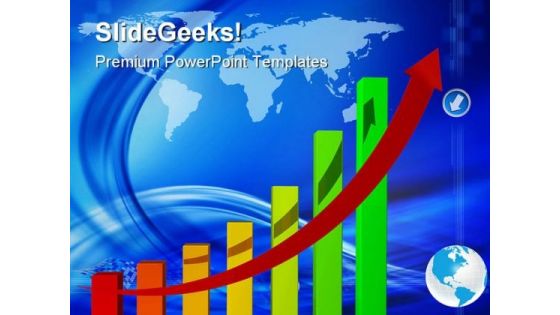
Statistique Of Business Graph Success PowerPoint Themes And PowerPoint Slides 0411
Microsoft PowerPoint Theme and Slide with rainbow colored financial graph showing strong growth all the way up Our Statistique Of Business Graph Success PowerPoint Themes And PowerPoint Slides 0411 are clear to even the farthest. They are designed for distance.
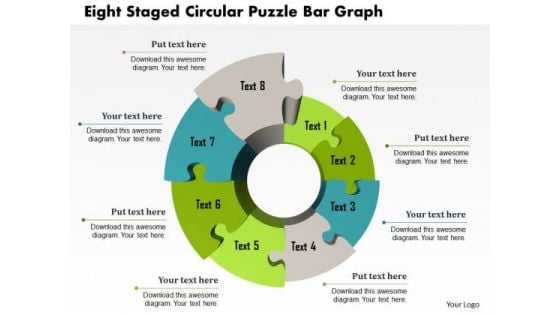
Business Diagram Eight Staged Circular Puzzle Bar Graph Presentation Template
This Power Point template has been crafted with graphic of eight staged circular puzzle and bar graph. This PPT contains the financial result analysis related concept. Use this PPT for your business and success related presentations.
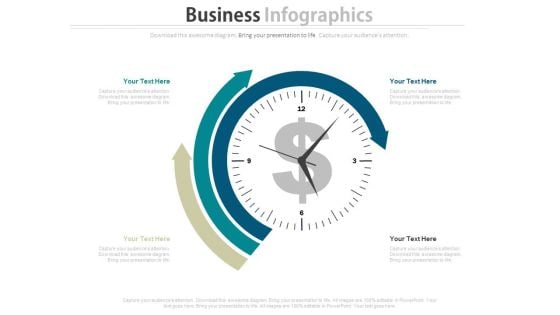
Dashboard Diagram For Finance And Strategic Analysis Powerpoint Slides
This PowerPoint template display graphics of clock with arrows around it and dollar symbol in center. You may use this PPT slide for financial and strategic analysis. This dashboard slide may useful for multilevel status report creation and approval process.
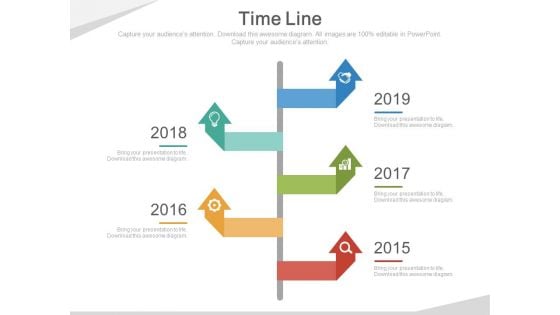
Five Arrows Signboard Style Timeline Diagram Powerpoint Slides
This five arrows signboard style timeline template can be used for multiple purposes including event planning, new milestones and tasks. This PPT slide may be helpful to display financial strategy timeline. Download this PowerPoint timeline template to make impressive presentations.
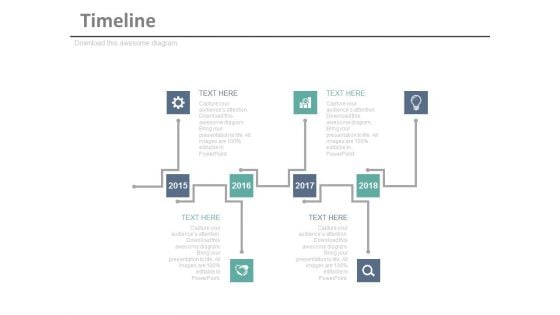
Timeline Infographic Diagram For Business Achievements Powerpoint Slides
This timeline infographic template can be used for multiple purposes including event planning, new milestones and tasks. This PPT slide may be helpful to display financial strategy timeline. Download this PowerPoint timeline template to make impressive presentations.

Five Sequential Year Tags Timeline Diagram Powerpoint Slides
This PowerPoint timeline template can be used for specific organizational objectives. This PPT slide may be helpful to display financial strategy and timeline. Download this PowerPoint timeline template to make impressive presentations.
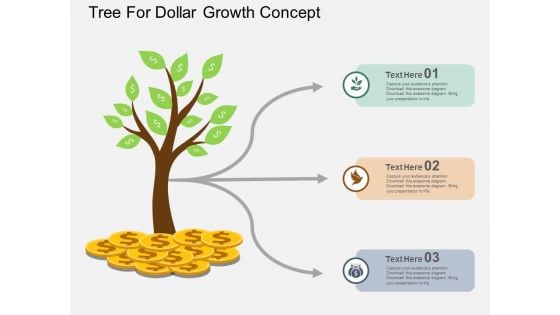
Tree For Dollar Growth Concept Powerpoint Template
This business diagram has been designed with dollar growth tree. You may use this slide to display financial success and growth concepts. Make your mark with this unique slide and create an impression that will endure.
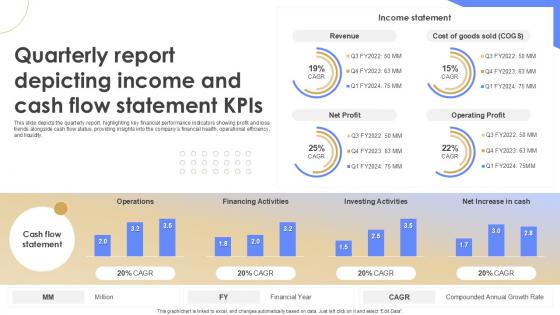
Quarterly Report Depicting Income And Cash Flow Statement KPIS Quarterly Report Ppt Example
This slide depicts the quarterly report, highlighting key financial performance indicators showing profit and loss trends alongside cash flow status, providing insights into the companys financial health, operational efficiency, and liquidity. Do you have an important presentation coming up Are you looking for something that will make your presentation stand out from the rest Look no further than Quarterly Report Depicting Income And Cash Flow Statement KPIS Quarterly Report Ppt Example With our professional designs, you can trust that your presentation will pop and make delivering it a smooth process. And with Slidegeeks, you can trust that your presentation will be unique and memorable. So why wait Grab Quarterly Report Depicting Income And Cash Flow Statement KPIS Quarterly Report Ppt Example today and make your presentation stand out from the rest This slide depicts the quarterly report, highlighting key financial performance indicators showing profit and loss trends alongside cash flow status, providing insights into the companys financial health, operational efficiency, and liquidity.
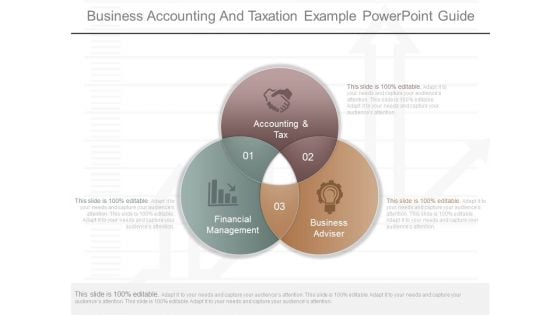
Business Accounting And Taxation Example Powerpoint Guide
This is a business accounting and taxation example powerpoint guide. This is a three stage process. The stages in this process are accounting and tax, financial management, business adviser.
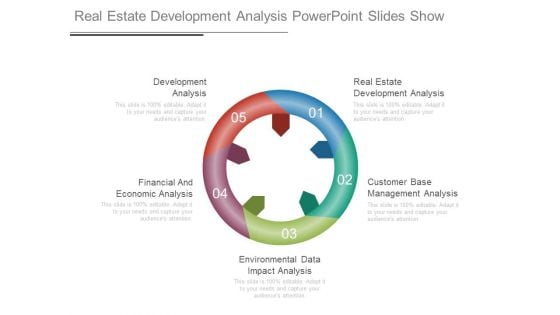
Real Estate Development Analysis Powerpoint Slides Show
This is a real estate development analysis powerpoint slides show. This is a five stage process. The stages in this process are development analysis, financial and economic analysis, environmental data impact analysis, customer base management analysis, real estate development analysis.

3d Happy Person With Dollars PowerPoint Templates
Concept of financial growth analysis with happiness has been defined in this PowerPoint template. This diagram slide contains the graphic of 3d man standing over the currency. Use this image for business and finance related topics in any presentation.

Business Person With Big Dollar Sign Powerpoint Templates
Adjust the above diagram into your presentations to visually support your content. This slide has been professionally designed with graphics of business man with big dollar sign. This template offers an excellent background to display corporate financial management.
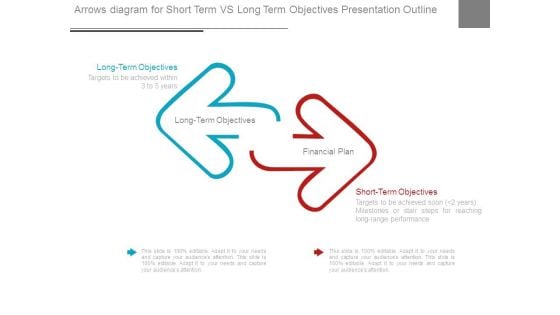
Arrows Diagram For Short Term Vs Long Term Objectives Presentation Outline
This is a arrows diagram for short term vs long term objectives presentation outline. This is a two stage process. The stages in this process are long term objectives, financial plan, short term objectives.
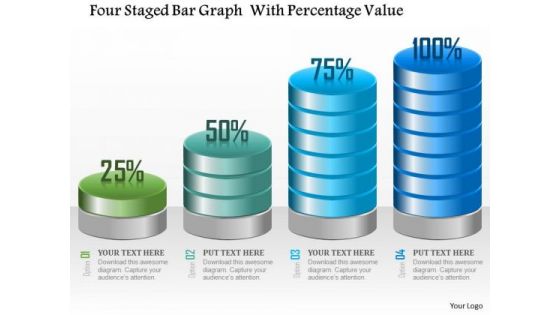
Business Diagram Four Staged Bar Graph With Percentage Value Presentation Template
Four staged bar graph with percentage value has been used to craft this power point template. This PPT contains the concept of making financial timeline and result analysis. This PPT can be used for business and finance related presentations.
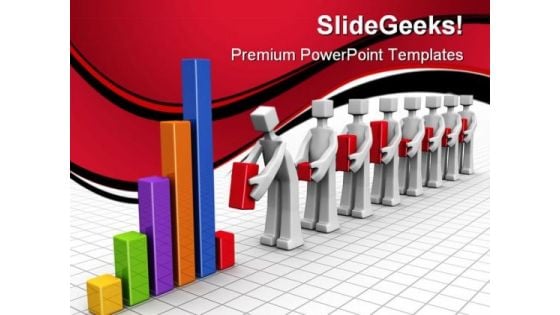
Teamwork Concept Business PowerPoint Templates And PowerPoint Backgrounds 0511
Microsoft PowerPoint Template and Background with business team adding individual performance bar chart to annual financial chart Get the right fabric for your thoughts. Our Teamwork Concept Business PowerPoint Templates And PowerPoint Backgrounds 0511 will provide a fitting color.
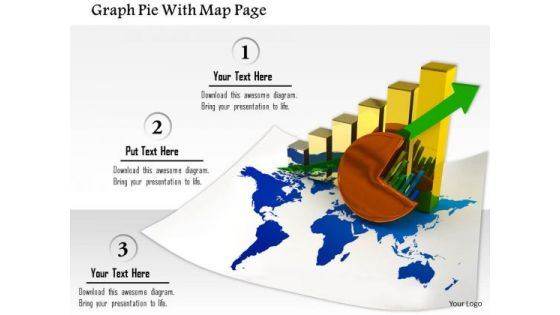
Stock Photo Graph Pie With Map Page PowerPoint Slide
This image slide contains business charts on world map. This image is designed with bar graph and pie chart on world map depicting global economy. Use this image slide to represent financial growth in any business presentation.
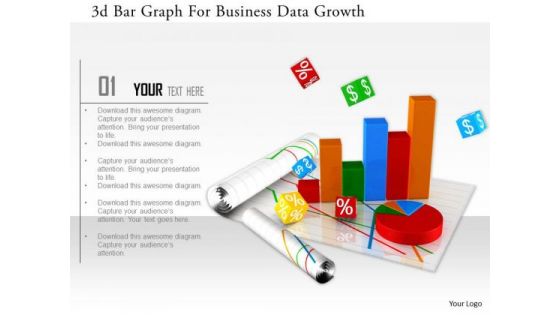
Stock Photo 3d Bar Graph For Business Data Growth Image Graphics For PowerPoint Slide
This image slide has graphics of financial charts and reports. This contains bar graph and pie chart to present business reports. Build an innovative presentations using this professional image slide.
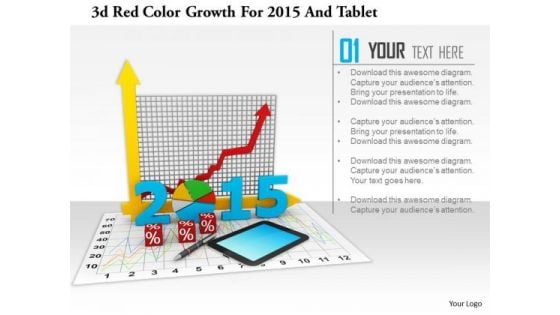
Stock Photo 3d Red Color Growth For 2015 And Tablet PowerPoint Slide
This image slide has graphics of financial charts and reports. This contains bar graph and pie chart to present business reports. Build an innovative presentation using this professional image slide.
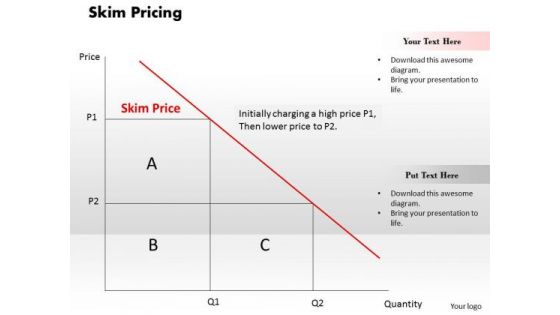
Business Framework Skim Pricing PowerPoint Presentation
This business framework power point template contains the graphic of graph. This PPT has been created with concept of skim pricing. Explain the skim pricing in your business and financial presentations by using this unique PPT.
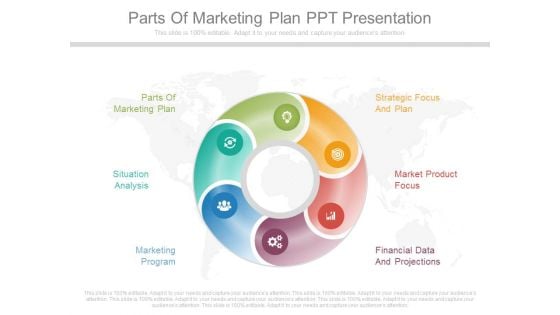
Parts Of Marketing Plan Ppt Presentation
This is a parts of marketing plan ppt presentation. This is a six stage process. The stages in this process are parts of marketing plan, strategic focus and plan, situation analysis, market product focus, marketing program, financial data and projections.
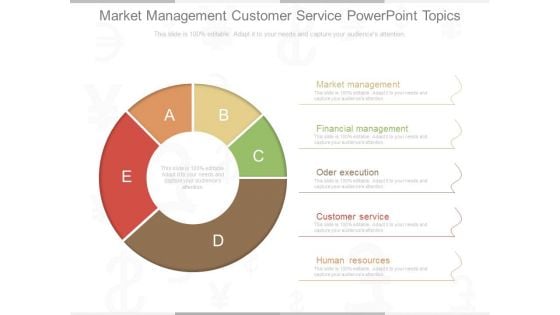
Market Management Customer Service Powerpoint Topics
This is a market management customer service powerpoint topics. This is a five stage process. The stages in this process are market management, financial management, oder execution, customer service, human resources.
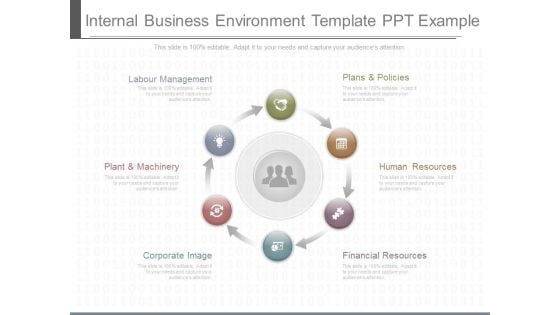
Internal Business Environment Template Ppt Example
This is an internal business environment template ppt example. This is a six stage process. The stages in this process are plans and policies, human resources, financial resources, corporate image, plant and machinery, lab our management.
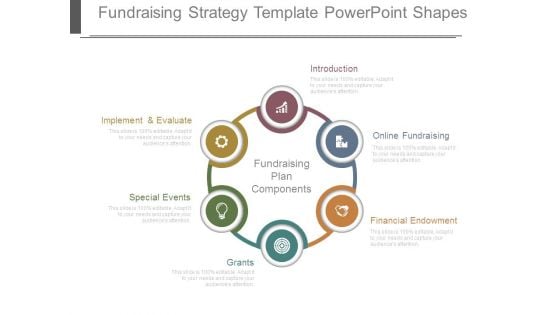
Fundraising Strategy Template Powerpoint Shapes
This is a fundraising strategy template powerpoint shapes. This is a six stage process. The stages in this process are implement and evaluate, special events, grants, introduction, online fundraising, financial endowment, fundraising plan components.
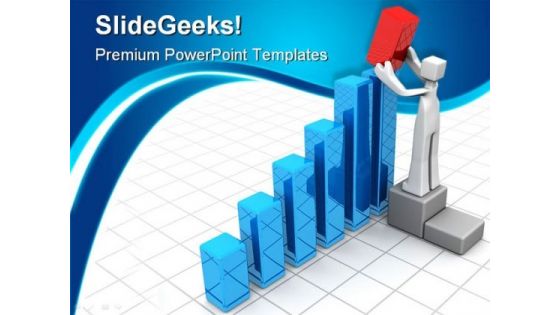
Growth Graph Finance PowerPoint Templates And PowerPoint Backgrounds 0511
Microsoft PowerPoint Template and Background with businessman adding a red bar chart to increase financial growth Transition to a better presentation with our Growth Graph Finance PowerPoint Templates And PowerPoint Backgrounds 0511. Download without worries with our money back guaranteee.

Business Bar Graph Arrow Success PowerPoint Templates And PowerPoint Backgrounds 0511
Microsoft PowerPoint Template and Background with a business chart/graph showing the decline of the financial money market Make the event with our Business Bar Graph Arrow Success PowerPoint Templates And PowerPoint Backgrounds 0511. Your thoughts will be really happening.
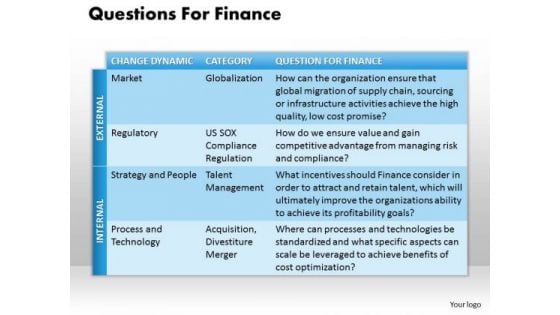
Business Framework Questions For Finance PowerPoint Presentation
This diagram depicts concepts of financial planning. Download this business diagram for your business and finance planning projects. This pre designed high quality business diagram will make your presentation simply the best.

 Home
Home