Financial Icons

Retailing Strategies Diagram Powerpoint Ideas
This is a retailing strategies diagram powerpoint ideas. This is a eight stage process. The stages in this process are retail market strategy, site location, pricing, store design and display, information system, financial strategy, communication mix, customer service.
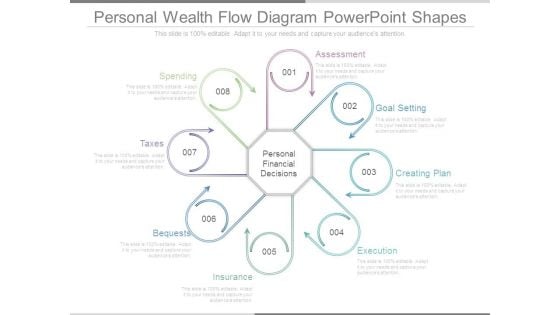
Personal Wealth Flow Diagram Powerpoint Shapes
This is a personal wealth flow diagram powerpoint shapes. This is a eight stage process. The stages in this process are assessment, goal setting, creating plan, execution, insurance, bequests, taxes, spending, personal financial decisions.
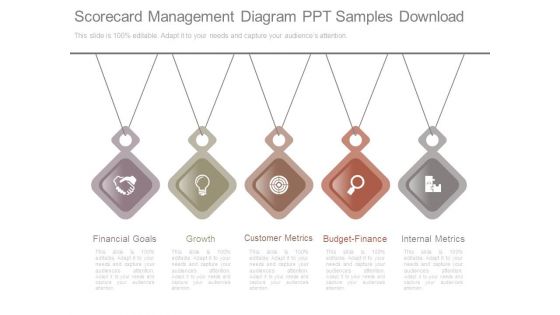
Scorecard Management Diagram Ppt Samples Download
This is a scorecard management diagram ppt samples download. This is a five stage process. The stages in this process are financial goals, growth, customer metrics, budget finance, internal metrics.

News Report Business PowerPoint Themes And PowerPoint Slides 0511
Microsoft PowerPoint Theme and Slide with financial news report Forge ahead with our News Report Business PowerPoint Themes And PowerPoint Slides 0511. Download without worries with our money back guaranteee.
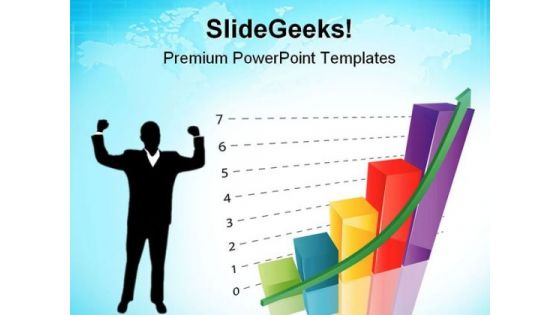
Growth Graph New Business PowerPoint Themes And PowerPoint Slides 0711
Microsoft PowerPoint Theme and Slide with graph of business and financial growth Train your team with our Growth Graph New Business PowerPoint Themes And PowerPoint Slides 0711. Download without worries with our money back guaranteee.
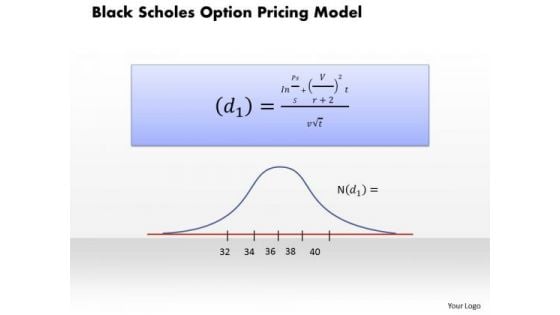
Business Framework Black Scholes Ption Pricing Model PowerPoint Presentation
This power point diagram has been crafted with graphic of black scholes ption pricing model. Use this model for various pricing valuation. Explain its graphical representation with our exclusive model. Use this diagram slide for financial presentation.
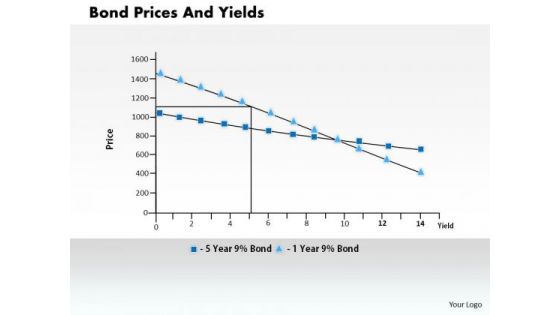
Business Framework Bond Prices And Yields PowerPoint Presentation
This power point diagram slide has been crafted with graphic of statistics of bond price and yields. Display the dependency in-between these two fields with this innovative diagram slide. This slide is very useful for financial presentations.
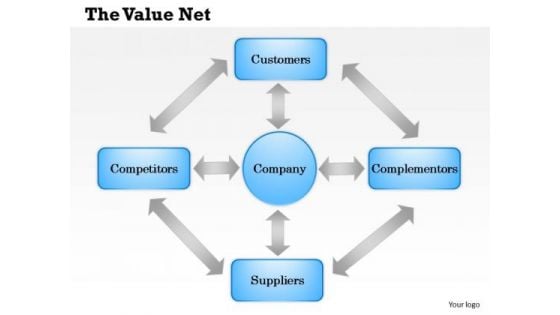
Business Framework The Value Net PowerPoint Presentation
This business power point diagram template has been designed with graphic of multiple staged. This diagram template can be used for value net calculation display in any financial and business presentations.
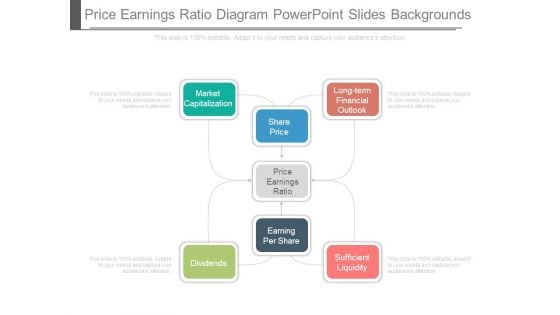
Price Earnings Ratio Diagram Powerpoint Slides Backgrounds
This is a price earnings ratio diagram powerpoint slides backgrounds. This is a four stage process. The stages in this process are market capitalization, long term financial outlook, share price, price earnings ratio, earning per share, dividends, sufficient liquidity.
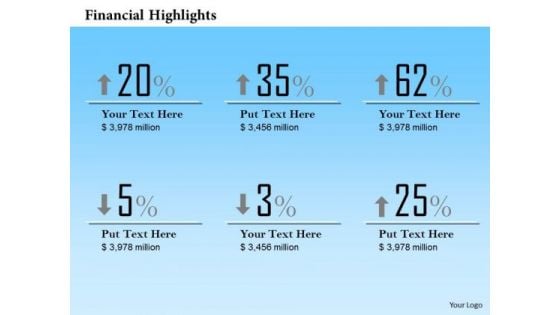
Mba Models And Frameworks Profit Percentage Analysis Diagram Strategic Management
Our MBA Models And Frameworks Profit Percentage Analysis Diagram Strategic Management Powerpoint Templates Abhor Doodling. They Never Let The Interest Flag. Our MBA Models And Frameworks Profit Percentage Analysis Diagram Strategic Management Powerpoint Templates Make Good Beasts Of Burden. Place All Your Demands On Them.
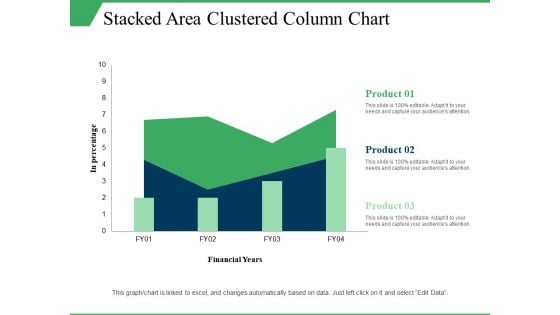
Stacked Area Clustered Column Chart Ppt PowerPoint Presentation Visual Aids Model
This is a stacked area clustered column chart ppt powerpoint presentation visual aids model. This is a three stage process. The stages in this process are in percentage, product, financial years, growth, column chart.
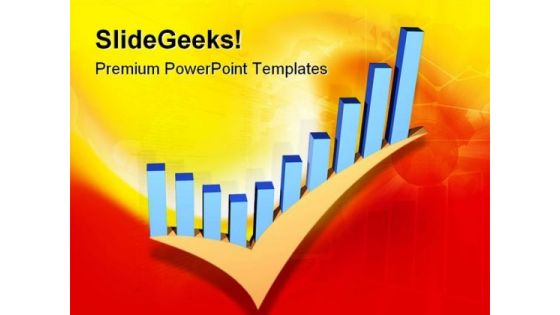
Business Graph With Check Metaphor PowerPoint Themes And PowerPoint Slides 0511
Microsoft PowerPoint Theme and Slide with a combination of a check mark and financial graph Bake the cake with our Business Graph With Check Metaphor PowerPoint Themes And PowerPoint Slides 0511. Give them all a big slab of it.

Gold Dollar Coin Key Finance PowerPoint Themes And PowerPoint Slides 0511
Microsoft PowerPoint Theme and Slide with financial gold dollar coin key Exclaim to the world with our Gold Dollar Coin Key Finance PowerPoint Themes And PowerPoint Slides 0511. Advertise your ability to everyone around.
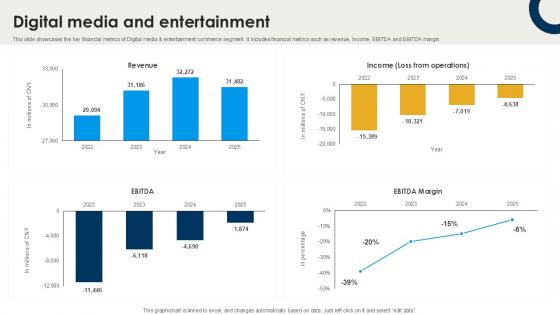
Digital Media And Entertainment International Trade Of Products And Services PPT Example CP SS V
This slide showcases the key financial metrics of Digital media and entertainment commerce segment. It includes financial metrics such as revenue, Income, EBITDA and EBITDA margin. Whether you have daily or monthly meetings, a brilliant presentation is necessary. Digital Media And Entertainment International Trade Of Products And Services PPT Example CP SS V can be your best option for delivering a presentation. Represent everything in detail using Digital Media And Entertainment International Trade Of Products And Services PPT Example CP SS V and make yourself stand out in meetings. The template is versatile and follows a structure that will cater to your requirements. All the templates prepared by Slidegeeks are easy to download and edit. Our research experts have taken care of the corporate themes as well. So, give it a try and see the results. This slide showcases the key financial metrics of Digital media and entertainment commerce segment. It includes financial metrics such as revenue, Income, EBITDA and EBITDA margin.

Business Network Growth Finance PowerPoint Themes And PowerPoint Slides 0411
Microsoft PowerPoint Theme and Slide with business financial growth and network concept Develop a winning strategy with our Business Network Growth Finance PowerPoint Themes And PowerPoint Slides 0411. You will come out on top.

Stock Market Crash Business PowerPoint Themes And PowerPoint Slides 0511
Microsoft PowerPoint Theme and Slide with financial concept of the stock market on fire Dream big wins with our Stock Market Crash Business PowerPoint Themes And PowerPoint Slides 0511. You will come out on top.

Business Growth People PowerPoint Themes And PowerPoint Slides 0511
Microsoft PowerPoint Slide and Theme with business concept financial conference Take control of your fate. Determine your destiny with our Business Growth People PowerPoint Themes And PowerPoint Slides 0511.

Business Results Abstract PowerPoint Themes And PowerPoint Slides 0511
Microsoft PowerPoint Theme and Slide with business abstract design showing market figures and financial results With our Business Results Abstract PowerPoint Themes And PowerPoint Slides 0511 you won't play second fiddle. They help you dominate the action.
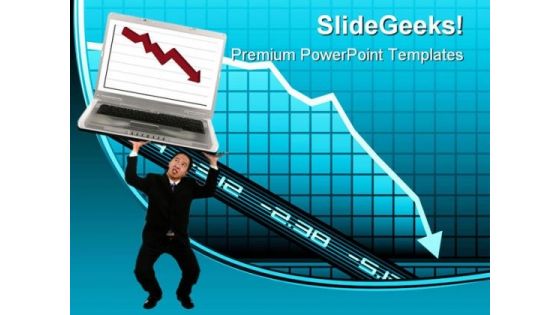
Crisis Business PowerPoint Themes And PowerPoint Slides 0911
Microsoft PowerPoint Theme and Slide with of business man stopping the financial crisis Our Crisis Business PowerPoint Themes And PowerPoint Slides 0911 are able catalysts. They will churn your thoughts and extract good plans.

Crisis Finance PowerPoint Themes And PowerPoint Slides 0711
Microsoft PowerPoint Theme and Slide with head in the sand financial crisis Our Crisis Finance PowerPoint Themes And PowerPoint Slides 0711 do not compromise. Excellence is always the aim.
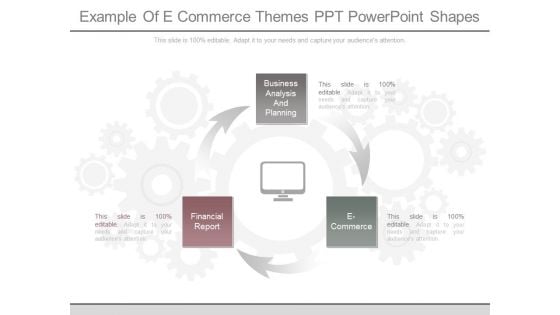
Example Of E Commerce Themes Ppt Powerpoint Shapes
This is a example of e commerce themes ppt powerpoint shapes. This is a three stage process. The stages in this process are business analysis and planning, financial report, e commerce.

3d Happy Man With Money PowerPoint Templates
Explain the concept of financial growth strategy and its requirement for success with this unique image. This contains the graphic of 3d man with money. This diagram slide is well designed for finance presentations to give better explanation of growth.
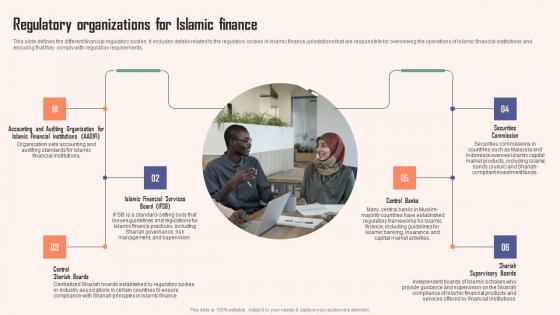
Regulatory Organizations For Islamic Finance Comprehensive Guide Islamic Themes PDF
This slide defines the different financial regulatory bodies. It includes details related to the regulatory bodies in Islamic finance jurisdictions that are responsible for overseeing the operations of Islamic financial institutions and ensuring that they comply with regulatory requirements. Boost your pitch with our creative Regulatory Organizations For Islamic Finance Comprehensive Guide Islamic Themes PDF. Deliver an awe-inspiring pitch that will mesmerize everyone. Using these presentation templates you will surely catch everyones attention. You can browse the ppts collection on our website. We have researchers who are experts at creating the right content for the templates. So you do not have to invest time in any additional work. Just grab the template now and use them. This slide defines the different financial regulatory bodies. It includes details related to the regulatory bodies in Islamic finance jurisdictions that are responsible for overseeing the operations of Islamic financial institutions and ensuring that they comply with regulatory requirements.
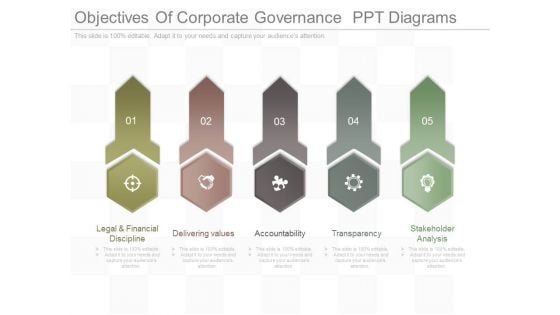
Objectives Of Corporate Governance Ppt Diagrams
This is a objectives of corporate governance ppt diagrams. This is a five stage process. The stages in this process are legal and financial discipline, delivering values, accountability, transparency, stakeholder analysis.
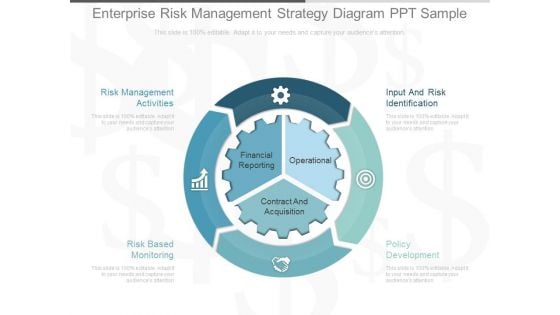
Enterprise Risk Management Strategy Diagram Ppt Sample
This is a enterprise risk management strategy diagram ppt sample. This is a three stage process. The stages in this process are risk management activities, input and risk identification, risk based monitoring, policy development, financial reporting, operational, contract and acquisition.\n\n\n\n\n\n\n\n
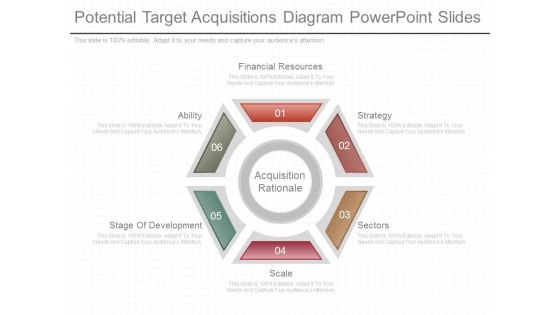
Potential Target Acquisitions Diagram Powerpoint Slides
This is a potential target acquisitions diagram powerpoint slides. This is a six stage process. The stages in this process are acquisition rationale, financial resources, strategy, sectors, scale, stage of development, ability.
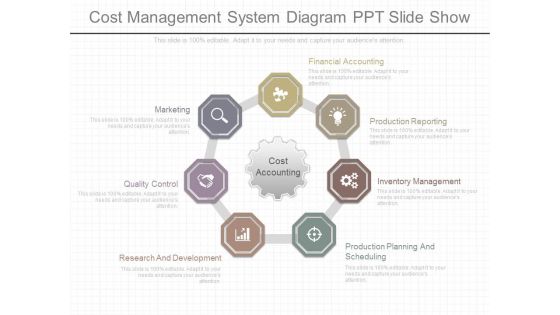
Cost Management System Diagram Ppt Slide Show
This is a cost management system diagram ppt slide show. This is a seven stage process. The stages in this process are research and development, quality control, marketing, financial accounting, production reporting, inventory management, production planning and scheduling, cost accounting.
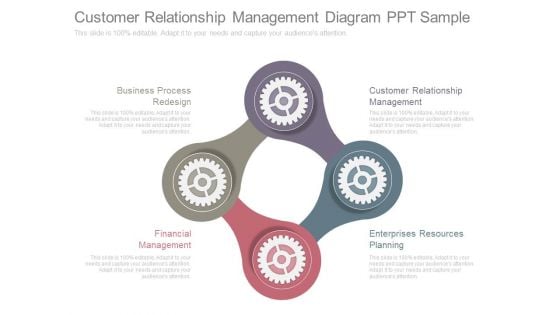
Customer Relationship Management Diagram Ppt Sample
This is a customer relationship management diagram ppt sample. This is a four stage process. The stages in this process are business process redesign, customer relationship management, financial management, enterprises resources planning.
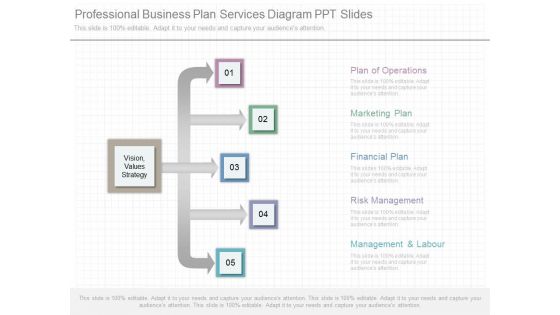
Professional Business Plan Services Diagram Ppt Slides
This is a professional business plan services diagram ppt slides. This is a five stage process. The stages in this process are plan of operations, marketing plan, financial plan, risk management, management and labour, vision values strategy.
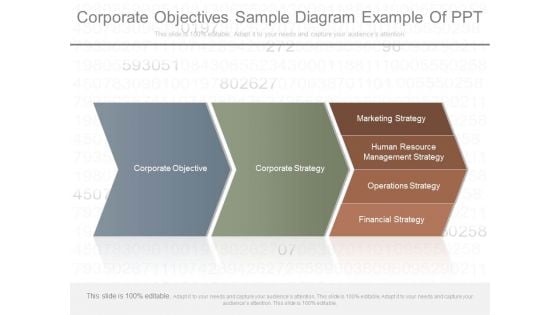
Corporate Objectives Sample Diagram Example Of Ppt
This is a corporate objectives sample diagram example of ppt. This is a three stage process. The stages in this process are corporate objective, corporate strategy, marketing strategy, human resource, management strategy, operations strategy, financial strategy.
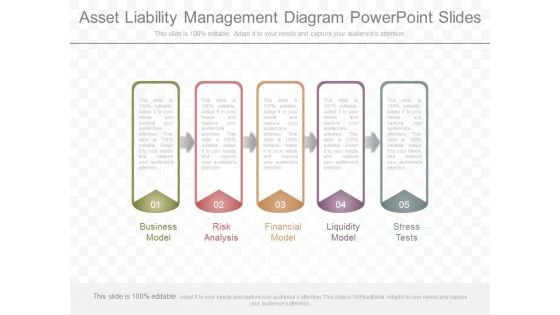
Asset Liability Management Diagram Powerpoint Slides
This is a asset liability management diagram powerpoint slides. This is a five stage process. The stages in this process are business model, risk analysis, financial model, liquidity model, stress tests.
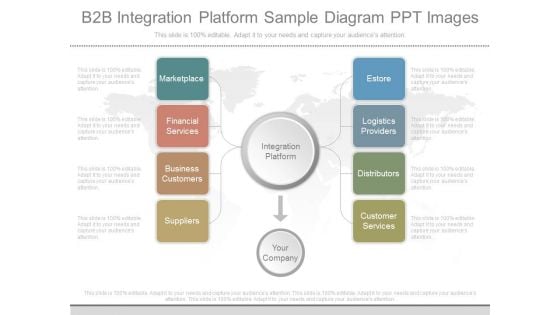
B2b Integration Platform Sample Diagram Ppt Images
This is a b2b integration platform sample diagram ppt images. This is a eight stage process. The stages in this process are integration platform, your company, marketplace, financial services, business customers, suppliers, customer services, distributors, logistics providers, estore.
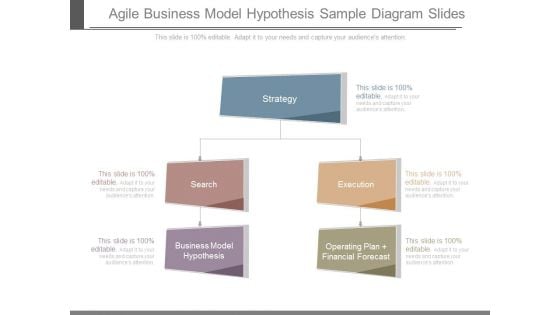
Agile Business Model Hypothesis Sample Diagram Slides
This is a agile business model hypothesis sample diagram slides. This is a three stage process. The stages in this process are strategy, search, business model hypothesis, execution, operating plan financial forecast.
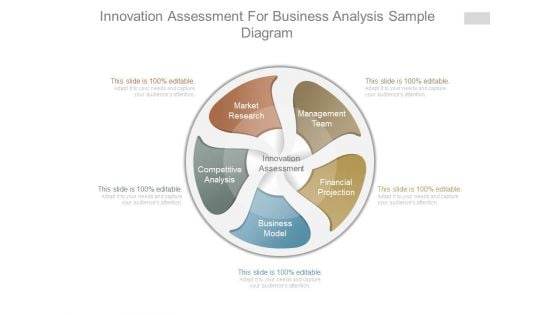
Innovation Assessment For Business Analysis Sample Diagram
This is a innovation assessment for business analysis sample diagram. This is a five stage process. The stages in this process are innovation assessment, market research, management team, competitive analysis, business model, financial projection.
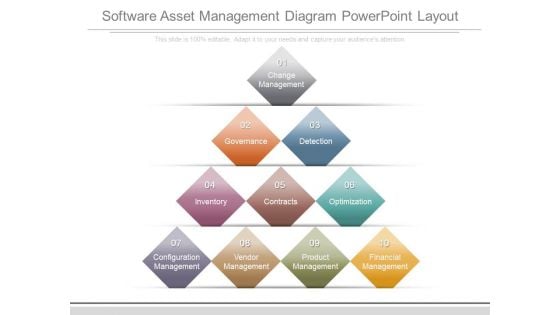
Software Asset Management Diagram Powerpoint Layout
This is a software asset management diagram powerpoint layout. This is a ten stage process. The stages in this process are change management, governance, detection, inventory, contracts, optimization, configuration management, vendor management, product management, financial management.
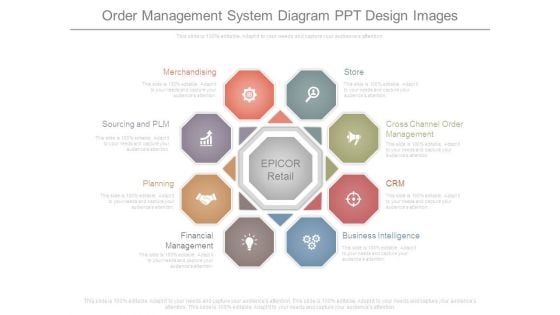
Order Management System Diagram Ppt Design Images
This is a order management system diagram ppt design images. This is a eight stage process. The stages in this process are store, cross channel order management, crm, business intelligence, financial management, planning, sourcing and plm, merchandising, epicor retail.
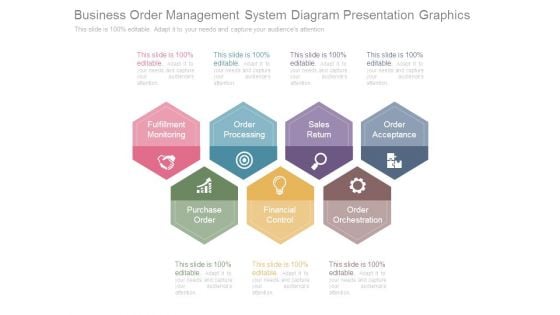
Business Order Management System Diagram Presentation Graphics
This is a business order management system diagram presentation graphics. This is a seven stage process. The stages in this process are fulfillment monitoring, order processing, sales return, order acceptance, purchase order, financial control, order orchestration.
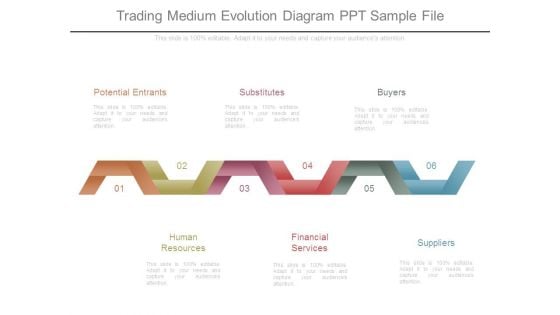
Trading Medium Evolution Diagram Ppt Sample File
This is a trading medium evolution diagram ppt sample file. This is a six stage process. The stages in this process are potential entrants, human resources, substitutes, financial services, buyers, suppliers.
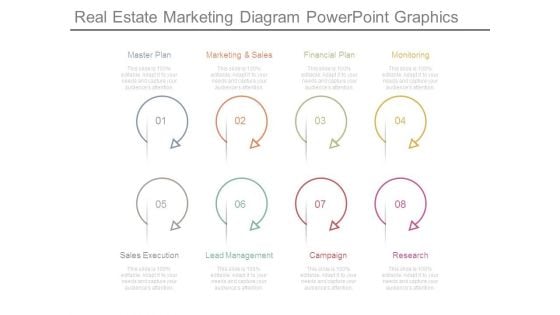
Real Estate Marketing Diagram Powerpoint Graphics
This is a real estate marketing diagram powerpoint graphics. This is a eight stage process. The stages in this process are master plan, marketing and sales, financial plan, monitoring, sales execution, lead management, campaign, research.
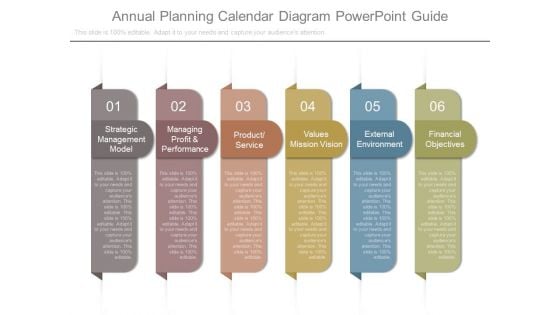
Annual Planning Calendar Diagram Powerpoint Guide
This is a annual planning calendar diagram powerpoint guide. This is a six stage process. The stages in this process are strategic management model, managing profit and performance, product service, values mission vision, external environment, financial objectives.
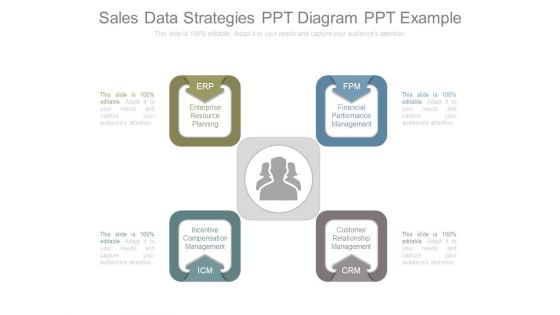
Sales Data Strategies Ppt Diagram Ppt Example
This is a sales data strategies ppt diagram ppt example. This is a four stage process. The stages in this process are enterprise resource planning, financial performance management, incentive compensation management, customer relationship management.
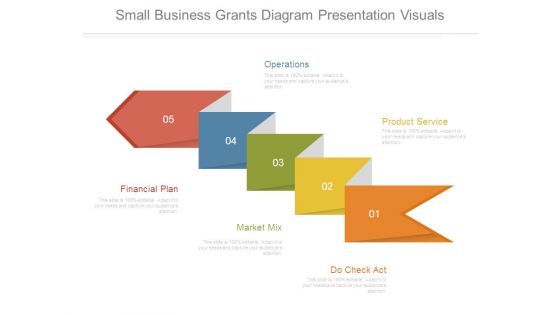
Small Business Grants Diagram Presentation Visuals
This is a small business grants diagram presentation visuals. This is a five stage process. The stages in this process are operations, product service, financial plan, market mix, do check act.
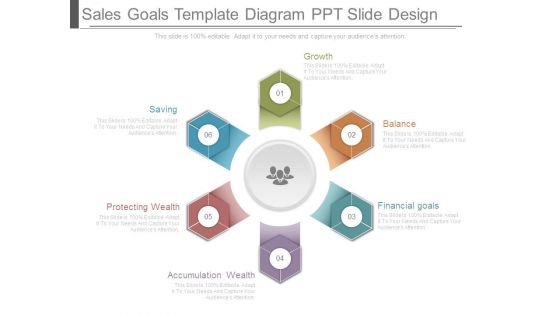
Sales Goals Template Diagram Ppt Slide Design
This is a sales goals template diagram ppt slide design. This is a six stage process. The stages in this process are saving, protecting wealth, accumulation wealth, financial goals, balance, growth.
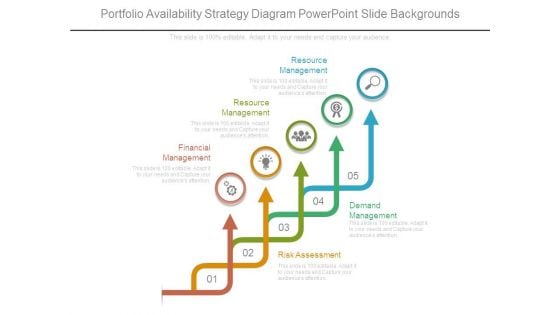
Portfolio Availability Strategy Diagram Powerpoint Slide Backgrounds
This is a portfolio availability strategy diagram powerpoint slide backgrounds. This is a five stage process. The stages in this process are resource management, financial management, risk assessment, demand management.
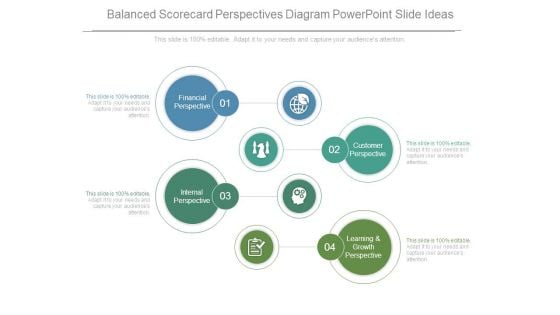
Balanced Scorecard Perspectives Diagram Powerpoint Slide Ideas
This is a balanced scorecard perspectives diagram powerpoint slide ideas. This is a four stage process. The stages in this process are financial perspective, customer perspective, internal perspective, learning and growth perspective.
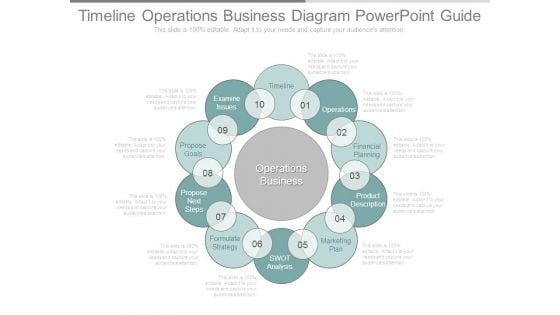
Timeline Operations Business Diagram Powerpoint Guide
This is a timeline operations business diagram powerpoint guide. This is a ten stage process. The stages in this process are examine issues, propose goals, propose next steps, formulate strategy, swot analysis, timeline, operations, financial planning, product description, marketing plan.

Fundraising For Businesses Diagram Ppt Design
This is a fundraising for businesses diagram ppt design. This is a five stage process. The stages in this process are financial endowment, special events, product fundraising, donation, subsidies.

Land Development Process Diagram Powerpoint Presentation Templates
This is a land development process diagram powerpoint presentation templates. This is a five stage process. The stages in this process are design and entitlements, construction management, financial management, marketing, lot sales.
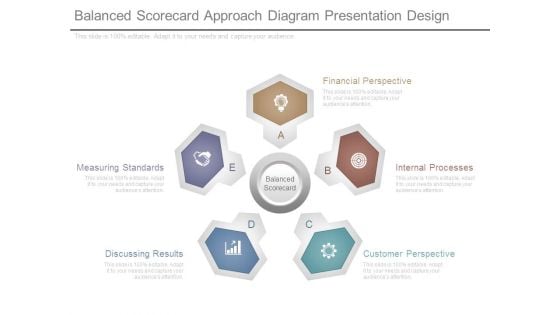
Balanced Scorecard Approach Diagram Presentation Design
This is a balanced scorecard approach diagram presentation design. This is a five stage process. The stages in this process are measuring standards, discussing results, customer perspective, internal processes, financial perspective, balanced scorecard.
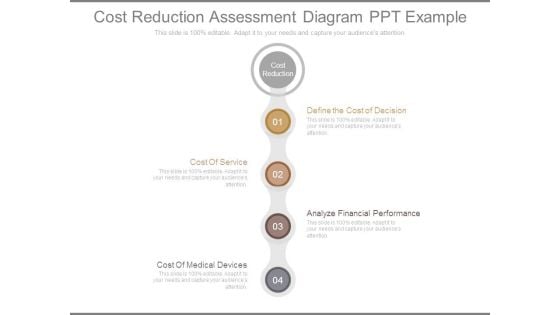
Cost Reduction Assessment Diagram Ppt Example
This is a cost reduction assessment diagram ppt example. This is a four stage process. The stages in this process are define the cost of decision, cost of service, analyze financial performance, cost of medical devices.

Market Attractiveness Diagram Powerpoint Slides Designs
This is a market attractiveness diagram powerpoint slides designs. This is a four stage process. The stages in this process are market attractiveness, attractiveness other considerations, internal attractiveness, financial and market attractiveness.
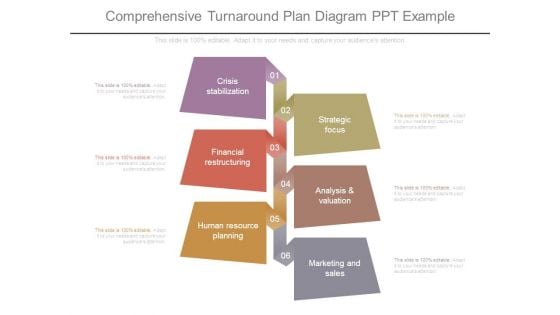
Comprehensive Turnaround Plan Diagram Ppt Example
This is a comprehensive turnaround plan diagram ppt example. This is a six stage process. The stages in this process are crisis stabilization, financial restructuring, human resource planning, strategic focus, analysis and valuation, marketing and sales.
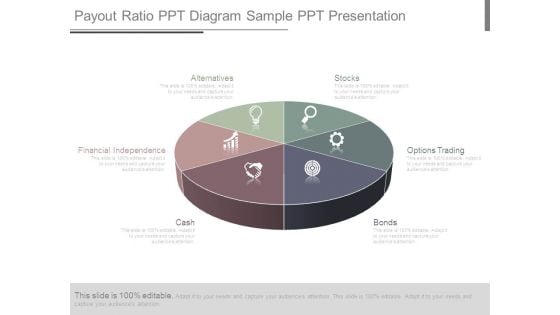
Payout Ratio Ppt Diagram Sample Ppt Presentation
This is a payout ratio ppt diagram sample ppt presentation. This is a six stage process. The stages in this process are stocks, options trading, bonds, cash, financial independence, alternatives.
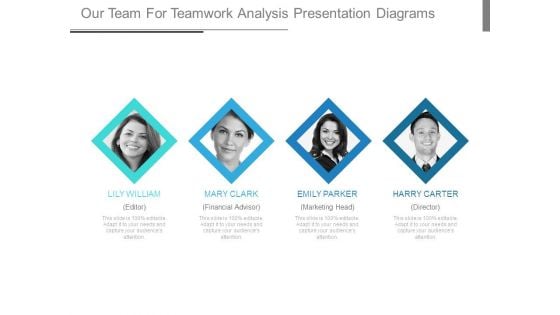
Our Team For Teamwork Analysis Presentation Diagrams
This is a our team for teamwork analysis presentation diagrams. This is a four stage process. The stages in this process are lily william editor, mary clark financial advisor, emily parker marketing head, harry carter director.
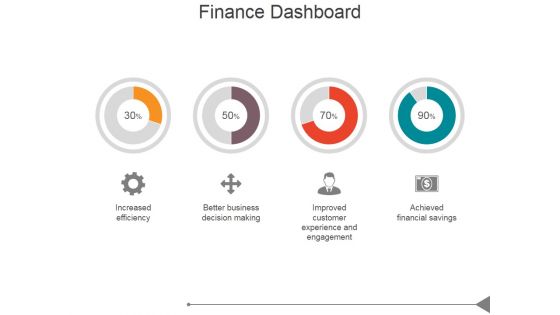
Finance Dashboard Ppt PowerPoint Presentation Diagrams
This is a finance dashboard ppt powerpoint presentation diagrams. This is a four stage process. The stages in this process are increased efficiency, better business decision making, improved customer experience and engagement, achieved financial savings.
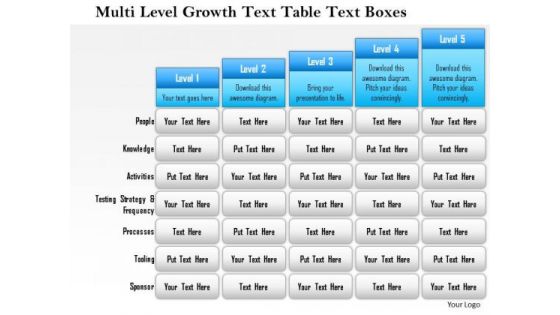
Business Framework Multi Level Growth Text Table Text Boxes 2 PowerPoint Presentation
Five staged text box style chart in bar graph design has been used to decorate this power point template slide. This diagram slide contains the multilevel growth concept. Use this PPT slide for financial growth and result analysis related topics.
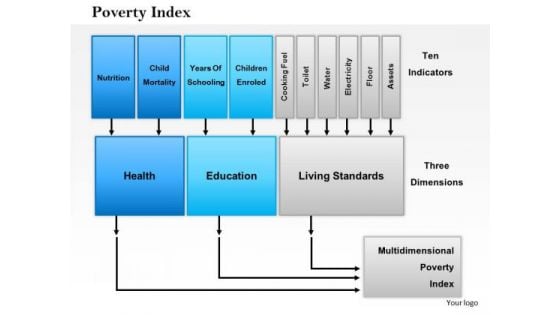
Business Framework Poverty Index PowerPoint Presentation
A linear growth chart with text boxes has been used to decorate this Power Point template slide. This diagram slide contains the concept of poverty index. Use this index in your financial presentations to show poverty based calculation.
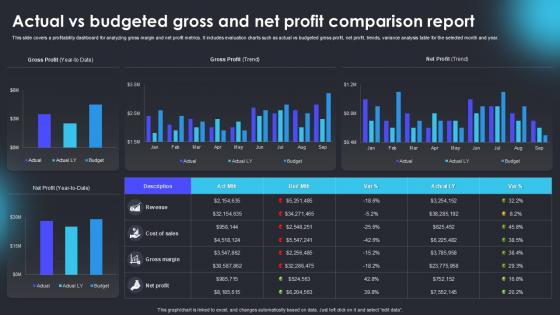
Actual Vs Budgeted Gross And Net Profit Comparison Report
Boost your pitch with our creative Actual Vs Budgeted Gross And Net Profit Comparison Report. Deliver an awe-inspiring pitch that will mesmerize everyone. Using these presentation templates you will surely catch everyones attention. You can browse the ppts collection on our website. We have researchers who are experts at creating the right content for the templates. So you do not have to invest time in any additional work. Just grab the template now and use them. This PowerPoint template is designed to present a detailed comparison between actual financial performance and budgeted projections for gross and net profit. It includes charts, graphs, and tables to effectively illustrate variances, percentage differences, and key financial insights. The template helps in identifying discrepancies, evaluating financial strategies, and guiding corrective measures. Ideal for finance professionals, analysts, and business executives for quarterly, annual, or project-based financial reviews.
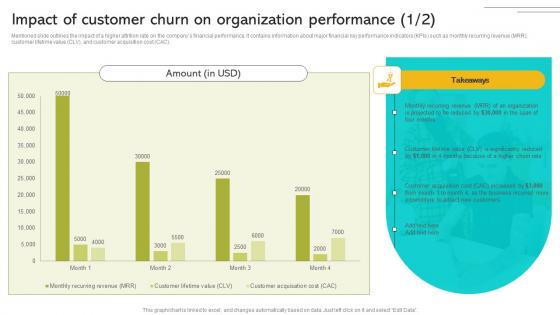
Implementing Strategies To Enhance Impact Of Customer Churn On Organization Performance Infographics PDF
Mentioned slide outlines the impact of a higher attrition rate on the companys financial performance. It contains information about major financial key performance indicators KPIs such as monthly recurring revenue MRR, customer lifetime value CLV, and customer acquisition cost CAC. Make sure to capture your audiences attention in your business displays with our gratis customizable Implementing Strategies To Enhance Impact Of Customer Churn On Organization Performance Infographics PDF These are great for business strategies, office conferences, capital raising or task suggestions. If you desire to acquire more customers for your tech business and ensure they stay satisfied, create your own sales presentation with these plain slides. Mentioned slide outlines the impact of a higher attrition rate on the companys financial performance. It contains information about major financial key performance indicators KPIs such as monthly recurring revenue MRR, customer lifetime value CLV, and customer acquisition cost CAC.
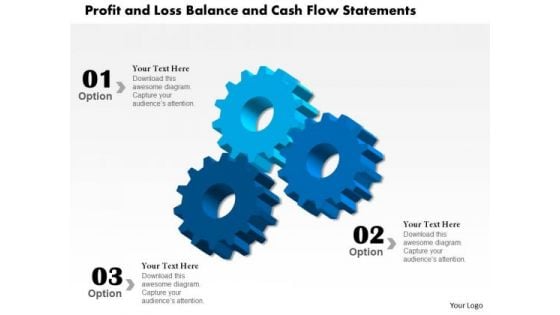
Strategy Diagram Profit And Loss Balance And Cash Flow Statements Mba Models And Frameworks
Be The Doer With Our Strategy Diagram Profit And Loss Balance And Cash Flow Statements MBA Models And Frameworks Powerpoint Templates. Put Your Thoughts Into Practice.

 Home
Home