Financial Kpi
Loyalty Program Performance Tracking Dashboard Consumer Contact Point Guide Demonstration PDF
This slide covers the KPI dashboard for analyzing customer loyalty campaign results. It includes metrics such as revenue, liability, NQP accrued, transaction count, members, redemption ratio, etc. Find a pre-designed and impeccable Loyalty Program Performance Tracking Dashboard Consumer Contact Point Guide Demonstration PDF. The templates can ace your presentation without additional effort. You can download these easy-to-edit presentation templates to make your presentation stand out from others. So, what are you waiting for Download the template from Slidegeeks today and give a unique touch to your presentation.
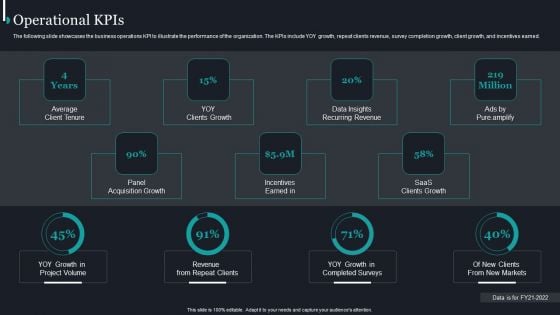
Pureprofile Business Overview Operational Kpis Ppt Summary Introduction PDF
The following slide showcases the business operations KPI to illustrate the performance of the organization. The KPIs include YOY growth, repeat clients revenue, survey completion growth, client growth, and incentives earned. Deliver and pitch your topic in the best possible manner with this Pureprofile Business Overview Operational Kpis Ppt Summary Introduction PDF. Use them to share invaluable insights on Average Client Tenure, Panel Acquisition Growth, SaaS Clients Growth and impress your audience. This template can be altered and modified as per your expectations. So, grab it now.

SEO Marketing Dashboard Key Tactics To Drive Better Sales High Performance Themes PDF
This slide covers SEO marketing KPI dashboard to drive better sales performance. It involves data such as sessions from organic, organic sessions by source, organic conversion, pages per sessions from organic. Showcasing this set of slides titled SEO Marketing Dashboard Key Tactics To Drive Better Sales High Performance Themes PDF. The topics addressed in these templates are Sessions From Organic, Organic Revenue, Organic Conversion Rate. All the content presented in this PPT design is completely editable. Download it and make adjustments in color, background, font etc. as per your unique business setting.
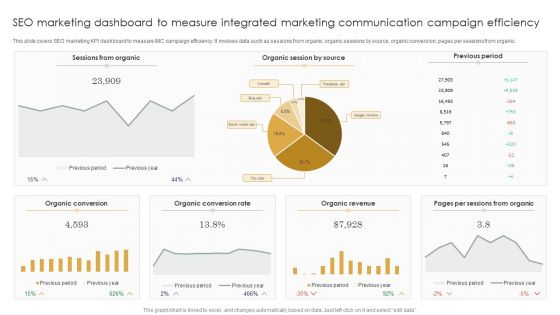
SEO Marketing Dashboard To Measure Integrated Marketing Communication Campaign Efficiency Brochure PDF
This slide covers SEO marketing KPI dashboard to measure IMC campaign efficiency. It involves data such as sessions from organic, organic sessions by source, organic conversion, pages per sessions from organic. Showcasing this set of slides titled SEO Marketing Dashboard To Measure Integrated Marketing Communication Campaign Efficiency Brochure PDF. The topics addressed in these templates are Sessions Organic, Organic Session Source, Previous Period, Organic Revenue. All the content presented in this PPT design is completely editable. Download it and make adjustments in color, background, font etc. as per your unique business setting.
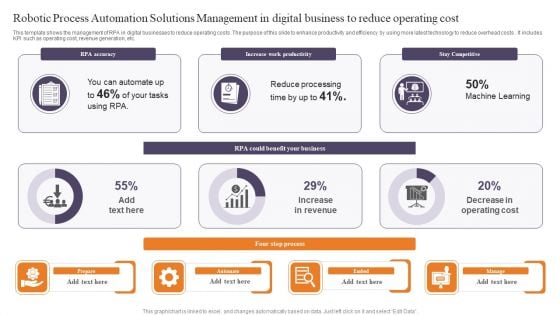
Robotic Process Automation Solutions Management In Digital Business To Reduce Operating Cost Formats PDF
This template shows the management of RPA in digital businesses to reduce operating costs .The purpose of this slide to enhance productivity and efficiency by using more latest technology to reduce overhead costs . It includes KPI such as operating cost, revenue generation, etc. Showcasing this set of slides titled Robotic Process Automation Solutions Management In Digital Business To Reduce Operating Cost Formats PDF. The topics addressed in these templates are Accuracy, Work Productivity, Stay Competitive. All the content presented in this PPT design is completely editable. Download it and make adjustments in color, background, font etc. as per your unique business setting.
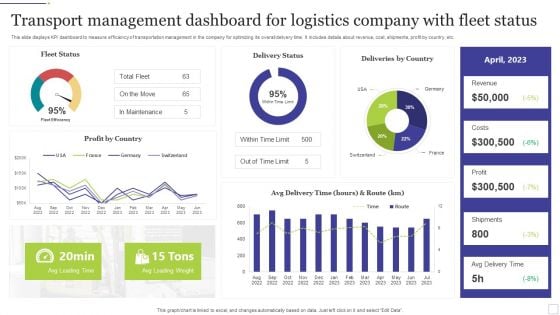
Transport Management Dashboard For Logistics Company With Fleet Status Ideas PDF
This slide displays KPI dashboard to measure efficiency of transportation management in the company for optimizing its overall delivery time. It includes details about revenue, cost, shipments, profit by country, etc. Showcasing this set of slides titled Transport Management Dashboard For Logistics Company With Fleet Status Ideas PDF. The topics addressed in these templates are Logistics Company, Fleet Status. All the content presented in this PPT design is completely editable. Download it and make adjustments in color, background, font etc. as per your unique business setting.
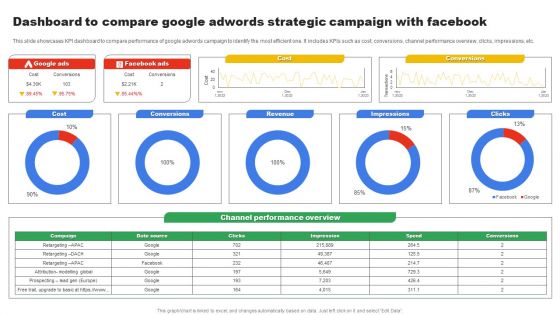
Dashboard To Compare Google Adwords Strategic Campaign With Facebook Microsoft PDF
This slide showcases KPI dashboard to compare performance of google adwords campaign to identify the most efficient one. It includes KPIs such as cost, conversions, channel performance overview, clicks, impressions, etc. Showcasing this set of slides titled Dashboard To Compare Google Adwords Strategic Campaign With Facebook Microsoft PDF. The topics addressed in these templates are Cost, Conversions, Revenue. All the content presented in this PPT design is completely editable. Download it and make adjustments in color, background, font etc. as per your unique business setting.
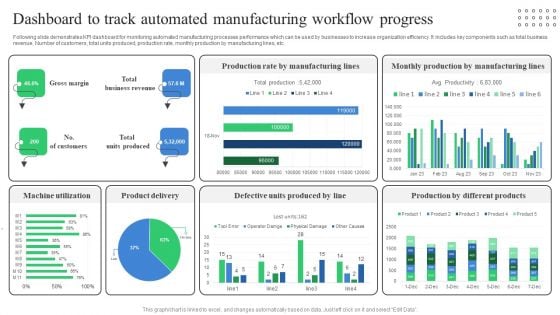
Dashboard To Track Automated Manufacturing Workflow Progress Professional PDF
Following slide demonstrates KPI dashboard for monitoring automated manufacturing processes performance which can be used by businesses to increase organization efficiency. It includes key components such as total business revenue, Number of customers, total units produced, production rate, monthly production by manufacturing lines, etc. Showcasing this set of slides titled Dashboard To Track Automated Manufacturing Workflow Progress Professional PDF. The topics addressed in these templates are Machine Utilization, Product Delivery, Defective Units Produced. All the content presented in this PPT design is completely editable. Download it and make adjustments in color, background, font etc. as per your unique business setting.

HRM System Integration Framework With Key Metrics Ppt PowerPoint Presentation File Model PDF
Showcasing this set of slides titled hrm system integration framework with key metrics ppt powerpoint presentation file model pdf. The topics addressed in these templates are financial kpis, strategic focus, process kpis. All the content presented in this PPT design is completely editable. Download it and make adjustments in color, background, font etc. as per your unique business setting.
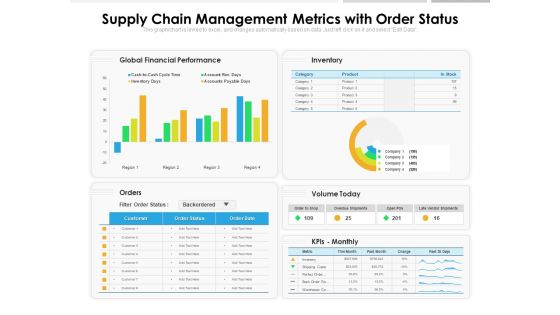
Supply Chain Management Metrics With Order Status Ppt PowerPoint Presentation Layouts Graphics Design PDF
Presenting this set of slides with name supply chain management metrics with order status ppt powerpoint presentation layouts graphics design pdf. The topics discussed in these slides are global financial performance, inventory, orders, volume today, kpis monthly. This is a completely editable PowerPoint presentation and is available for immediate download. Download now and impress your audience.
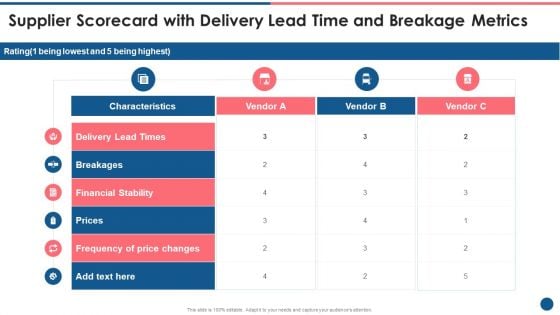
Supplier Scorecard Supplier Scorecard With Delivery Lead Time And Breakage Metrics Background PDF
Deliver an awe inspiring pitch with this creative supplier scorecard supplier scorecard with delivery lead time and breakage metrics background pdf bundle. Topics like delivery lead times, financial stability, prices, frequency price changes can be discussed with this completely editable template. It is available for immediate download depending on the needs and requirements of the user.
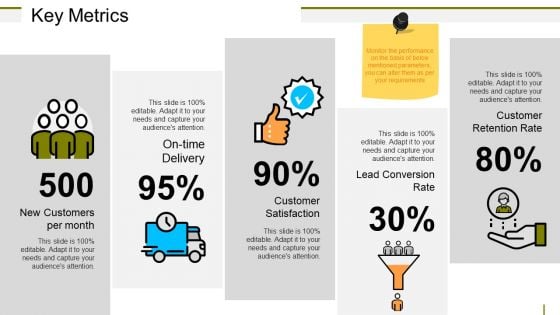
Key Metrics Ppt PowerPoint Presentation Model Portrait
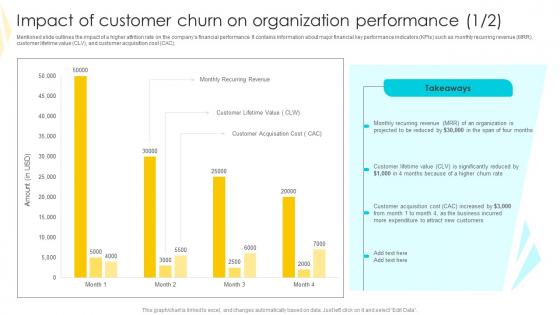
Impact Of Customer Churn On Strategies To Mitigate Customer Churn Template Pdf
Mentioned slide outlines the impact of a higher attrition rate on the companys financial performance. It contains information about major financial key performance indicators KPIs such as monthly recurring revenue MRR, customer lifetime value CLV, and customer acquisition cost CAC. If you are looking for a format to display your unique thoughts, then the professionally designed Impact Of Customer Churn On Strategies To Mitigate Customer Churn Template Pdf is the one for you. You can use it as a Google Slides template or a PowerPoint template. Incorporate impressive visuals, symbols, images, and other charts. Modify or reorganize the text boxes as you desire. Experiment with shade schemes and font pairings. Alter, share or cooperate with other people on your work. Download Impact Of Customer Churn On Strategies To Mitigate Customer Churn Template Pdf and find out how to give a successful presentation. Present a perfect display to your team and make your presentation unforgettable. Mentioned slide outlines the impact of a higher attrition rate on the companys financial performance. It contains information about major financial key performance indicators KPIs such as monthly recurring revenue MRR, customer lifetime value CLV, and customer acquisition cost CAC.
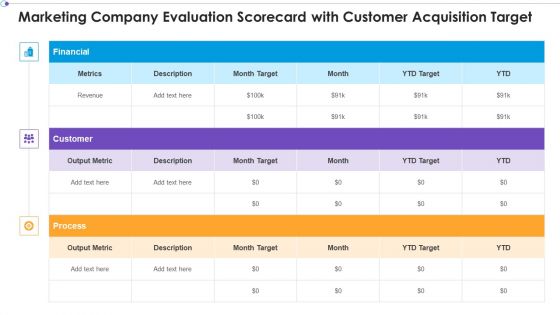
Marketing Business Assessment Scorecard Marketing Company Evaluation Scorecard With Customer Ideas PDF
Deliver an awe inspiring pitch with this creative Marketing Business Assessment Scorecard Marketing Company Evaluation Scorecard With Customer Ideas PDF bundle. Topics like Financial Customer, Output Metric, Month Target can be discussed with this completely editable template. It is available for immediate download depending on the needs and requirements of the user.
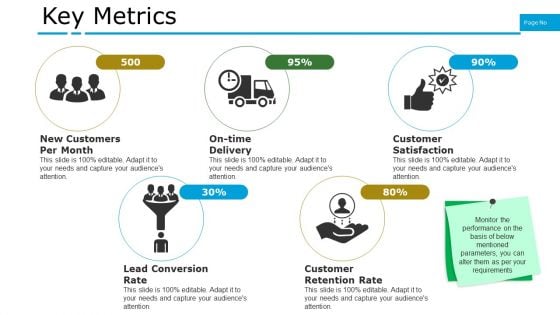
Key Metrics Ppt PowerPoint Presentation Infographics Example Topics
This is a key metrics ppt powerpoint presentation infographics example topics. This is a five stage process. The stages in this process are new customers per month, on time delivery, customer satisfaction, lead conversion rate, customer retention rate.

Current State Analysis Revenue Versus Target Ppt PowerPoint Presentation Summary Slides
This is a current state analysis revenue versus target ppt powerpoint presentation summary slides. This is a six stage process. The stages in this process are actual, target, kpi, finance, business.
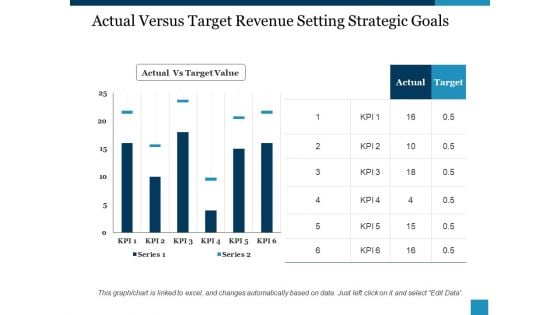
Actual Versus Target Revenue Setting Strategic Goals Ppt PowerPoint Presentation Visual Aids Diagrams
This is a actual versus target revenue setting strategic goals ppt powerpoint presentation visual aids diagrams. This is a six stage process. The stages in this process are actual vs target value, actual, target, kpi, series.
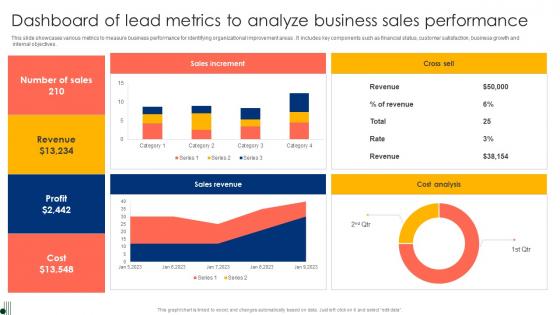
Dashboard Of Lead Metrics To Analyze Business Sales Performance Ppt Summary Graphics Pdf
This slide showcases various metrics to measure business performance for identifying organizational improvement areas. It includes key components such as financial status, customer satisfaction, business growth and internal objectives. Showcasing this set of slides titled Dashboard Of Lead Metrics To Analyze Business Sales Performance Ppt Summary Graphics Pdf. The topics addressed in these templates are Sales Increment, Cross Sell, Cost Analysis. All the content presented in this PPT design is completely editable. Download it and make adjustments in color, background, font etc. as per your unique business setting. This slide showcases various metrics to measure business performance for identifying organizational improvement areas. It includes key components such as financial status, customer satisfaction, business growth and internal objectives.
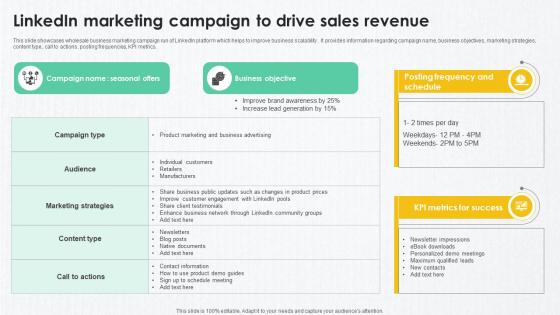
B2B Marketing Techniques Linkedin Marketing Campaign To Drive Sales Revenue
This slide showcases wholesale business marketing campaign run of LinkedIn platform which helps to improve business scalability . It provides information regarding campaign name, business objectives, marketing strategies, content type, call to actions, posting frequencies, KPI metrics. Whether you have daily or monthly meetings, a brilliant presentation is necessary. B2B Marketing Techniques Linkedin Marketing Campaign To Drive Sales Revenue can be your best option for delivering a presentation. Represent everything in detail using B2B Marketing Techniques Linkedin Marketing Campaign To Drive Sales Revenue and make yourself stand out in meetings. The template is versatile and follows a structure that will cater to your requirements. All the templates prepared by Slidegeeks are easy to download and edit. Our research experts have taken care of the corporate themes as well. So, give it a try and see the results. This slide showcases wholesale business marketing campaign run of LinkedIn platform which helps to improve business scalability . It provides information regarding campaign name, business objectives, marketing strategies, content type, call to actions, posting frequencies, KPI metrics.
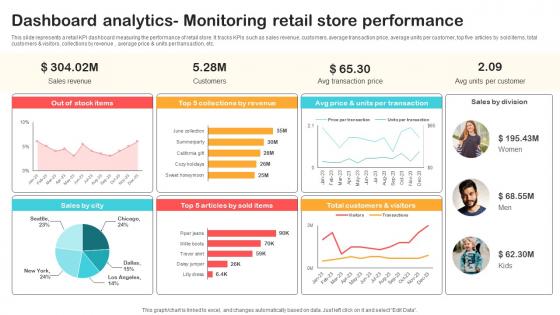
Dashboard Analytics Monitoring Retail Store Performance Optimizing Retail Operations With Digital DT SS V
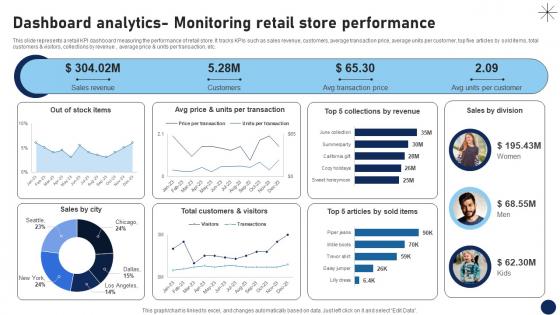
This slide represents a retail KPI dashboard measuring the performance of retail store. It tracks KPIs such as sales revenue, customers, average transaction price, average units per customer, top five articles by sold items, total customers and visitors, collections by revenue , average price and units per transaction, etc.Are you in need of a template that can accommodate all of your creative concepts This one is crafted professionally and can be altered to fit any style. Use it with Google Slides or PowerPoint. Include striking photographs, symbols, depictions, and other visuals. Fill, move around, or remove text boxes as desired. Test out color palettes and font mixtures. Edit and save your work, or work with colleagues. Download Dashboard Analytics Monitoring Retail Store Performance Optimizing Retail Operations With Digital DT SS V and observe how to make your presentation outstanding. Give an impeccable presentation to your group and make your presentation unforgettable. This slide represents a retail KPI dashboard measuring the performance of retail store. It tracks KPIs such as sales revenue, customers, average transaction price, average units per customer, top five articles by sold items, total customers and visitors, collections by revenue , average price and units per transaction, etc.
Dashboard Analytics Monitoring Retail Store Performance DT SS V
This slide represents a retail KPI dashboard measuring the performance of retail store. It tracks KPIs such as sales revenue, customers, average transaction price, average units per customer, top five articles by sold items, total customers and visitors, collections by revenue , average price and units per transaction, etc.Are you in need of a template that can accommodate all of your creative concepts This one is crafted professionally and can be altered to fit any style. Use it with Google Slides or PowerPoint. Include striking photographs, symbols, depictions, and other visuals. Fill, move around, or remove text boxes as desired. Test out color palettes and font mixtures. Edit and save your work, or work with colleagues. Download Dashboard Analytics Monitoring Retail Store Performance DT SS V and observe how to make your presentation outstanding. Give an impeccable presentation to your group and make your presentation unforgettable. This slide represents a retail KPI dashboard measuring the performance of retail store. It tracks KPIs such as sales revenue, customers, average transaction price, average units per customer, top five articles by sold items, total customers and visitors, collections by revenue , average price and units per transaction, etc.
Business Sustainability With Triple Bottom Line Approach Ppt Example SS
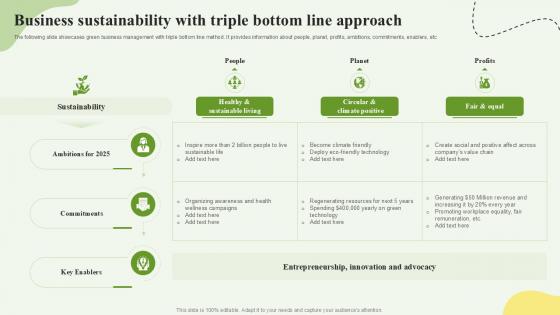
This slide mentions the KPI dashboard for pharmaceutical companies. The purpose of this slide is analysis the 6 months gross selling of the company that can be utilized by the managers to determine actual revenue and profits. It includes details regarding discounts, unit sold per segment, profit by product, monthly revenue, etc. Get a simple yet stunning designed Business Sustainability With Triple Bottom Line Approach Ppt Example SS It is the best one to establish the tone in your meetings. It is an excellent way to make your presentations highly effective. So, download this PPT today from Slidegeeks and see the positive impacts. Our easy-to-edit Business Sustainability With Triple Bottom Line Approach Ppt Example SS can be your go-to option for all upcoming conferences and meetings. So, what are you waiting for Grab this template today. This slide mentions the KPI dashboard for pharmaceutical companies. The purpose of this slide is analysis the 6 months gross selling of the company that can be utilized by the managers to determine actual revenue and profits. It includes details regarding discounts, unit sold per segment, profit by product, monthly revenue, etc.
Dashboard For Tracking Ambassador Techniques For Generating Brand Awareness Graphics Pdf
This slide covers the KPI dashboard for companies to evaluate the performance of ambassador marketing campaigns. It includes metrics such as the number of brand ambassadors, the total number of shares, clicks, CPS, revenue, commissions, etc. Do you have an important presentation coming up Are you looking for something that will make your presentation stand out from the rest Look no further than Dashboard For Tracking Ambassador Techniques For Generating Brand Awareness Graphics Pdf. With our professional designs, you can trust that your presentation will pop and make delivering it a smooth process. And with Slidegeeks, you can trust that your presentation will be unique and memorable. So why wait Grab Dashboard For Tracking Ambassador Techniques For Generating Brand Awareness Graphics Pdf today and make your presentation stand out from the rest This slide covers the KPI dashboard for companies to evaluate the performance of ambassador marketing campaigns. It includes metrics such as the number of brand ambassadors, the total number of shares, clicks, CPS, revenue, commissions, etc.
Dashboard For Tracking Referral Techniques For Generating Brand Awareness Sample Pdf
This slide covers the KPI dashboard for brands to evaluate the performance of referral marketing campaigns. It includes metrics such as referral participation rate, referred customers, referral conversion rate, total revenue generated, etc Whether you have daily or monthly meetings, a brilliant presentation is necessary. Dashboard For Tracking Referral Techniques For Generating Brand Awareness Sample Pdf can be your best option for delivering a presentation. Represent everything in detail using Dashboard For Tracking Referral Techniques For Generating Brand Awareness Sample Pdf and make yourself stand out in meetings. The template is versatile and follows a structure that will cater to your requirements. All the templates prepared by Slidegeeks are easy to download and edit. Our research experts have taken care of the corporate themes as well. So, give it a try and see the results. This slide covers the KPI dashboard for brands to evaluate the performance of referral marketing campaigns. It includes metrics such as referral participation rate, referred customers, referral conversion rate, total revenue generated, etc.
Dashboard For Tracking Ambassador Marketing Tracking Word Mouth Marketing Summary PDF
This slide covers the KPI dashboard for companies to evaluate the performance of ambassador marketing campaigns. It includes metrics such as the number of brand ambassadors, the total number of shares, clicks, CPS, revenue, commissions, etc. Do you have an important presentation coming up Are you looking for something that will make your presentation stand out from the rest Look no further than Dashboard For Tracking Ambassador Marketing Tracking Word Mouth Marketing Summary PDF. With our professional designs, you can trust that your presentation will pop and make delivering it a smooth process. And with Slidegeeks, you can trust that your presentation will be unique and memorable. So why wait Grab Dashboard For Tracking Ambassador Marketing Tracking Word Mouth Marketing Summary PDF today and make your presentation stand out from the rest This slide covers the KPI dashboard for companies to evaluate the performance of ambassador marketing campaigns. It includes metrics such as the number of brand ambassadors, the total number of shares, clicks, CPS, revenue, commissions, etc.
Dashboard For Tracking Referral Marketing Tracking Word Mouth Marketing Slides PDF
This slide covers the KPI dashboard for brands to evaluate the performance of referral marketing campaigns. It includes metrics such as referral participation rate, referred customers, referral conversion rate, total revenue generated, etc. Whether you have daily or monthly meetings, a brilliant presentation is necessary. Dashboard For Tracking Referral Marketing Tracking Word Mouth Marketing Slides PDF can be your best option for delivering a presentation. Represent everything in detail using Dashboard For Tracking Referral Marketing Tracking Word Mouth Marketing Slides PDF and make yourself stand out in meetings. The template is versatile and follows a structure that will cater to your requirements. All the templates prepared by Slidegeeks are easy to download and edit. Our research experts have taken care of the corporate themes as well. So, give it a try and see the results. This slide covers the KPI dashboard for brands to evaluate the performance of referral marketing campaigns. It includes metrics such as referral participation rate, referred customers, referral conversion rate, total revenue generated, etc.
Dashboard For Tracking Referral Implementing Social Media Tactics For Boosting WOM Icons Pdf
This slide covers the KPI dashboard for brands to evaluate the performance of referral marketing campaigns. It includes metrics such as referral participation rate, referred customers, referral conversion rate, total revenue generated, etc.Do you have an important presentation coming up Are you looking for something that will make your presentation stand out from the rest Look no further than Dashboard For Tracking Referral Implementing Social Media Tactics For Boosting WOM Icons Pdf. With our professional designs, you can trust that your presentation will pop and make delivering it a smooth process. And with Slidegeeks, you can trust that your presentation will be unique and memorable. So why wait Grab Dashboard For Tracking Referral Implementing Social Media Tactics For Boosting WOM Icons Pdf today and make your presentation stand out from the rest This slide covers the KPI dashboard for brands to evaluate the performance of referral marketing campaigns. It includes metrics such as referral participation rate, referred customers, referral conversion rate, total revenue generated, etc.
Dashboard Tracking Ambassador Implementing Social Media Tactics For Boosting WOM Demonstration Pdf
This slide covers the KPI dashboard for companies to evaluate the performance of ambassador marketing campaigns. It includes metrics such as the number of brand ambassadors, the total number of shares, clicks, CPS, revenue, commissions, etc.Find highly impressive Dashboard Tracking Ambassador Implementing Social Media Tactics For Boosting WOM Demonstration Pdf on Slidegeeks to deliver a meaningful presentation. You can save an ample amount of time using these presentation templates. No need to worry to prepare everything from scratch because Slidegeeks experts have already done a huge research and work for you. You need to download Dashboard Tracking Ambassador Implementing Social Media Tactics For Boosting WOM Demonstration Pdf for your upcoming presentation. All the presentation templates are 100 percent editable and you can change the color and personalize the content accordingly. Download now This slide covers the KPI dashboard for companies to evaluate the performance of ambassador marketing campaigns. It includes metrics such as the number of brand ambassadors, the total number of shares, clicks, CPS, revenue, commissions, etc.

Customer Satisfaction Template Ppt PowerPoint Presentation Show Introduction
This is a customer satisfaction template ppt powerpoint presentation show introduction. This is a three stage process. The stages in this process are overall satisfaction with service, satisfaction with value for money, overall satisfaction with relationship.
Credit Management And Recovery Policies Our Key Performance Indicators For Balance Sheet Rules PDF
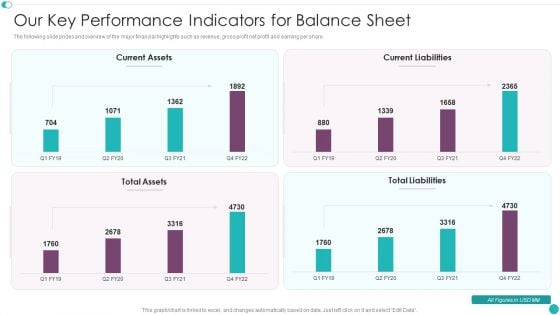
The following slide prides and overview of the major financial highlights such as revenue, gross profit net profit and earning per share. Deliver an awe inspiring pitch with this creative Credit Management And Recovery Policies Our Key Performance Indicators For Balance Sheet Rules PDF bundle. Topics like Current Assets, Current Liabilities, Total Liabilities can be discussed with this completely editable template. It is available for immediate download depending on the needs and requirements of the user.
Accounting Key Performance Indicators Ppt Powerpoint
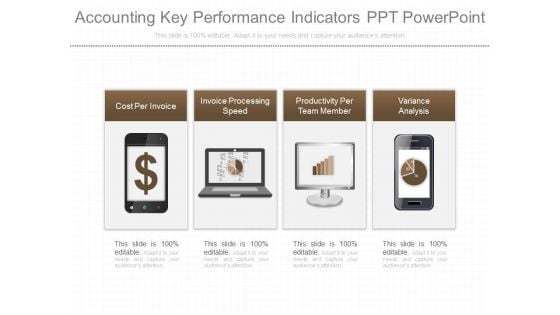
This is a accounting key performance indicators ppt powerpoint. This is a four stage process. The stages in this process are cost per invoice, invoice processing speed, productivity per team member, variance analysis.
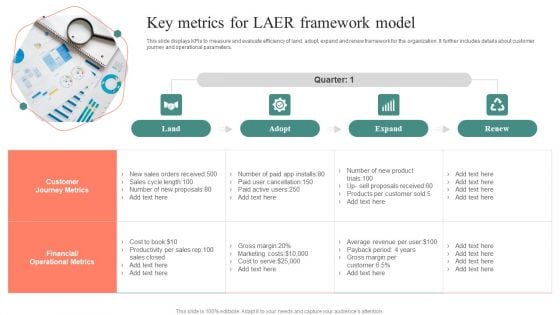
Key Metrics For LAER Framework Model Ideas PDF
This slide displays KPIs to measure and evaluate efficiency of land, adopt, expand and renew framework for the organization. It further includes details about customer journey and operational parameters. Presenting Key Metrics For LAER Framework Model Ideas PDF to dispense important information. This template comprises four stages. It also presents valuable insights into the topics including Customer Journey Metrics, Financial Operational Metrics. This is a completely customizable PowerPoint theme that can be put to use immediately. So, download it and address the topic impactfully.
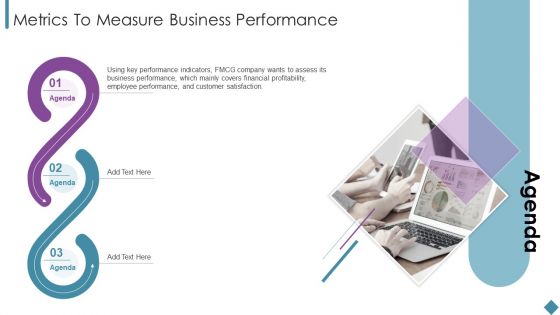
Metrics To Measure Business Performance Agenda Ppt Layouts Graphic Images PDF
This is a Metrics To Measure Business Performance Agenda Ppt Layouts Graphic Images PDF template with various stages. Focus and dispense information on three stages using this creative set, that comes with editable features. It contains large content boxes to add your information on topics like Key Performance Indicators, Financial Profitability, Customer Satisfaction. You can also showcase facts, figures, and other relevant content using this PPT layout. Grab it now.
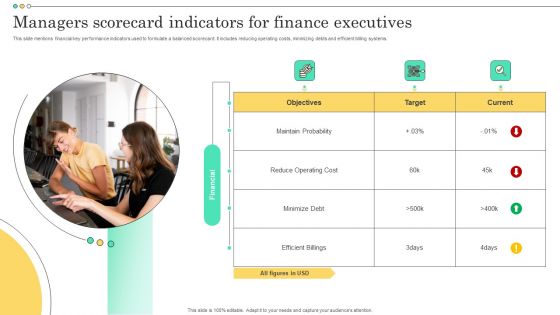
Managers Scorecard Indicators For Finance Executives Topics PDF
Impact Of Customer Churn On Organization Performance Icons PDF
Mentioned slide outlines the impact of a higher attrition rate on the companys financial performance. It contains information about major financial key performance indicators KPIs such as monthly recurring revenue MRR, customer lifetime value CLV, and customer acquisition cost CAC. If you are looking for a format to display your unique thoughts, then the professionally designed Impact Of Customer Churn On Organization Performance Icons PDF is the one for you. You can use it as a Google Slides template or a PowerPoint template. Incorporate impressive visuals, symbols, images, and other charts. Modify or reorganize the text boxes as you desire. Experiment with shade schemes and font pairings. Alter, share or cooperate with other people on your work. Download Impact Of Customer Churn On Organization Performance Icons PDF and find out how to give a successful presentation. Present a perfect display to your team and make your presentation unforgettable.
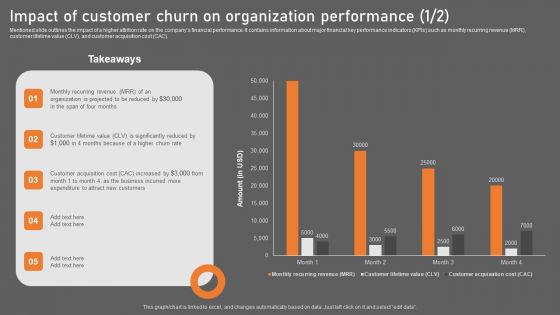
Impact Of Customer Churn On Organization Performance Background PDF
Mentioned slide outlines the impact of a higher attrition rate on the companys financial performance. It contains information about major financial key performance indicators KPIs such as monthly recurring revenue MRR, customer lifetime value CLV, and customer acquisition cost CAC. Take your projects to the next level with our ultimate collection of Impact Of Customer Churn On Organization Performance Background PDF. Slidegeeks has designed a range of layouts that are perfect for representing task or activity duration, keeping track of all your deadlines at a glance. Tailor these designs to your exact needs and give them a truly corporate look with your own brand colors they will make your projects stand out from the rest.
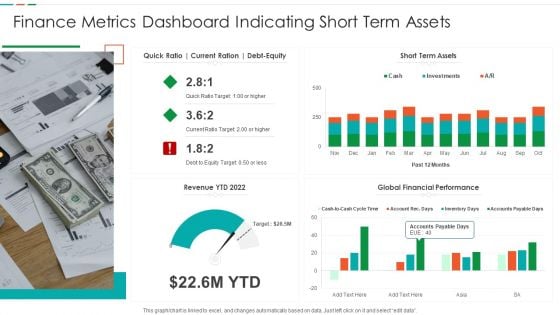
Finance Metrics Dashboard Indicating Short Term Assets Download PDF
This graph or chart is linked to excel, and changes automatically based on data. Just left click on it and select edit data. Pitch your topic with ease and precision using this Finance Metrics Dashboard Indicating Short Term Assets Download PDF. This layout presents information on Short Term Assets, Global Financial Performance, Revenue YTD 2022. It is also available for immediate download and adjustment. So, changes can be made in the color, design, graphics or any other component to create a unique layout.
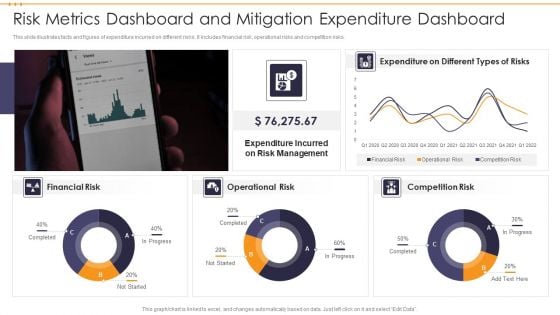
Risk Metrics Dashboard And Mitigation Expenditure Dashboard Ideas PDF
This slide illustrates facts and figures of expenditure incurred on different risks. It includes financial risk, operational risks and competition risks. Pitch your topic with ease and precision using this Risk Metrics Dashboard And Mitigation Expenditure Dashboard Ideas PDF. This layout presents information on Management, Expenditure, Risk. It is also available for immediate download and adjustment. So, changes can be made in the color, design, graphics or any other component to create a unique layout.
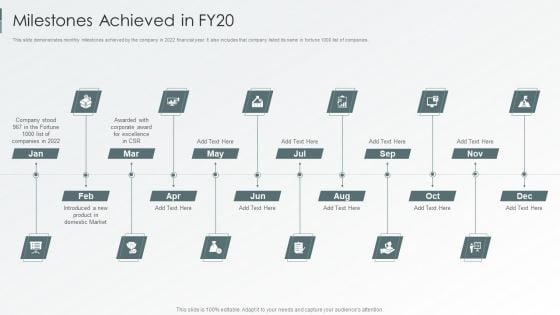
Enterprise Sustainability Performance Metrics Milestones Achieved In FY20 Inspiration PDF
This slide demonstrates monthly milestones achieved by the company in 2022 financial year. It also includes that company listed its name in fortune 1000 list of companies. Deliver an awe inspiring pitch with this creative Enterprise Sustainability Performance Metrics Milestones Achieved In FY20 Inspiration PDF bundle. Topics like Corporate Award, Domestic Market, Award Excellence can be discussed with this completely editable template. It is available for immediate download depending on the needs and requirements of the user.
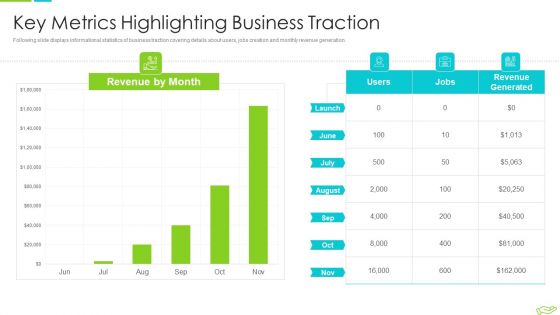
Elevator Pitch Deck To Raise Funds Key Metrics Highlighting Business Traction Clipart PDF
Following slide displays informational statistics of business traction covering details about users, jobs creation and monthly revenue generation. Deliver and pitch your topic in the best possible manner with this elevator pitch deck to raise funds key financial projections for upcoming years pictures pdf. Use them to share invaluable insights on key metrics highlighting business traction and impress your audience. This template can be altered and modified as per your expectations. So, grab it now.
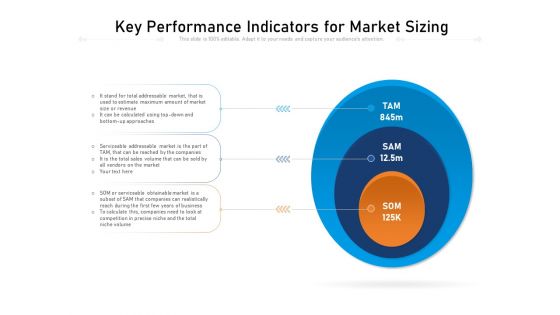
Key Performance Indicators For Market Sizing Ppt PowerPoint Presentation Visuals PDF
Presenting key performance indicators for market sizing ppt powerpoint presentation visuals pdf to dispense important information. This template comprises three stages. It also presents valuable insights into the topics including tam, sam, som. This is a completely customizable PowerPoint theme that can be put to use immediately. So, download it and address the topic impactfully.
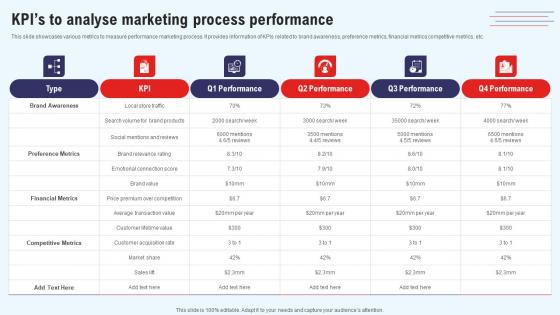
Efficient Marketing Process For Business Kpis To Analyse Marketing Process Performance Elements Pdf
This slide showcases various metrics to measure performance marketing process. It provides information of KPIs related to brand awareness, preference metrics, financial metrics competitive metrics, etc. This modern and well-arranged Efficient Marketing Process For Business Kpis To Analyse Marketing Process Performance Elements Pdf provides lots of creative possibilities. It is very simple to customize and edit with the Powerpoint Software. Just drag and drop your pictures into the shapes. All facets of this template can be edited with Powerpoint no extra software is necessary. Add your own material, put your images in the places assigned for them, adjust the colors, and then you can show your slides to the world, with an animated slide included. This slide showcases various metrics to measure performance marketing process. It provides information of KPIs related to brand awareness, preference metrics, financial metrics competitive metrics, etc.
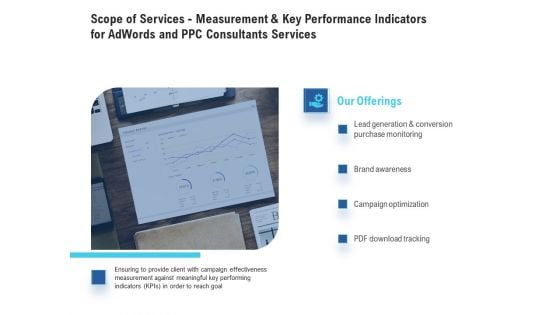
Scope Of Services - Measurement And Key Performance Indicators For Adwords And PPC Consultants Services Brochure PDF
Presenting this set of slides with name scope of services - measurement and key performance indicators for adwords and ppc consultants services brochure pdf. This is a four stage process. The stages in this process are lead generation and conversion purchase monitoring, brand awareness, campaign optimization, pdf download tracking. This is a completely editable PowerPoint presentation and is available for immediate download. Download now and impress your audience.
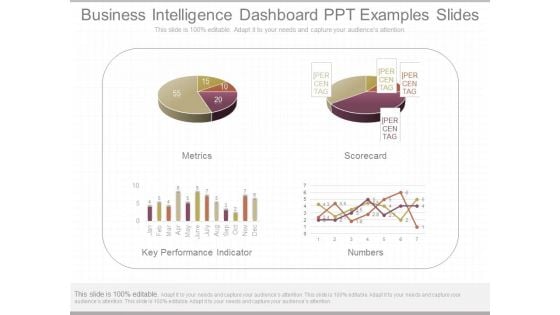
Business Intelligence Dashboard Ppt Examples Slides
This is a business intelligence dashboard ppt examples slides. This is a four stage process. The stages in this process are metrics, scorecard, key performance indicator, numbers.
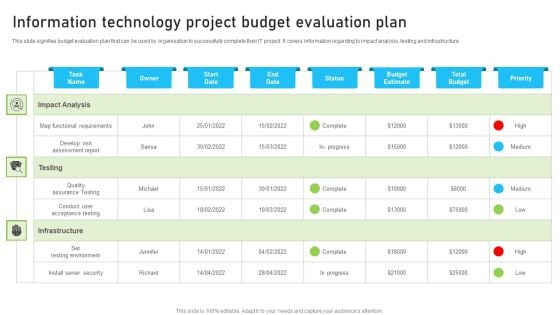
Information Technology Project Budget Evaluation Plan Pictures PDF
This slide signifies the project key performance indicator dashboard to evaluate financial budget evaluation. It covers information regarding to allocated and used budget. Pitch your topic with ease and precision using this Information Technology Project Budget Evaluation Plan Pictures PDF. This layout presents information on Develop Risk Assessment Report, Environment, Security. It is also available for immediate download and adjustment. So, changes can be made in the color, design, graphics or any other component to create a unique layout.
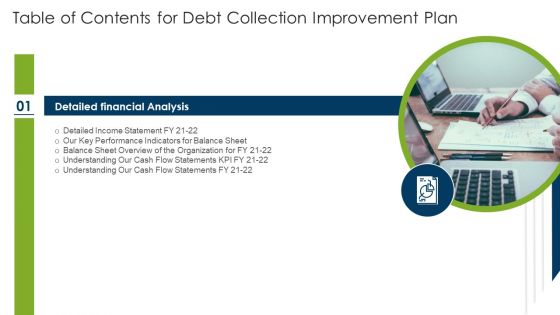
Table Of Contents For Debt Collection Improvement Plan Download PDF
This is a table of contents for debt collection improvement plan download pdf template with various stages. Focus and dispense information on one stages using this creative set, that comes with editable features. It contains large content boxes to add your information on topics like detailed financial analysis, balance sheet overview organization, our key performance indicators balance sheet, understanding our cash flow statements. You can also showcase facts, figures, and other relevant content using this PPT layout. Grab it now.
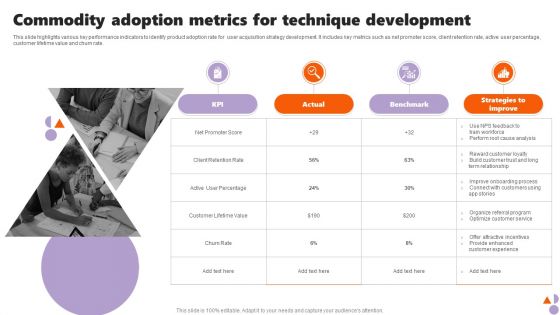
Commodity Adoption Metrics For Technique Development Microsoft PDF
This slide highlights various key performance indicators to identify product adoption rate for user acquisition strategy development. It includes key metrics such as net promoter score, client retention rate, active user percentage, customer lifetime value and churn rate. Presenting Commodity Adoption Metrics For Technique Development Microsoft PDF to dispense important information. This template comprises four stages. It also presents valuable insights into the topics including Build Customer, Onboarding Process, Analysis. This is a completely customizable PowerPoint theme that can be put to use immediately. So, download it and address the topic impactfully.
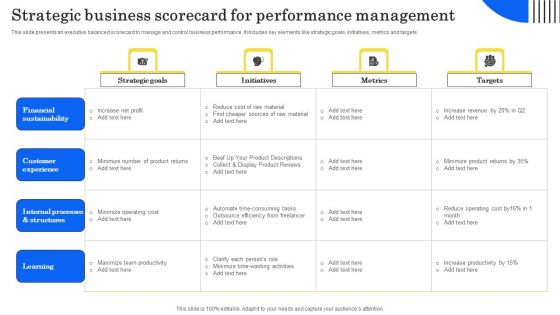
Strategic Business Scorecard For Performance Management Infographics PDF
This slide presents an executive balanced scorecard to manage and control business performance. It includes key elements like strategic goals, initiatives, metrics and targets. Showcasing this set of slides titled Strategic Business Scorecard For Performance Management Infographics PDF.Q The topics addressed in these templates are Financial Sustainability, Customer Experience, Internal Processes Structures. All the content presented in this PPT design is completely editable. Download it and make adjustments in color, background, font etc. as per your unique business setting.
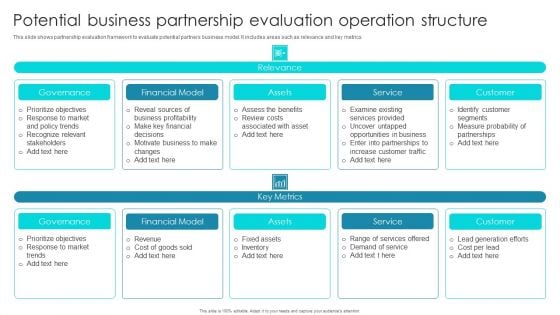
Potential Business Partnership Evaluation Operation Structure Ppt Inspiration Templates PDF
This slide shows partnership evaluation framework to evaluate potential partners business model. It includes areas such as relevance and key metrics. Showcasing this set of slides titled Potential Business Partnership Evaluation Operation Structure Ppt Inspiration Templates PDF. The topics addressed in these templates are Governance, Financial Model, Assets, Service. All the content presented in this PPT design is completely editable. Download it and make adjustments in color, background, font etc. as per your unique business setting.
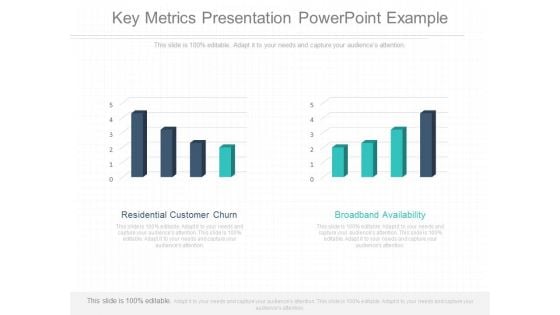
Key Metrics Presentation Powerpoint Example
This is a key metrics presentation powerpoint example. This is a two stage process. The stages in this process are residential customer churn, broadband availability.
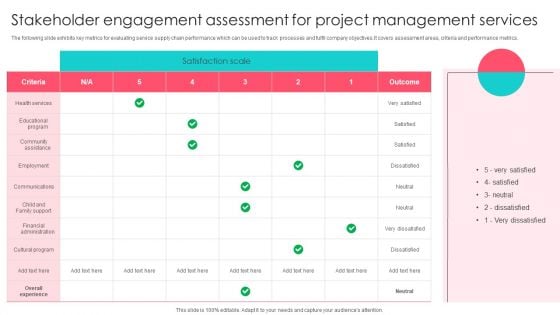
Stakeholder Engagement Assessment For Project Management Services Graphics PDF
The following slide exhibits key metrics for evaluating service supply chain performance which can be used to track processes and fulfil company objectives.It covers assessment areas, criteria and performance metrics. Showcasing this set of slides titled Stakeholder Engagement Assessment For Project Management Services Graphics PDF. The topics addressed in these templates are Communications, Financial Administration, Employment. All the content presented in this PPT design is completely editable. Download it and make adjustments in color, background, font etc. as per your unique business setting.
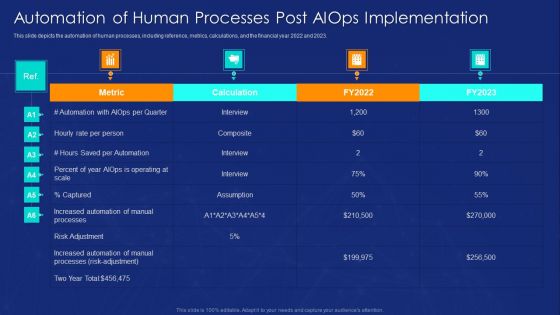
Automation Of Human Processes Post AIOPS Implementation Ppt Ideas Background Image PDF
This slide depicts the automation of human processes, including reference, metrics, calculations, and the financial year 2022 and 2023. Deliver an awe inspiring pitch with this creative Automation Of Human Processes Post AIOPS Implementation Ppt Ideas Background Image PDF bundle. Topics like Metric, Hourly Rate, Per Person, Risk Adjustment can be discussed with this completely editable template. It is available for immediate download depending on the needs and requirements of the user.
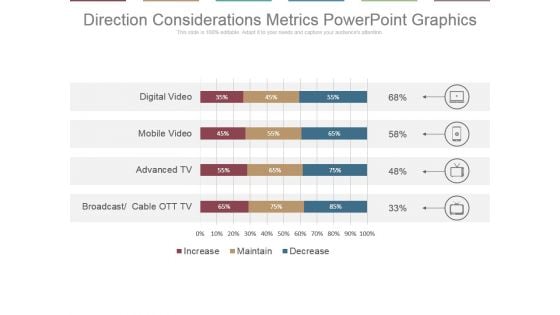
Direction Considerations Metrics Powerpoint Graphics
This is a direction considerations metrics powerpoint graphics. This is a four stage process. The stages in this process are digital video, mobile video, advanced tv, broadcast, cable ott tv.

Asset Assessment Dashboard With Cash Flow And Market Value Summary PDF
This slide illustrates asset valuation dashboard with key financial metrics. It provides information about cash flow, market value, intrinsic value, assumptions, market cap, discount rate, etc.Showcasing this set of slides titled Asset Assessment Dashboard With Cash Flow And Market Value Summary PDF. The topics addressed in these templates are Discount Rate, Capital Expenditure, Market Capitalization. All the content presented in this PPT design is completely editable. Download it and make adjustments in color, background, font etc. as per your unique business setting.
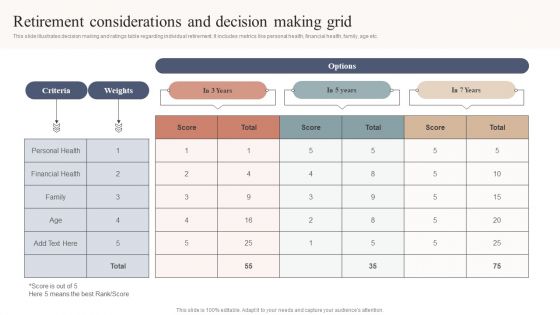
Retirement Considerations And Decision Making Grid Information PDF
This slide illustrates decision making and ratings table regarding individual retirement. It includes metrics like personal health, financial health, family, age etc. Showcasing this set of slides titled Retirement Considerations And Decision Making Grid Information PDF. The topics addressed in these templates are Retirement Considerations, Decision Making Grid. All the content presented in this PPT design is completely editable. Download it and make adjustments in color, background, font etc. as per your unique business setting.
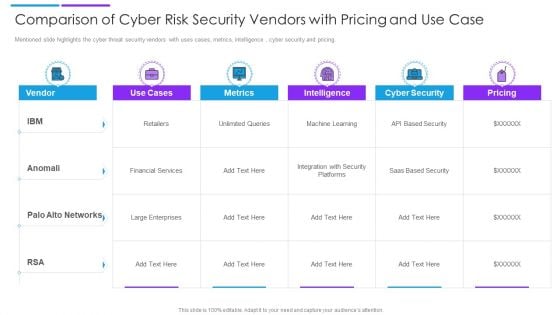
Comparison Of Cyber Risk Security Vendors With Pricing And Use Case Formats PDF
Mentioned slide highlights the cyber threat security vendors with uses cases, metrics, intelligence , cyber security and pricing. Pitch your topic with ease and precision using this comparison of cyber risk security vendors with pricing and use case formats pdf. This layout presents information on financial services, cyber security, intelligence. It is also available for immediate download and adjustment. So, changes can be made in the color, design, graphics or any other component to create a unique layout.
Customer Management With Service Tracking Ppt PowerPoint Presentation File Graphics Template PDF
Persuade your audience using this customer management with service tracking ppt powerpoint presentation file graphics template pdf. This PPT design covers four stages, thus making it a great tool to use. It also caters to a variety of topics including client strategy, service tracking, financial metrics. Download this PPT design now to present a convincing pitch that not only emphasizes the topic but also showcases your presentation skills.

Next View Ventures Fundraising Pitch Deck Table Of Contents Elements PDF
This is a next view ventures fundraising pitch deck table of contents elements pdf template with various stages. Focus and dispense information on twelve stages using this creative set, that comes with editable features. It contains large content boxes to add your information on topics like planning scenario, traction metrics, leadership team, competitive analysis, financial overview. You can also showcase facts, figures, and other relevant content using this PPT layout. Grab it now.
Social Media And Word Of Mouth Metrics Ppt Powerpoint Presentation Icon Portfolio
This is a social media and word of mouth metrics ppt powerpoint presentation icon portfolio. This is a ten stage process. The stages in this process are financial, marketing, analysis, investment, business.
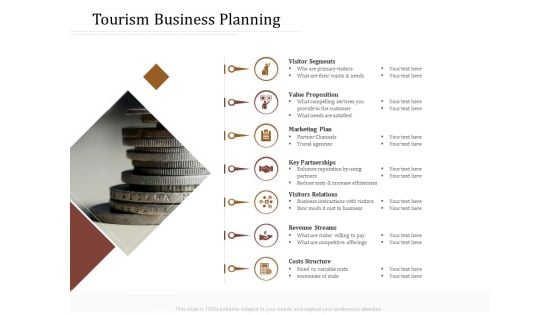
Key Metrics Hotel Administration Management Tourism Business Planning Brochure PDF
Presenting this set of slides with name key metrics hotel administration management tourism business planning brochure pdf. This is a seven stage process. The stages in this process are visitor segments, value proposition, marketing plan, revenue streams, costs structure. This is a completely editable PowerPoint presentation and is available for immediate download. Download now and impress your audience.


 Continue with Email

 Home
Home


