Financial Kpi
Cyclic Revenue Model Powerpoint Presentation Slides
Use this Cyclic Revenue Model Powerpoint Presentation Slides to ensure the business world gets to know you as a presentation expert with tremendous recall value. With its focus on providing the worlds best designs to highlight business ideas that have the potential to change the world, this PPT Template is sure to win you clients. The complete deck in Subscription Based Business Model, Saas Revenue Model, Monthly Recurring Revenue slides is a compendium of information, structured in a manner that provides the best framework for a presentation. Use this completely editable and customizable presentation to make an impact and improve your order book. Download now. A recurring revenue model ensures steady income as customers purchase products or services at predictable intervals. Our Cyclic Revenue Model presentation helps strategy managers boost revenue inflow by implementing structured revenue strategies. It highlights past financial issues like low profits and suggests effective solutions. The SaaS revenue model deck analyzes various revenue types based on factors like annual recurring revenue, customer conversion rates, and average revenue per unit. It also explores different recurring revenue models, their benefits, and implementation steps. The presentation includes key performance metrics such as churn rate and account expansion, with dashboards for tracking revenue performance. Get access now.

Quarterly Report Powerpoint Presentation Slides PPT Example
This Quarterly Report Powerpoint Presentation Slides PPT Example is a primer on how to capitalize on business opportunities through planning, innovation, and market intelligence. The content-ready format of the complete deck will make your job as a decision-maker a lot easier. Use this ready-made PowerPoint Template to help you outline an extensive and legible plan to capture markets and grow your company on the right path, at an exponential pace. What is even more amazing is that this presentation is completely editable and 100 percent customizable. This twenty six slide complete deck helps you impress a roomful of people with your expertise in business and even presentation. Craft such a professional and appealing presentation for that amazing recall value. Download now. Our comprehensive Quarterly Report Template is a professionally created presentation that can help organizations in representing key data, performance metrics and progress updates. This ppt streamlines the reporting process by providing structured sections for financial results, project updates, strategic insights, etc. It is ideal for internal reviews, stakeholder presentations, and executive summaries, ensuring your quarterly updates are communicated effectively and positively.
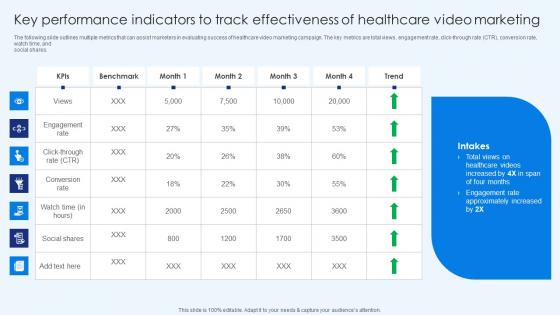
Healthcare Promotion Key Performance Indicators To Track Effectiveness Formats Pdf
The following slide outlines multiple metrics that can assist marketers in evaluating success of healthcare video marketing campaign. The key metrics are total views, engagement rate, click-through rate CTR, conversion rate, watch time, and social shares. Make sure to capture your audiences attention in your business displays with our gratis customizable Healthcare Promotion Key Performance Indicators To Track Effectiveness Formats Pdf. These are great for business strategies, office conferences, capital raising or task suggestions. If you desire to acquire more customers for your tech business and ensure they stay satisfied, create your own sales presentation with these plain slides. The following slide outlines multiple metrics that can assist marketers in evaluating success of healthcare video marketing campaign. The key metrics are total views, engagement rate, click-through rate CTR, conversion rate, watch time, and social shares.
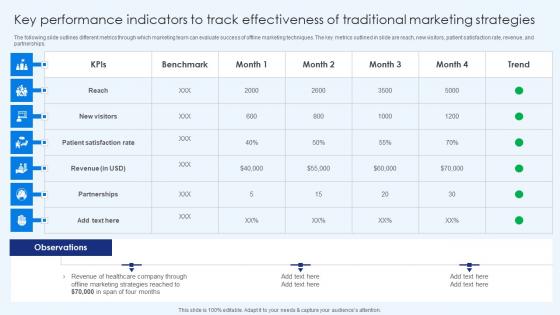
Key Performance Indicators To Track Effectivenes Healthcare Promotion Infographics Pdf
The following slide outlines different metrics through which marketing team can evaluate success of offline marketing techniques. The key metrics outlined in slide are reach, new visitors, patient satisfaction rate, revenue, and partnerships. The Key Performance Indicators To Track Effectivenes Healthcare Promotion Infographics Pdf is a compilation of the most recent design trends as a series of slides. It is suitable for any subject or industry presentation, containing attractive visuals and photo spots for businesses to clearly express their messages. This template contains a variety of slides for the user to input data, such as structures to contrast two elements, bullet points, and slides for written information. Slidegeeks is prepared to create an impression. The following slide outlines different metrics through which marketing team can evaluate success of offline marketing techniques. The key metrics outlined in slide are reach, new visitors, patient satisfaction rate, revenue, and partnerships.
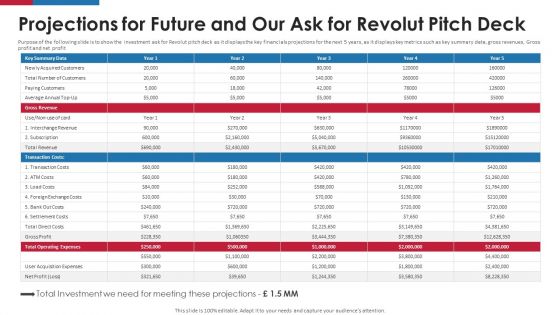
Revolut Capital Funding Projections For Future And Our Ask For Revolut Pitch Deck Ppt Pictures PDF
Purpose of the following slide is to show the investment ask for Revolut pitch deck as it displays the key financials projections for the next 5 years, as it displays key metrics such as key summary data, gross revenues, Gross profit and net profit. Purpose of the following slide is to show the investment ask for Revolut pitch deck as it displays the key financials projections for the next 5 years, as it displays key metrics such as key summary data, gross revenues, Gross profit and net profit. Deliver and pitch your topic in the best possible manner with this Revolut Capital Funding Projections For Future And Our Ask For Revolut Pitch Deck Ppt Pictures PDF. Use them to share invaluable insights on Key Summary Data, Gross Revenue, Transaction Costs and impress your audience. This template can be altered and modified as per your expectations. So, grab it now.
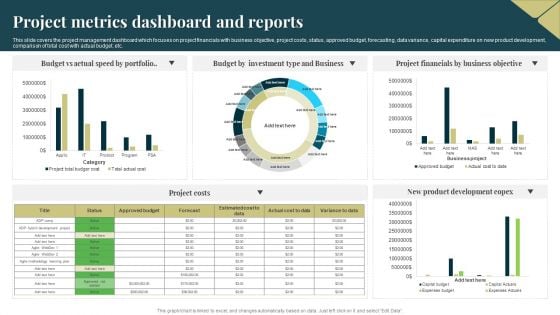
Project Metrics Dashboard And Reports Portrait PDF
This slide covers the project management dashboard which focuses on project financials with business objective, project costs, status, approved budget, forecasting, data variance, capital expenditure on new product development, comparison of total cost with actual budget, etc. Showcasing this set of slides titled Project Metrics Dashboard And Reports Portrait PDF. The topics addressed in these templates are Budget, Portfolio, Investment. All the content presented in this PPT design is completely editable. Download it and make adjustments in color, background, font etc. as per your unique business setting.
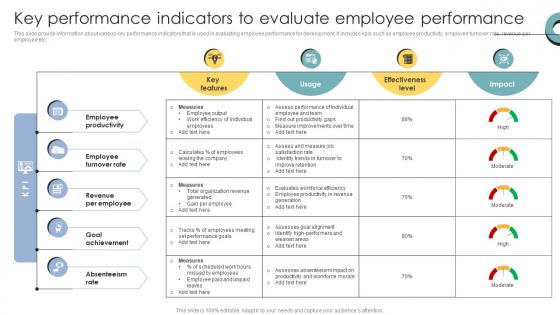
Skill Enhancement Performance Key Performance Indicators To Evaluate Employee Performance
This slide provide information about various key performance indicators that is used in evaluating employee performance for development. It includes kpis such as employee productivity, employee turnover rate, revenue per employee etc. Get a simple yet stunning designed Skill Enhancement Performance Key Performance Indicators To Evaluate Employee Performance. It is the best one to establish the tone in your meetings. It is an excellent way to make your presentations highly effective. So, download this PPT today from Slidegeeks and see the positive impacts. Our easy-to-edit Skill Enhancement Performance Key Performance Indicators To Evaluate Employee Performance can be your go-to option for all upcoming conferences and meetings. So, what are you waiting for Grab this template today. This slide provide information about various key performance indicators that is used in evaluating employee performance for development. It includes kpis such as employee productivity, employee turnover rate, revenue per employee etc.
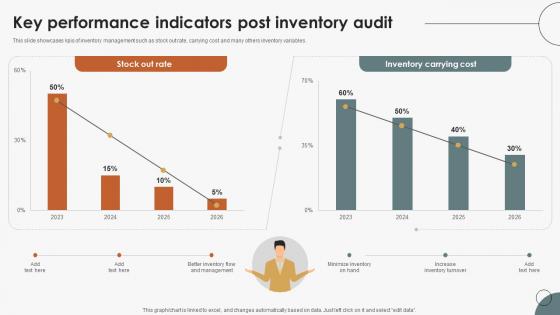
Boosting Efficiency In Inventory Key Performance Indicators Post Inventory Audit
This slide showcases kpis of inventory management such as stock out rate, carrying cost and many others inventory variables. Make sure to capture your audiences attention in your business displays with our gratis customizable Boosting Efficiency In Inventory Key Performance Indicators Post Inventory Audit. These are great for business strategies, office conferences, capital raising or task suggestions. If you desire to acquire more customers for your tech business and ensure they stay satisfied, create your own sales presentation with these plain slides. This slide showcases kpis of inventory management such as stock out rate, carrying cost and many others inventory variables.
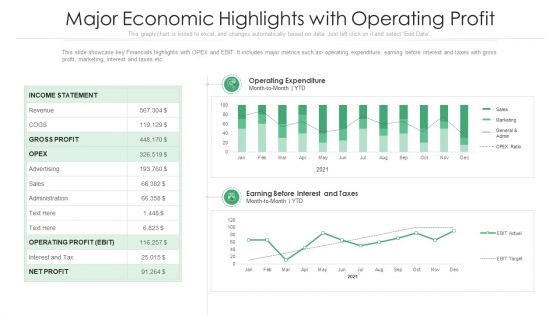
Major Economic Highlights With Operating Profit Ppt PowerPoint Presentation File Portfolio PDF
This slide showcase key Financials highlights with OPEX and EBIT. It includes major metrics such as- operating expenditure, earning before interest and taxes with gross profit, marketing, interest and taxes etc. Showcasing this set of slides titled major economic highlights with operating profit ppt powerpoint presentation file portfolio pdf. The topics addressed in these templates are revenue, sales, administration. All the content presented in this PPT design is completely editable. Download it and make adjustments in color, background, font etc. as per your unique business setting.
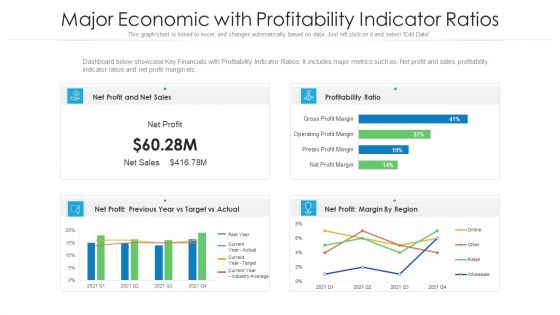
Major Economic With Profitability Indicator Ratios Ppt PowerPoint Presentation Gallery Layouts PDF
Dashboard below showcase Key Financials with Profitability Indicator Ratios. It includes major metrics such as- Net profit and sales, profitability indicator ratios and net profit margin etc. Pitch your topic with ease and precision using this major economic with profitability indicator ratios ppt powerpoint presentation gallery layouts pdf. This layout presents information on sales, profitability ratio, target. It is also available for immediate download and adjustment. So, changes can be made in the color, design, graphics or any other component to create a unique layout.
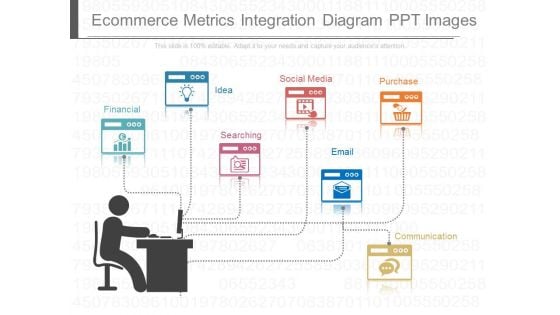
Ecommerce Metrics Integration Diagram Ppt Images
This is a ecommerce metrics integration diagram ppt images. This is a seven stage process. The stages in this process are financial, idea, searching, social media, email, purchase, communication.
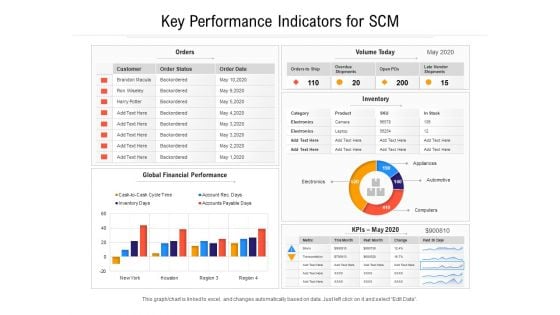
Key Performance Indicators For SCM Ppt PowerPoint Presentation File Graphic Tips PDF
Presenting this set of slides with name key performance indicators for scm ppt powerpoint presentation file graphic tips pdf. The topics discussed in these slides are global, financial, perform. This is a completely editable PowerPoint presentation and is available for immediate download. Download now and impress your audience.
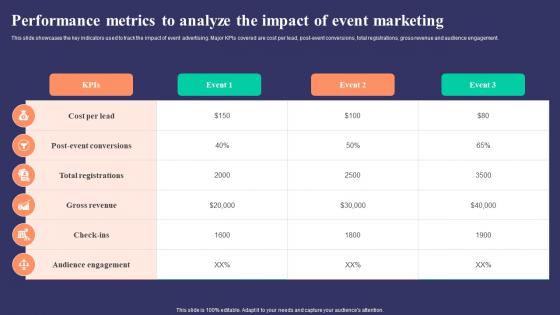
Performance Metrics To Analyze The Impact Strategies To Develop Successful Clipart Pdf
This slide showcases the key indicators used to track the impact of event advertising. Major KPIs covered are cost per lead, post event conversions, total registrations, gross revenue and audience engagement.Make sure to capture your audiences attention in your business displays with our gratis customizable Performance Metrics To Analyze The Impact Strategies To Develop Successful Clipart Pdf. These are great for business strategies, office conferences, capital raising or task suggestions. If you desire to acquire more customers for your tech business and ensure they stay satisfied, create your own sales presentation with these plain slides. This slide showcases the key indicators used to track the impact of event advertising. Major KPIs covered are cost per lead, post event conversions, total registrations, gross revenue and audience engagement.
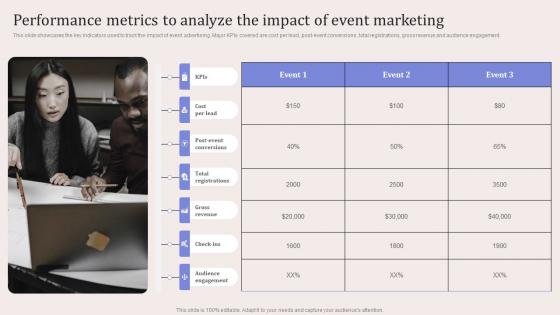
Performance Metrics To Analyze The Impact Virtual Event Promotion To Capture Inspiration Pdf
This slide showcases the key indicators used to track the impact of event advertising. Major KPIs covered are cost per lead, post-event conversions, total registrations, gross revenue and audience engagement. Welcome to our selection of the Performance Metrics To Analyze The Impact Virtual Event Promotion To Capture Inspiration Pdf. These are designed to help you showcase your creativity and bring your sphere to life. Planning and Innovation are essential for any business that is just starting out. This collection contains the designs that you need for your everyday presentations. All of our PowerPoints are 100 percent editable, so you can customize them to suit your needs. This multi-purpose template can be used in various situations. Grab these presentation templates today. This slide showcases the key indicators used to track the impact of event advertising. Major KPIs covered are cost per lead, post-event conversions, total registrations, gross revenue and audience engagement.
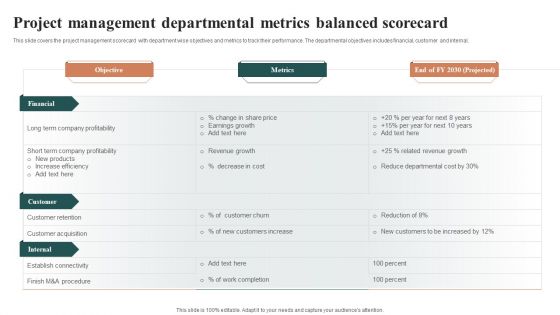
Project Management Departmental Metrics Balanced Scorecard Introduction PDF
This slide covers the project management scorecard with department wise objectives and metrics to track their performance. The departmental objectives includes financial, customer and internal. Showcasing this set of slides titled Project Management Departmental Metrics Balanced Scorecard Introduction PDF. The topics addressed in these templates are Customer, Financial, Customer Retention. All the content presented in this PPT design is completely editable. Download it and make adjustments in color, background, font etc. as per your unique business setting.

Stock Performance Metrics For Warehouse Management Ppt Tips PDF
This slide indicates the inventory KPIs for warehouse management which helps in improving logistics business activities. It includes parameters such as financial, productivity, utilization, etc. Showcasing this set of slides titled Stock Performance Metrics For Warehouse Management Ppt Tips PDF. The topics addressed in these templates are Receiving, Financial, Productivity. All the content presented in this PPT design is completely editable. Download it and make adjustments in color, background, font etc. as per your unique business setting.
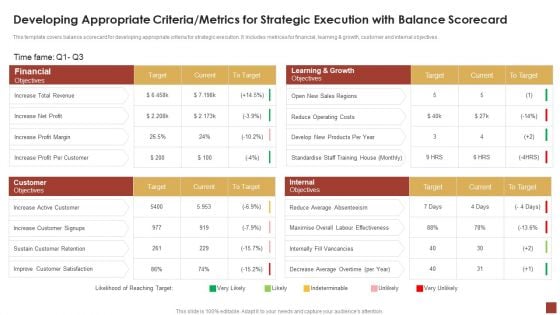
Strategical And Tactical Planning Developing Appropriate Criteria Metrics For Strategic Execution Ideas PDF
This template covers balance scorecard for developing appropriate criteria for strategic execution. It includes metrices for financial, learning and growth, customer and internal objectives. Deliver and pitch your topic in the best possible manner with this Strategical And Tactical Planning Developing Appropriate Criteria Metrics For Strategic Execution Ideas PDF. Use them to share invaluable insights on Financial, Learning And Growth, Internal, Customer and impress your audience. This template can be altered and modified as per your expectations. So, grab it now.
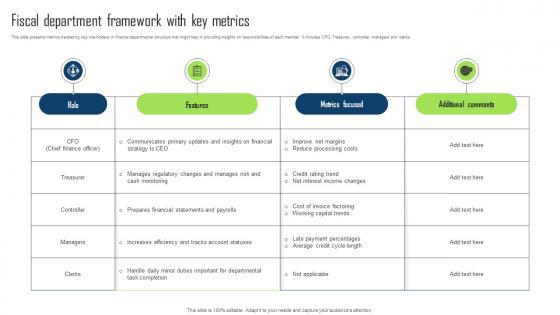
Fiscal Department Framework With Key Metrics Rules Pdf
This slide presents metrics tracked by key role holders in finance departmental structure that might help in providing insights on responsibilities of each member. It includes CFO, Treasurer, controller, managers and clerks. Showcasing this set of slides titled Fiscal Department Framework With Key Metrics Rules Pdf. The topics addressed in these templates are Fiscal Department, Framework With Key Metrics, Insights On Responsibilities. All the content presented in this PPT design is completely editable. Download it and make adjustments in color, background, font etc. as per your unique business setting. This slide presents metrics tracked by key role holders in finance departmental structure that might help in providing insights on responsibilities of each member. It includes CFO, Treasurer, controller, managers and clerks.
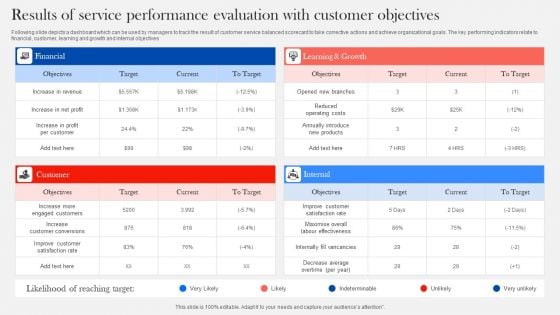
Results Of Service Performance Evaluation With Customer Objectives Diagrams PDF
Following slide depicts a dashboard which can be used by managers to track the result of customer service balanced scorecard to take corrective actions and achieve organizational goals. The key performing indicators relate to financial, customer, learning and growth and internal objectives. Showcasing this set of slides titled Results Of Service Performance Evaluation With Customer Objectives Diagrams PDF. The topics addressed in these templates are Financial, Customer, Internal. All the content presented in this PPT design is completely editable. Download it and make adjustments in color, background, font etc. as per your unique business setting.
International Economic Performance Metrics And Kpis Ppt PowerPoint Presentation Gallery Icon PDF
Presenting this set of slides with name international economic performance metrics and kpis ppt powerpoint presentation gallery icon pdf. The topics discussed in these slides are global, financial, performance. This is a completely editable PowerPoint presentation and is available for immediate download. Download now and impress your audience.

Comparing Overall Business Performance Objectives And Key Result Methodology For Business
The following slide highlights some key performance indicators to compare business performance with industry standards to formulate strategies and fill the gap. It includes elements such as website traffic, customer acquisition cost, employee satisfaction rate, customer churn rate, sales revenue etc. From laying roadmaps to briefing everything in detail, our templates are perfect for you. You can set the stage with your presentation slides. All you have to do is download these easy-to-edit and customizable templates. Comparing Overall Business Performance Objectives And Key Result Methodology For Business will help you deliver an outstanding performance that everyone would remember and praise you for. Do download this presentation today. The following slide highlights some key performance indicators to compare business performance with industry standards to formulate strategies and fill the gap. It includes elements such as website traffic, customer acquisition cost, employee satisfaction rate, customer churn rate, sales revenue etc.
4 Key Market Drivers Of Economic Growth Ppt PowerPoint Presentation Templates
This is a 4 key market drivers of economic growth ppt powerpoint presentation templates. This is a four stage process. The stages in this process are key market driver.
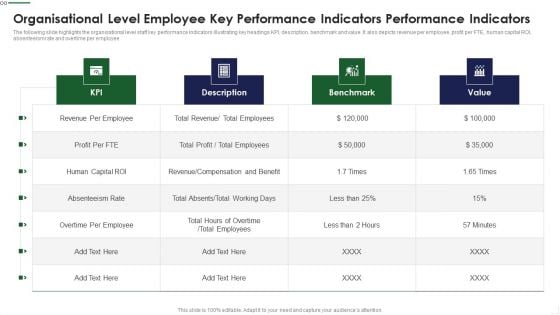
Organisational Level Employee Key Performance Indicators Performance Indicators Rules PDF
The following slide highlights the organisational level staff key performance Indicators illustrating key headings KPI, description, benchmark and value. It also depicts revenue per employee, profit per FTE, human capital ROI, absenteeism rate and overtime per employee Showcasing this set of slides titled Organisational Level Employee Key Performance Indicators Performance Indicators Rules PDF The topics addressed in these templates are Revenue Compensation, Overtime Employee, Benchmark All the content presented in this PPT design is completely editable. Download it and make adjustments in color, background, font etc. as per your unique business setting.
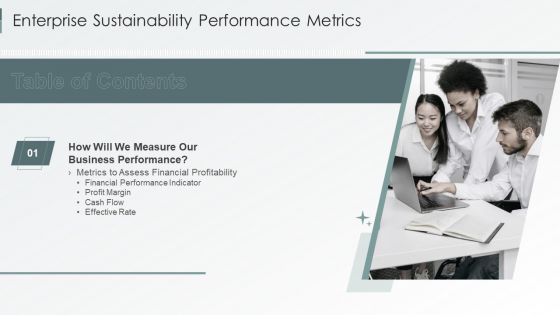
Table Of Contents Enterprise Sustainability Performance Metrics Rules Pictures PDF
This is a Table Of Contents Enterprise Sustainability Performance Metrics Rules Pictures PDF template with various stages. Focus and dispense information on one stage using this creative set, that comes with editable features. It contains large content boxes to add your information on topics like Business Performance, Assess Financial, Performance Indicator. You can also showcase facts, figures, and other relevant content using this PPT layout. Grab it now.
KPIs And Metrics To Measure Pharmaceutical Drug Of Pharmaceutical Company Icons PDF
Mentioned slide showcases various key performance indicators KPIs which can be used to measure the development of pharmaceutical companies in different years. The key metrics are productivity, competency, quality of care and financial. Showcasing this set of slides titled KPIs And Metrics To Measure Pharmaceutical Drug Of Pharmaceutical Company Icons PDF. The topics addressed in these templates are Productivity, Competency, Quality Of Care. All the content presented in this PPT design is completely editable. Download it and make adjustments in color, background, font etc. as per your unique business setting.
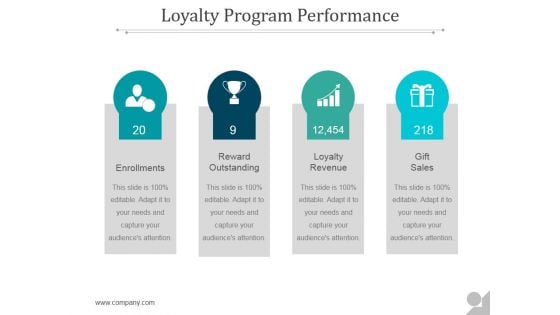
Loyalty Program Performance Ppt PowerPoint Presentation Tips
This is a loyalty program performance ppt powerpoint presentation tips. This is a four stage process. The stages in this process are enrollments, reward outstanding, loyalty revenue, gift sales.
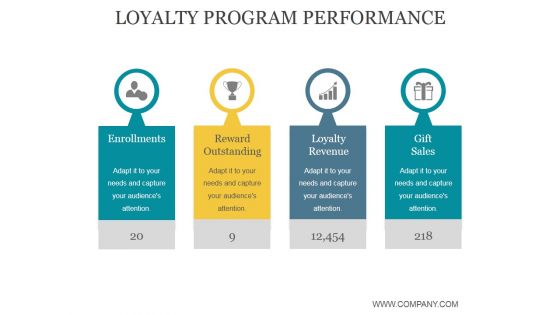
Loyalty Program Performance Ppt PowerPoint Presentation Portfolio
This is a loyalty program performance ppt powerpoint presentation portfolio. This is a four stage process. The stages in this process are enrollments, reward outstanding, loyalty revenue, gift sales.

HR Scoreboard Metrics With Perspectives Themes PDF
The purpose of this slide is to illustrate the HR balanced scorecard based on certain business perceptive that incorporates business goals and human resource strategic objectives. The perceptive include financial, customer, and operations along with objectives and measurements. Showcasing this set of slides titled HR Scoreboard Metrics With Perspectives Themes PDF. The topics addressed in these templates are Financia, Customer, Operations. All the content presented in this PPT design is completely editable. Download it and make adjustments in color, background, font etc. as per your unique business setting.
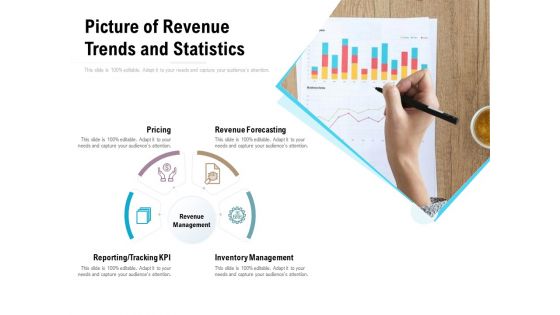
Picture Of Revenue Trends And Statistics Ppt PowerPoint Presentation Ideas Backgrounds
Presenting this set of slides with name picture of revenue trends and statistics ppt powerpoint presentation ideas backgrounds. This is a four stage process. The stages in this process are pricing, revenue forecasting, inventory management, reporting, tracking kpi, revenue management. This is a completely editable PowerPoint presentation and is available for immediate download. Download now and impress your audience.
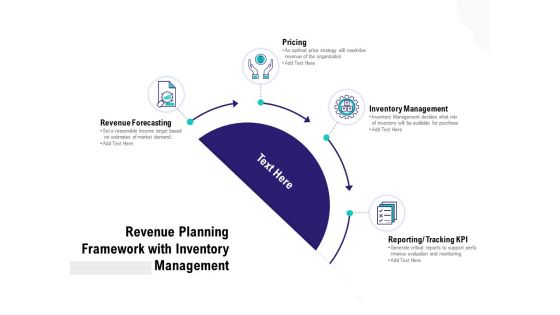
Revenue Planning Framework With Inventory Management Ppt PowerPoint Presentation Show Smartart
Presenting this set of slides with name revenue planning framework with inventory management ppt powerpoint presentation show smartart. This is a four stage process. The stages in this process are revenue forecasting, pricing, inventory management, reporting, tracking kpi. This is a completely editable PowerPoint presentation and is available for immediate download. Download now and impress your audience.

Strategy For Managing Ecommerce Returns Reverse Logistics Dashboard Days Template PDF
Deliver an awe inspiring pitch with this creative strategy for managing ecommerce returns reverse logistics dashboard days template pdf bundle. Topics like global, financial, performance, metric, inventory can be discussed with this completely editable template. It is available for immediate download depending on the needs and requirements of the user.
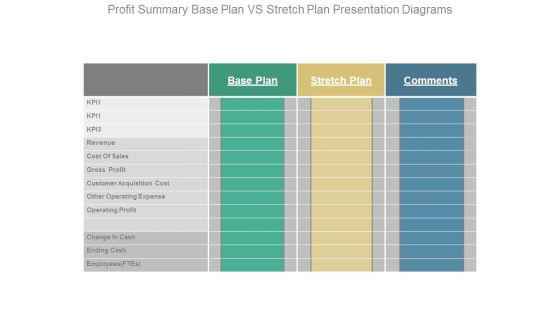
Profit Summary Base Plan Vs Stretch Plan Presentation Diagrams
This is a profit summary base plan vs stretch plan presentation diagrams. This is a three stage process. The stages in this process are base plan, stretch plan, comments, kpi, cost of sales, revenue, gross profit, customer acquisition cost, other operating expense, operating profit, change in cash, ending cash, employees ftes.
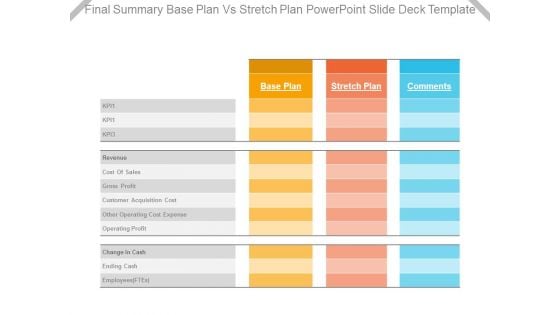
Final Summary Base Plan Vs Stretch Plan Powerpoint Slide Deck Template
This is a final summary base plan vs stretch plan powerpoint slide deck template. This is a three stage process. The stages in this process are kpi, revenue, cost of sales, gross profit, customer acquisition cost, other operating cost expense, operating profit, change in cash, ending cash, employees ftes.
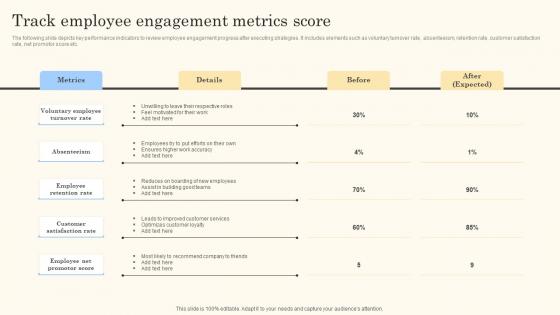
Track Employee Engagement Metrics Score Action Steps For Employee Engagement Slides Pdf
The following slide depicts key performance indicators to review employee engagement progress after executing strategies. It includes elements such as voluntary turnover rate, absenteeism, retention rate, customer satisfaction rate, net promotor score etc.Make sure to capture your audiences attention in your business displays with our gratis customizable Track Employee Engagement Metrics Score Action Steps For Employee Engagement Slides Pdf. These are great for business strategies, office conferences, capital raising or task suggestions. If you desire to acquire more customers for your tech business and ensure they stay satisfied, create your own sales presentation with these plain slides. The following slide depicts key performance indicators to review employee engagement progress after executing strategies. It includes elements such as voluntary turnover rate, absenteeism, retention rate, customer satisfaction rate, net promotor score etc.

IT Value Story Significant To Corporate Leadership Metrics That Communicate The Efficiency Background PDF
This template covers the set of KPIs that most effectively represent the efficiency and effectiveness business contribution of the documented business-impacting services, apps, or projects. Presenting it value story significant to corporate leadership metrics that communicate the efficiency background pdf to provide visual cues and insights. Share and navigate important information on four stages that need your due attention. This template can be used to pitch topics like determine, financial, expenses, metrics. In addtion, this PPT design contains high resolution images, graphics, etc, that are easily editable and available for immediate download.
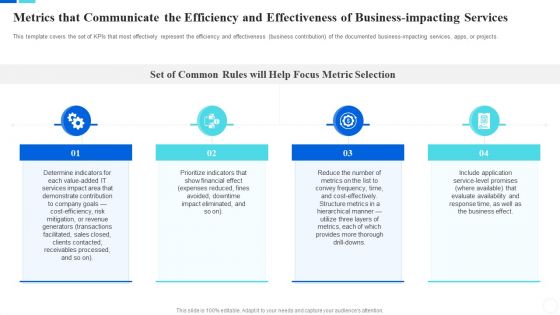
Communicate Company Value To Your Stakeholders Metrics That Communicate The Efficiency Download PDF
This template covers the set of KPIs that most effectively represent the efficiency and effectiveness business contribution of the documented business-impacting services, apps, or projects. This is a communicate company value to your stakeholders metrics that communicate the efficiency download pdf template with various stages. Focus and dispense information on four stages using this creative set, that comes with editable features. It contains large content boxes to add your information on topics like determine, services, financial, expenses, reduce. You can also showcase facts, figures, and other relevant content using this PPT layout. Grab it now.
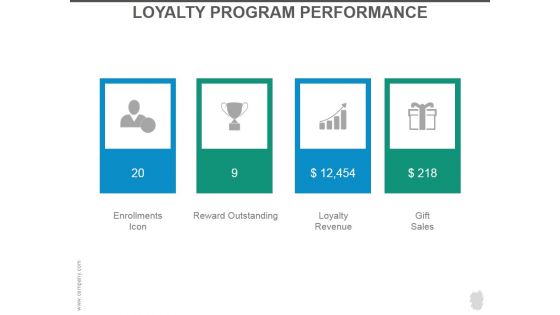
Loyalty Program Performance Ppt PowerPoint Presentation Slides
This is a loyalty program performance ppt powerpoint presentation slides. This is a four stage process. The stages in this process are enrollments icon, reward outstanding, loyalty revenue, gift sales.
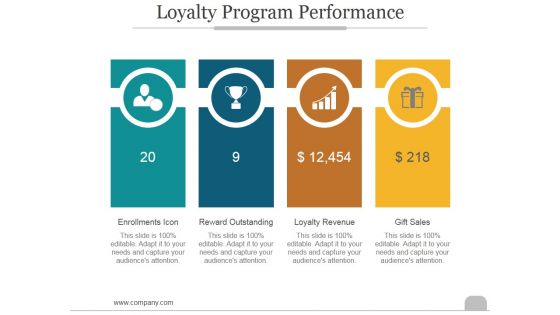
Loyalty Program Performance Ppt PowerPoint Presentation Introduction
This is a loyalty program performance ppt powerpoint presentation introduction. This is a four stage process. The stages in this process are enrollments icon, reward outstanding, loyalty revenue, gift sales.
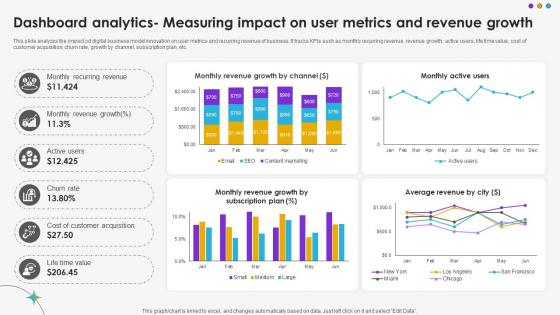
Dashboard Analytics Measuring Impact On User Metrics And Revenue Growth DT SS V
This slide analyzes the impact od digital business model innovation on user metrics and recurring revenue of business. It tracks KPIs such as monthly recurring revenue, revenue growth, active users, life time value, cost of customer acquisition, churn rate, growth by channel, subscription plan, etc.Are you searching for a Dashboard Analytics Measuring Impact On User Metrics And Revenue Growth DT SS V that is uncluttered, straightforward, and original Its easy to edit, and you can change the colors to suit your personal or business branding. For a presentation that expresses how much effort you have put in, this template is ideal With all of its features, including tables, diagrams, statistics, and lists, its perfect for a business plan presentation. Make your ideas more appealing with these professional slides. Download Dashboard Analytics Measuring Impact On User Metrics And Revenue Growth DT SS V from Slidegeeks today. This slide analyzes the impact od digital business model innovation on user metrics and recurring revenue of business. It tracks KPIs such as monthly recurring revenue, revenue growth, active users, life time value, cost of customer acquisition, churn rate, growth by channel, subscription plan, etc.
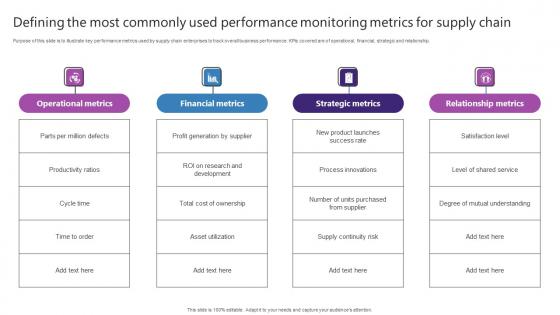
Defining The Most Commonly Used Performance Strategic Plan For Enhancing Elements Pdf
Purpose of this slide is to illustrate key performance metrics used by supply chain enterprises to track overall business performance. KPIs covered are of operational, financial, strategic and relationship. If your project calls for a presentation, then Slidegeeks is your go-to partner because we have professionally designed, easy-to-edit templates that are perfect for any presentation. After downloading, you can easily edit Defining The Most Commonly Used Performance Strategic Plan For Enhancing Elements Pdf and make the changes accordingly. You can rearrange slides or fill them with different images. Check out all the handy templates Purpose of this slide is to illustrate key performance metrics used by supply chain enterprises to track overall business performance. KPIs covered are of operational, financial, strategic and relationship.
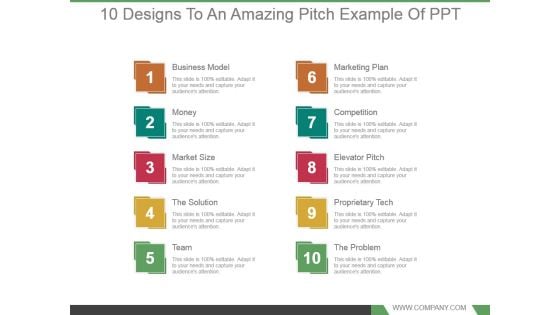
10 Designs To An Amazing Pitch Example Of Ppt
This is a 10 designs to an amazing pitch example of ppt. This is a ten stage process. The stages in this process are business model, money, market size, the solution, team, marketing plan, competition, elevator pitch, proprietary tech, the problem.
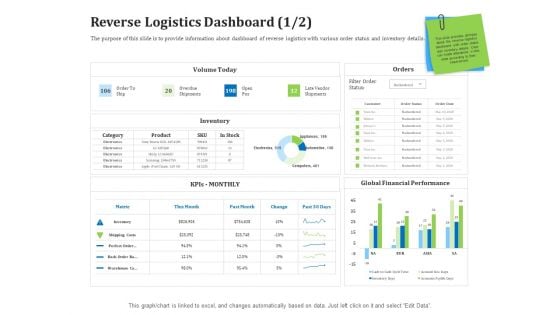
Reverse Logistics Management Reverse Logistics Dashboard Days Ppt Infographics Files PDF
The purpose of this slide is to provide information about dashboard of reverse logistics with various order status and inventory details. Deliver an awe inspiring pitch with this creative reverse logistics management reverse logistics dashboard days ppt infographics files pdf bundle. Topics like global, financial, performance, metric, inventory can be discussed with this completely editable template. It is available for immediate download depending on the needs and requirements of the user.
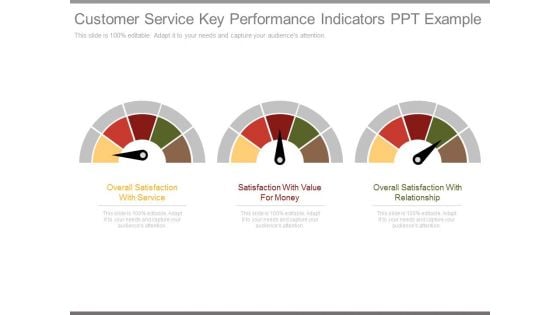
Customer Service Key Performance Indicators Ppt Example
This is a customer service key performance indicators ppt example. This is a three stage process. The stages in this process are overall satisfaction with service, satisfaction with value for money, overall satisfaction with relationship.

Performance Metrics E Scooter Business Market Entry Strategy
The following slide outlines various KPIs to track and measure cleantech startups operational performance. The metrics are scooter utilization rate, rider satisfaction score, revenue per scooter, etc.Crafting an eye-catching presentation has never been more straightforward. Let your presentation shine with this tasteful yet straightforward Performance Metrics E Scooter Business Market Entry Strategy template. It offers a minimalistic and classy look that is great for making a statement. The colors have been employed intelligently to add a bit of playfulness while still remaining professional. Construct the ideal Performance Metrics E Scooter Business Market Entry Strategy that effortlessly grabs the attention of your audience Begin now and be certain to wow your customers The following slide outlines various KPIs to track and measure cleantech startups operational performance. The metrics are scooter utilization rate, rider satisfaction score, revenue per scooter, etc.

Performance Metrics Digital Physical Training Business Market Entry Plan GTM SS V
The following slide outlines various KPIs to track and measure business operational performance The metrics are conversion rate, churn rate, retention rate, engagement rate, social media reach and engagement and average session durationMake sure to capture your audiences attention in your business displays with our gratis customizable Performance Metrics Digital Physical Training Business Market Entry Plan GTM SS V. These are great for business strategies, office conferences, capital raising or task suggestions. If you desire to acquire more customers for your tech business and ensure they stay satisfied, create your own sales presentation with these plain slides. The following slide outlines various KPIs to track and measure business operational performance The metrics are conversion rate, churn rate, retention rate, engagement rate, social media reach and engagement and average session duration.
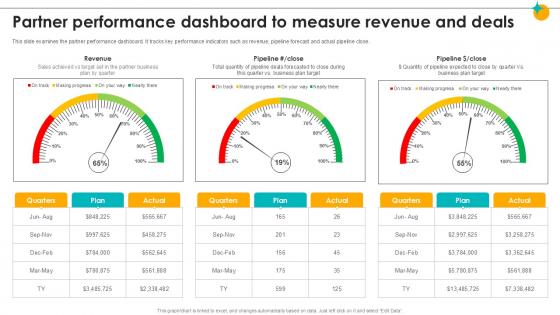
Partner Performance Dashboard To Measure Revenue Partner Relationship Ppt Template
This slide examines the partner performance dashboard. It tracks key performance indicators such as revenue, pipeline forecast and actual pipeline close. Are you in need of a template that can accommodate all of your creative concepts This one is crafted professionally and can be altered to fit any style. Use it with Google Slides or PowerPoint. Include striking photographs, symbols, depictions, and other visuals. Fill, move around, or remove text boxes as desired. Test out color palettes and font mixtures. Edit and save your work, or work with colleagues. Download Partner Performance Dashboard To Measure Revenue Partner Relationship Ppt Template and observe how to make your presentation outstanding. Give an impeccable presentation to your group and make your presentation unforgettable. This slide examines the partner performance dashboard. It tracks key performance indicators such as revenue, pipeline forecast and actual pipeline close.
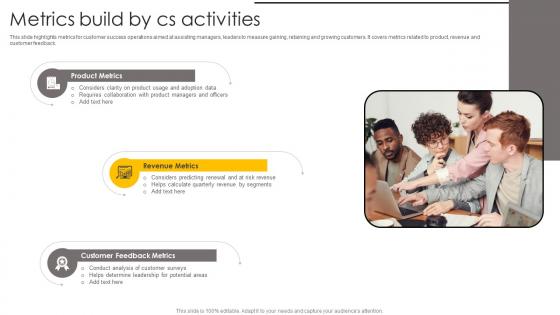
Metrics Build By Cs Activities Pictures Pdf
This slide highlights metrics for customer success operations aimed at assisting managers, leaders to measure gaining, retaining and growing customers. It covers metrics related to product, revenue and customer feedback. Showcasing this set of slides titled Metrics Build By Cs Activities Pictures Pdf. The topics addressed in these templates are Product Metrics, Revenue Metrics, Feedback Metrics. All the content presented in this PPT design is completely editable. Download it and make adjustments in color, background, font etc. as per your unique business setting. This slide highlights metrics for customer success operations aimed at assisting managers, leaders to measure gaining, retaining and growing customers. It covers metrics related to product, revenue and customer feedback.
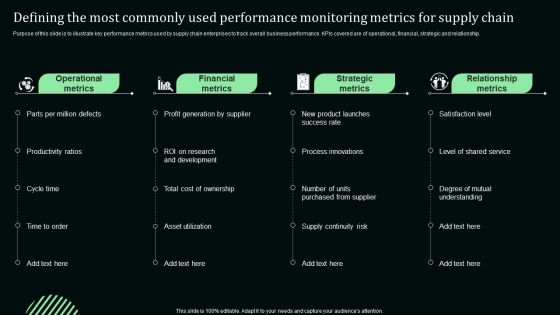
Defining The Most Commonly Used Performance Monitoring Metrics For Supply Chain Microsoft PDF
Purpose of this slide is to illustrate key performance metrics used by supply chain enterprises to track overall business performance. KPIs covered are of operational, financial, strategic and relationship.Crafting an eye-catching presentation has never been more straightforward. Let your presentation shine with this tasteful yet straightforward Defining The Most Commonly Used Performance Monitoring Metrics For Supply Chain Microsoft PDF template. It offers a minimalistic and classy look that is great for making a statement. The colors have been employed intelligently to add a bit of playfulness while still remaining professional. Construct the ideal Defining The Most Commonly Used Performance Monitoring Metrics For Supply Chain Microsoft PDF that effortlessly grabs the attention of your audience Begin now and be certain to wow your customers
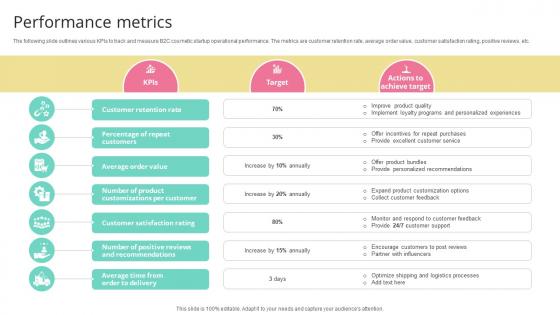
Performance Metrics Skincare Startup GTM Strategy GTM SS V
The following slide outlines various KPIs to track and measure B2C cosmetic startup operational performance. The metrics are customer retention rate, average order value, customer satisfaction rating, positive reviews, etc.Make sure to capture your audiences attention in your business displays with our gratis customizable Performance Metrics Skincare Startup GTM Strategy GTM SS V. These are great for business strategies, office conferences, capital raising or task suggestions. If you desire to acquire more customers for your tech business and ensure they stay satisfied, create your own sales presentation with these plain slides. The following slide outlines various KPIs to track and measure B2C cosmetic startup operational performance. The metrics are customer retention rate, average order value, customer satisfaction rating, positive reviews, etc.
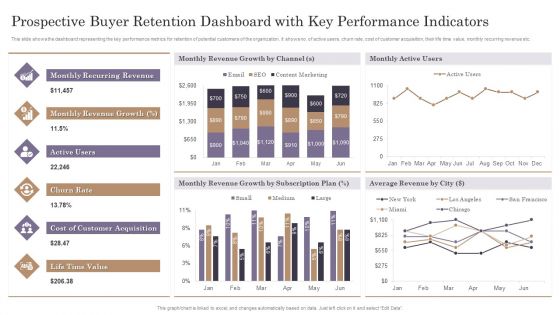
Prospective Buyer Retention Dashboard With Key Performance Indicators Themes PDF
This slide shows the dashboard representing the key performance metrics for retention of potential customers of the organization. It shows no. of active users, churn rate, cost of customer acquisition, their life time value, monthly recurring revenue etc.Pitch your topic with ease and precision using this Prospective Buyer Retention Dashboard With Key Performance Indicators Themes PDF. This layout presents information on Recurring Revenue, Revenue Growth, Customer Acquisition. It is also available for immediate download and adjustment. So, changes can be made in the color, design, graphics or any other component to create a unique layout.
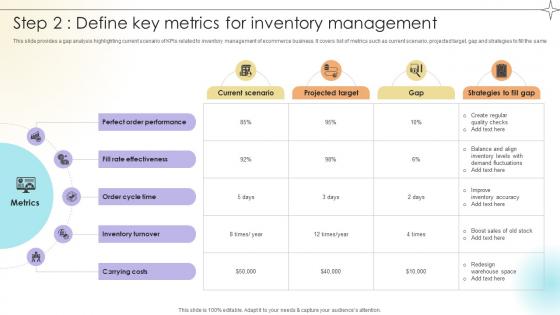
Step 2 Define Key Metrics For Inventory Management Data Analytics SS V
This slide provides a gap analysis highlighting current scenario of KPIs related to inventory management of ecommerce business. It covers list of metrics such as current scenario, projected target, gap and strategies to fill the same.Make sure to capture your audiences attention in your business displays with our gratis customizable Step 2 Define Key Metrics For Inventory Management Data Analytics SS V. These are great for business strategies, office conferences, capital raising or task suggestions. If you desire to acquire more customers for your tech business and ensure they stay satisfied, create your own sales presentation with these plain slides. This slide provides a gap analysis highlighting current scenario of KPIs related to inventory management of ecommerce business. It covers list of metrics such as current scenario, projected target, gap and strategies to fill the same.
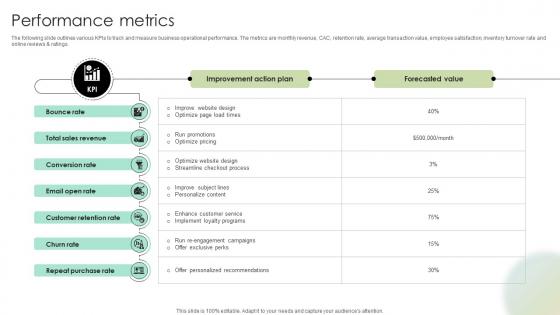
Performance Metrics Digital Fashion Brand Portal Market Entry Plan GTM SS V
The following slide outlines various KPIs to track and measure business operational performance. The metrics are monthly revenue, CAC, retention rate, average transaction value, employee satisfaction, inventory turnover rate and online reviews and ratings.Crafting an eye-catching presentation has never been more straightforward. Let your presentation shine with this tasteful yet straightforward Performance Metrics Digital Fashion Brand Portal Market Entry Plan GTM SS V template. It offers a minimalistic and classy look that is great for making a statement. The colors have been employed intelligently to add a bit of playfulness while still remaining professional. Construct the ideal Performance Metrics Digital Fashion Brand Portal Market Entry Plan GTM SS V that effortlessly grabs the attention of your audience Begin now and be certain to wow your customers The following slide outlines various KPIs to track and measure business operational performance. The metrics are monthly revenue, CAC, retention rate, average transaction value, employee satisfaction, inventory turnover rate and online reviews and ratings.
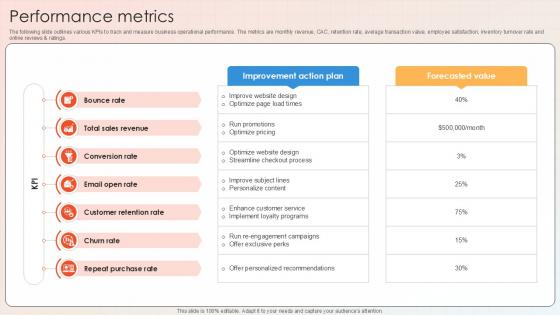
Performance Metrics Apparel And Shoes E Commerce Market PPT Slide GTM SS V
The following slide outlines various KPIs to track and measure business operational performance. The metrics are monthly revenue, CAC, retention rate, average transaction value, employee satisfaction, inventory turnover rate and online reviews and ratings. Crafting an eye-catching presentation has never been more straightforward. Let your presentation shine with this tasteful yet straightforward Performance Metrics Apparel And Shoes E Commerce Market PPT Slide GTM SS V template. It offers a minimalistic and classy look that is great for making a statement. The colors have been employed intelligently to add a bit of playfulness while still remaining professional. Construct the ideal Performance Metrics Apparel And Shoes E Commerce Market PPT Slide GTM SS V that effortlessly grabs the attention of your audience Begin now and be certain to wow your customers The following slide outlines various KPIs to track and measure business operational performance. The metrics are monthly revenue, CAC, retention rate, average transaction value, employee satisfaction, inventory turnover rate and online reviews and ratings.
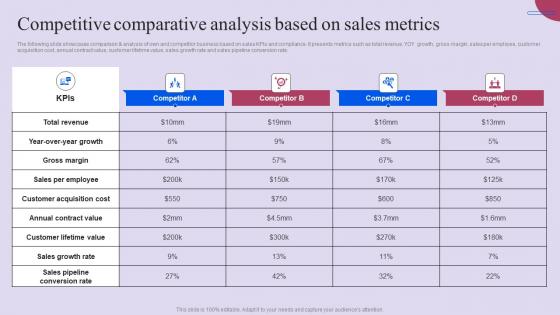
Competitive Comparative Analysis Based On Sales Metrics Ppt File Designs Pdf
The following slide showcases comparison and analysis of own and competitor business based on sales KPIs and compliance. It presents metrics such as total revenue, YOY growth, gross margin, sales per employee, customer acquisition cost, annual contract value, customer lifetime value, sales growth rate and sales pipeline conversion rate. There are so many reasons you need a Competitive Comparative Analysis Based On Sales Metrics Ppt File Designs Pdf. The first reason is you can not spend time making everything from scratch, Thus, Slidegeeks has made presentation templates for you too. You can easily download these templates from our website easily. The following slide showcases comparison and analysis of own and competitor business based on sales KPIs and compliance. It presents metrics such as total revenue, YOY growth, gross margin, sales per employee, customer acquisition cost, annual contract value, customer lifetime value, sales growth rate and sales pipeline conversion rate.

Performance Metrics Information Technology Startup Go To Market Strategy GTM SS V
The following slide outlines various KPIs to track and measure IT startup operational performance. The metrics are response time, user satisfaction, error rate, time to resolution, capacity utilization, etc.Make sure to capture your audiences attention in your business displays with our gratis customizable Performance Metrics Information Technology Startup Go To Market Strategy GTM SS V. These are great for business strategies, office conferences, capital raising or task suggestions. If you desire to acquire more customers for your tech business and ensure they stay satisfied, create your own sales presentation with these plain slides. The following slide outlines various KPIs to track and measure IT startup operational performance. The metrics are response time, user satisfaction, error rate, time to resolution, capacity utilization, etc.
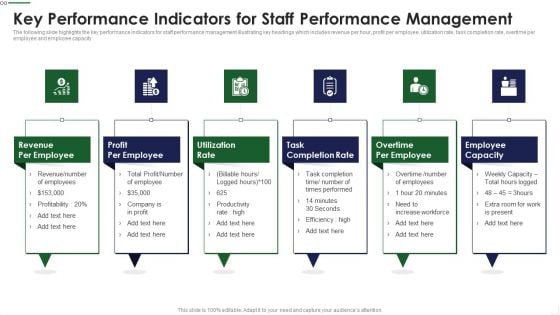
Key Performance Indicators For Staff Performance Management Clipart PDF
The following slide highlights the key performance Indicators for staff performance management illustrating key headings which includes revenue per hour, profit per employee, utilization rate, task completion rate, overtime per employee and employee capacity Persuade your audience using this Key Performance Indicators For Staff Growth Topics PDF This PPT design covers six stages, thus making it a great tool to use. It also caters to a variety of topics including Revenue Employee, Profit Employee, Task Completion Download this PPT design now to present a convincing pitch that not only emphasizes the topic but also showcases your presentation skills.
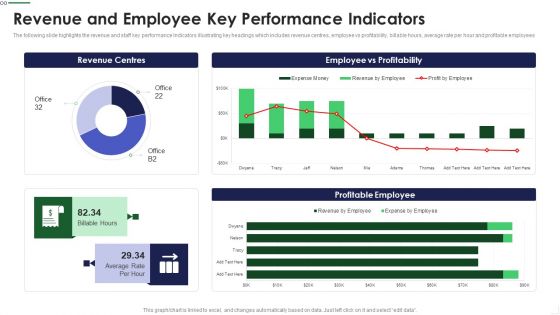
Revenue And Employee Key Performance Indicators Background PDF
The following slide highlights the revenue and staff key performance Indicators illustrating key headings which includes revenue centres, employee vs profitability, billable hours, average rate per hour and profitable employees Deliver an awe inspiring pitch with this creative Revenue And Employee Key Performance Indicators Background PDF bundle. Topics like Revenue Centres, Employee Profitability, Profitable Employee can be discussed with this completely editable template. It is available for immediate download depending on the needs and requirements of the user.
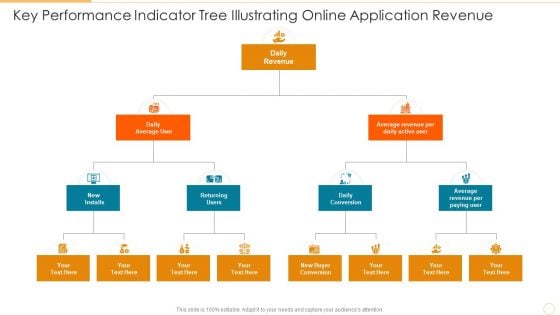
Key Performance Indicator Tree Illustrating Online Application Revenue Download PDF
Presenting key performance indicator tree illustrating online application revenue download pdf to dispense important information. This template comprises three stages. It also presents valuable insights into the topics including daily conversion, returning users, daily revenue. This is a completely customizable PowerPoint theme that can be put to use immediately. So, download it and address the topic impactfully.

Various Metrics To Analyze Business Project Evaluation Inspiration PDF
This slide signifies the various key performance indicator or metrics to evaluate project investment. It covers information about metrics like net present value, discount cash flow, expected commercial value and weighted average cost of capital. Pitch your topic with ease and precision using this Various Metrics To Analyze Business Project Evaluation Inspiration PDF. This layout presents information on KPI, Metrics, Key Description, Expected, Actual, Variance. It is also available for immediate download and adjustment. So, changes can be made in the color, design, graphics or any other component to create a unique layout.
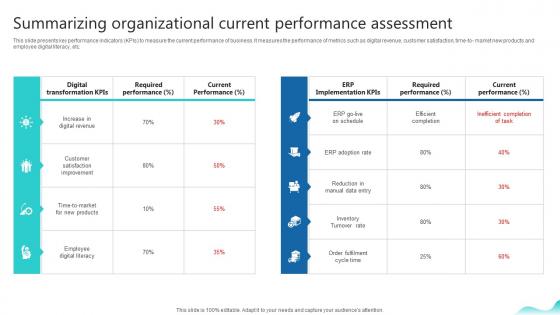
Summarizing Organizational Current Performance Erp And Digital Transformation For Maximizing DT SS V
This slide presents key performance indicators KPIs to measure the current performance of business. It measures the performance of metrics such as digital revenue, customer satisfaction, time-to- market new products and employee digital literacy, etc. Boost your pitch with our creative Summarizing Organizational Current Performance Erp And Digital Transformation For Maximizing DT SS V. Deliver an awe-inspiring pitch that will mesmerize everyone. Using these presentation templates you will surely catch everyones attention. You can browse the ppts collection on our website. We have researchers who are experts at creating the right content for the templates. So you do not have to invest time in any additional work. Just grab the template now and use them. This slide presents key performance indicators KPIs to measure the current performance of business. It measures the performance of metrics such as digital revenue, customer satisfaction, time-to- market new products and employee digital literacy, etc.


 Continue with Email

 Home
Home


