Financial Kpis
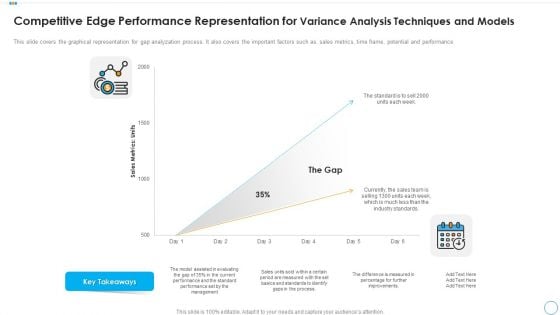
Competitive Edge Performance Representation For Variance Analysis Techniques And Models Ideas PDF
This slide covers the graphical representation for gap analyzation process. It also covers the important factors such as, sales metrics, time frame, potential and performance. Showcasing this set of slides titled competitive edge performance representation for variance analysis techniques and models ideas pdf. The topics addressed in these templates are competitive edge performance representation for variance analysis techniques and models. All the content presented in this PPT design is completely editable. Download it and make adjustments in color, background, font etc. as per your unique business setting.
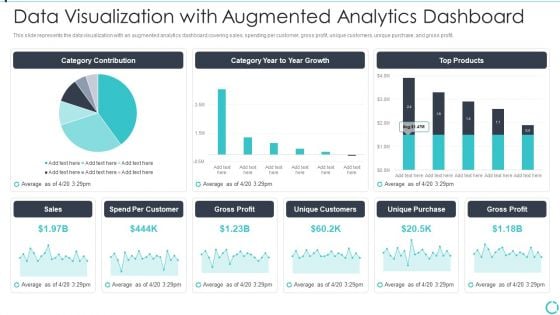
Augmented Analytics Implementation IT Data Visualization With Augmented Analytics Microsoft PDF
This slide represents the data visualization with an augmented analytics dashboard covering sales, spending per customer, gross profit, unique customers, unique purchase, and gross profit. Deliver an awe inspiring pitch with this creative Augmented Analytics Implementation IT Data Visualization With Augmented Analytics Microsoft PDF bundle. Topics like Category Contribution, Category Year To Year Growth, Top Products, Sales, Gross Profit can be discussed with this completely editable template. It is available for immediate download depending on the needs and requirements of the user.

Implementing Client Onboarding Process Consumer Adoption Challenges Faced By Organization Graphics PDF
This slide provides glimpse about problems faced by our organization that can provide metrics to target and develop strategies to increase our customer base. It includes issues such as customer churn rate, customer adoption rate, etc. Slidegeeks is here to make your presentations a breeze with Implementing Client Onboarding Process Consumer Adoption Challenges Faced By Organization Graphics PDF With our easy to use and customizable templates, you can focus on delivering your ideas rather than worrying about formatting. With a variety of designs to choose from, you are sure to find one that suits your needs. And with animations and unique photos, illustrations, and fonts, you can make your presentation pop. So whether you are giving a sales pitch or presenting to the board, make sure to check out Slidegeeks first.
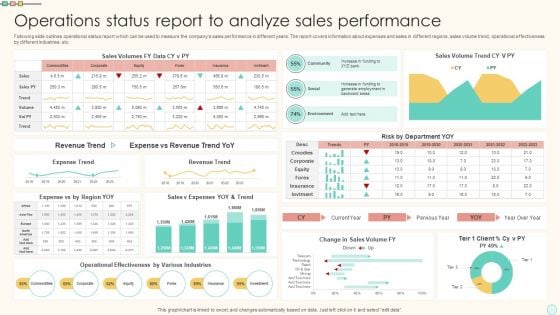
Operations Status Report To Analyze Sales Performance Portrait PDF
Following slide outlines operational status report which can be used to measure the companys sales performance in different years. The report covers information about expenses and sales in different regions, sales volume trend, operational effectiveness by different industries, etc. Showcasing this set of slides titled Operations Status Report To Analyze Sales Performance Portrait PDF. The topics addressed in these templates are Operations Status Report, Analyze Sales Performance. All the content presented in this PPT design is completely editable. Download it and make adjustments in color, background, font etc. as per your unique business setting.
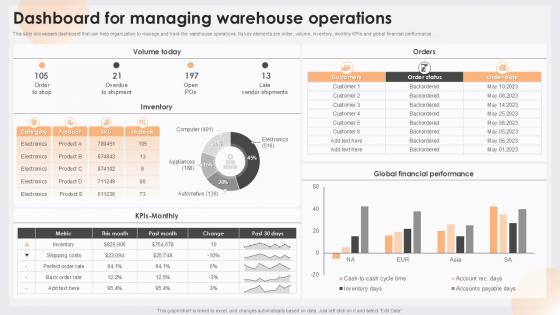
Dashboard For Managing Warehouse Determining Ideal Quantity To Procure Inventor
The best PPT templates are a great way to save time, energy, and resources. Slidegeeks have 100 percent editable powerpoint slides making them incredibly versatile. With these quality presentation templates, you can create a captivating and memorable presentation by combining visually appealing slides and effectively communicating your message. Download Dashboard For Managing Warehouse Determining Ideal Quantity To Procure Inventor from Slidegeeks and deliver a wonderful presentation. This slide depicts a dashboard for managing and tracking warehouse operations. It includes key elements such as order, volume, inventory, monthly KPIs, and global financial performance
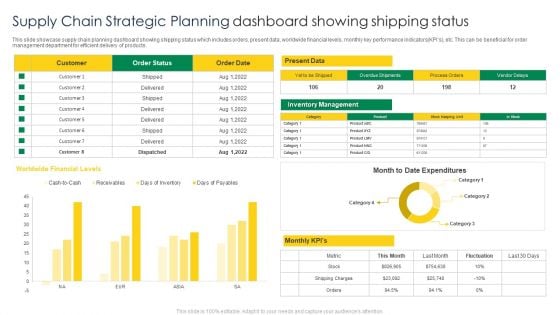
Supply Chain Strategic Planning Dashboard Showing Shipping Status Structure PDF
This slide showcase supply chain planning dashboard showing shipping status which includes orders, present data, worldwide financial levels, monthly key performance indicators KPIs, etc. This can be beneficial for order management department for efficient delivery of products. Showcasing this set of slides titled Supply Chain Strategic Planning Dashboard Showing Shipping Status Structure PDF. The topics addressed in these templates are Worldwide Financial Levels, Present Data, Customer. All the content presented in this PPT design is completely editable. Download it and make adjustments in color, background, font etc. as per your unique business setting.
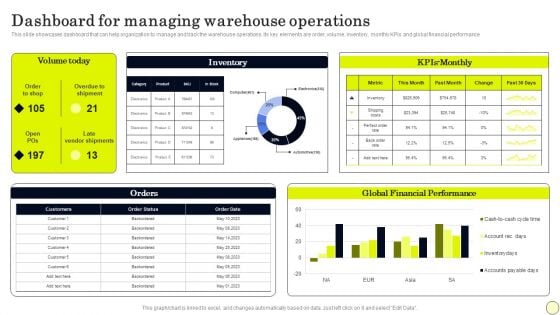
Dashboard For Managing Warehouse Operations Diagrams PDF
This slide showcases dashboard that can help organization to manage and track the warehouse operations. Its key elements are order, volume, inventory, monthly KPIs and global financial performance. Presenting this PowerPoint presentation, titled Dashboard For Managing Warehouse Operations Diagrams PDF, with topics curated by our researchers after extensive research. This editable presentation is available for immediate download and provides attractive features when used. Download now and captivate your audience. Presenting this Dashboard For Managing Warehouse Operations Diagrams PDF. Our researchers have carefully researched and created these slides with all aspects taken into consideration. This is a completely customizable Dashboard For Managing Warehouse Operations Diagrams PDF that is available for immediate downloading. Download now and make an impact on your audience. Highlight the attractive features available with our PPTs.
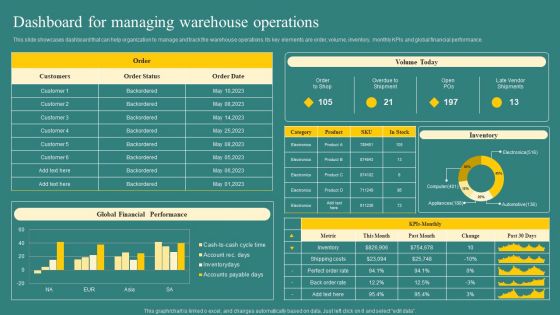
Dashboard For Managing Warehouse Operations Mockup PDF
This slide showcases dashboard that can help organization to manage and track the warehouse operations. Its key elements are order, volume, inventory, monthly KPIs and global financial performance. Here you can discover an assortment of the finest PowerPoint and Google Slides templates. With these templates, you can create presentations for a variety of purposes while simultaneously providing your audience with an eye catching visual experience. Download Dashboard For Managing Warehouse Operations Mockup PDF to deliver an impeccable presentation. These templates will make your job of preparing presentations much quicker, yet still, maintain a high level of quality. Slidegeeks has experienced researchers who prepare these templates and write high quality content for you. Later on, you can personalize the content by editing the Dashboard For Managing Warehouse Operations Mockup PDF.
Stock Inventory Acquisition Dashboard For Managing Warehouse Operations Icons PDF
This slide showcases dashboard that can help organization to manage and track the warehouse operations. Its key elements are order, volume, inventory, monthly KPIs and global financial performance. Explore a selection of the finest Stock Inventory Acquisition Dashboard For Managing Warehouse Operations Icons PDF here. With a plethora of professionally designed and pre-made slide templates, you can quickly and easily find the right one for your upcoming presentation. You can use our Stock Inventory Acquisition Dashboard For Managing Warehouse Operations Icons PDF to effectively convey your message to a wider audience. Slidegeeks has done a lot of research before preparing these presentation templates. The content can be personalized and the slides are highly editable. Grab templates today from Slidegeeks.
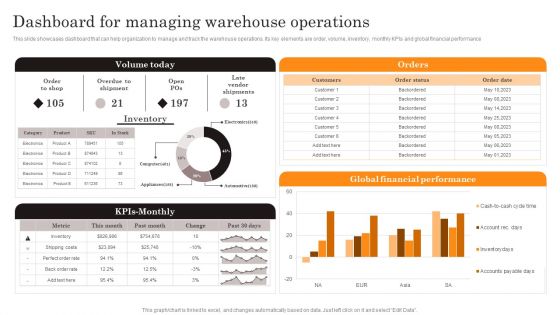
Procurement Strategies For Reducing Stock Wastage Dashboard For Managing Warehouse Infographics PDF
This slide showcases dashboard that can help organization to manage and track the warehouse operations. Its key elements are order, volume, inventory, monthly KPIs and global financial performance. Here you can discover an assortment of the finest PowerPoint and Google Slides templates. With these templates, you can create presentations for a variety of purposes while simultaneously providing your audience with an eye catching visual experience. Download Procurement Strategies For Reducing Stock Wastage Dashboard For Managing Warehouse Infographics PDF to deliver an impeccable presentation. These templates will make your job of preparing presentations much quicker, yet still, maintain a high level of quality. Slidegeeks has experienced researchers who prepare these templates and write high quality content for you. Later on, you can personalize the content by editing the Procurement Strategies For Reducing Stock Wastage Dashboard For Managing Warehouse Infographics PDF.
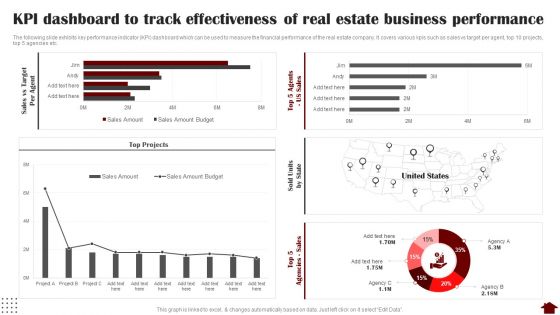
KPI Dashboard To Track Effectiveness Of Real Estate Business Performance Slides PDF
The following slide exhibits key performance indicator KPI dashboard which can be used to measure the financial performance of the real estate company. It covers various kpis such as sales vs target per agent, top 10 projects, top 5 agencies etc. Deliver an awe inspiring pitch with this creative KPI Dashboard To Track Effectiveness Of Real Estate Business Performance Slides PDF bundle. Topics like KPI Dashboard, Track Effectiveness, Real Estate Business Performance can be discussed with this completely editable template. It is available for immediate download depending on the needs and requirements of the user.
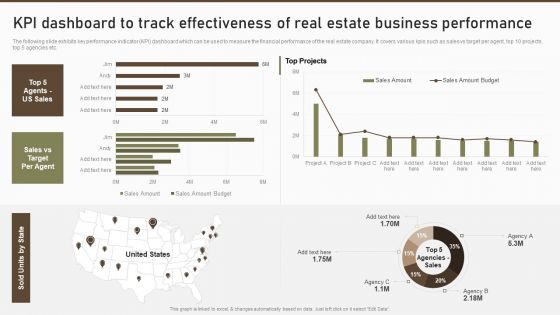
KPI Dashboard To Track Effectiveness Of Real Estate Business Performance Guidelines PDF
The following slide exhibits key performance indicator KPI dashboard which can be used to measure the financial performance of the real estate company. It covers various kpis such as sales vs target per agent, top 10 projects, top 5 agencies etc.Deliver an awe inspiring pitch with this creative KPI Dashboard To Track Effectiveness Of Real Estate Business Performance Guidelines PDF bundle. Topics like Top Projects, Sales Amount, Sales Amount can be discussed with this completely editable template. It is available for immediate download depending on the needs and requirements of the user.
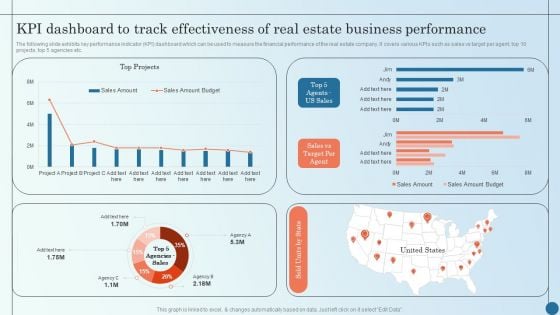
KPI Dashboard To Track Effectiveness Of Real Estate Business Managing Commercial Property Risks Demonstration PDF
The following slide exhibits key performance indicator KPI dashboard which can be used to measure the financial performance of the real estate company. It covers various KPIs such as sales vs target per agent, top 10 projects, top 5 agencies etc.Deliver an awe inspiring pitch with this creative KPI Dashboard To Track Effectiveness Of Real Estate Business Managing Commercial Property Risks Demonstration PDF bundle. Topics like Kpi Dashboard, Track Effectiveness, Estate Business can be discussed with this completely editable template. It is available for immediate download depending on the needs and requirements of the user.
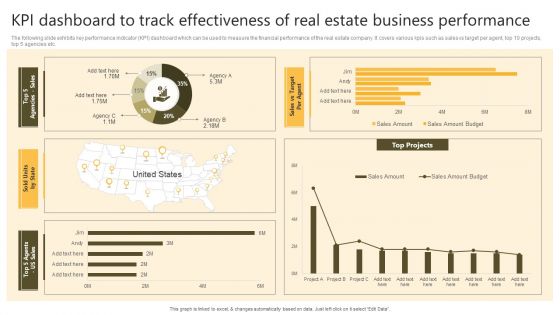
Successful Risk Administration KPI Dashboard To Track Effectiveness Of Real Estate Business Template PDF
The following slide exhibits key performance indicator KPI dashboard which can be used to measure the financial performance of the real estate company. It covers various kpis such as sales vs target per agent, top 10 projects, top 5 agencies etc. If your project calls for a presentation, then Slidegeeks is your go-to partner because we have professionally designed, easy-to-edit templates that are perfect for any presentation. After downloading, you can easily edit Successful Risk Administration KPI Dashboard To Track Effectiveness Of Real Estate Business Template PDF and make the changes accordingly. You can rearrange slides or fill them with different images. Check out all the handy templates.
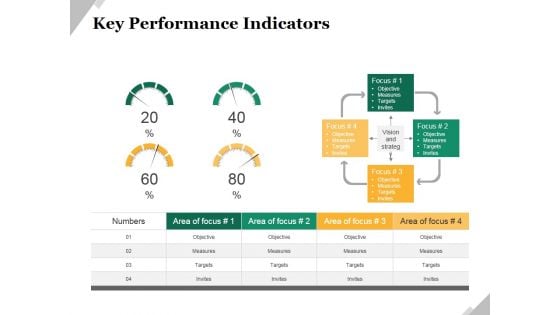
Key Performance Indicators Template 2 Ppt PowerPoint Presentation Model Example
This is a key performance indicators template 2 ppt powerpoint presentation model example. This is a four stage process. The stages in this process are objective, measures, targets, invites, indicators.

Key Performance Indicators Template 2 Ppt PowerPoint Presentation Layouts Portfolio
This is a key performance indicators template 2 ppt powerpoint presentation layouts portfolio. This is a four stage process. The stages in this process are objective, measures, targets, invites.

Crm Dashboard Current Lead Status Ppt PowerPoint Presentation Guide
This is a crm dashboard current lead status ppt powerpoint presentation guide. This is a six stage process. The stages in this process are business, marketing, success, presentation, financial.
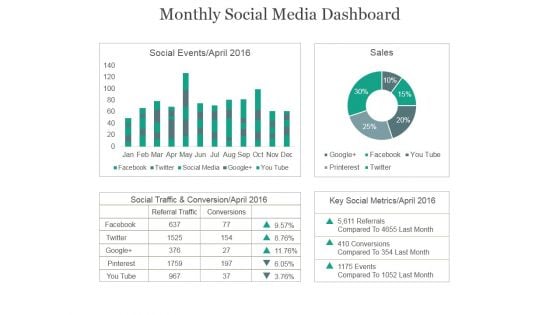
Monthly Social Media Dashboard Ppt PowerPoint Presentation Example 2015
This is a monthly social media dashboard ppt powerpoint presentation example 2015. This is a four stage process. The stages in this process are social events, sales, social traffic, conservation, key social metrics.
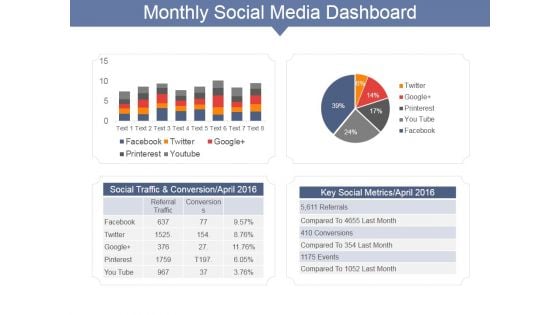
Monthly Social Media Dashboard Ppt PowerPoint Presentation Gallery Show
This is a monthly social media dashboard ppt powerpoint presentation gallery show. This is a two stage process. The stages in this process are social traffic and conversion april, key social metrics april, facebook, twitter.
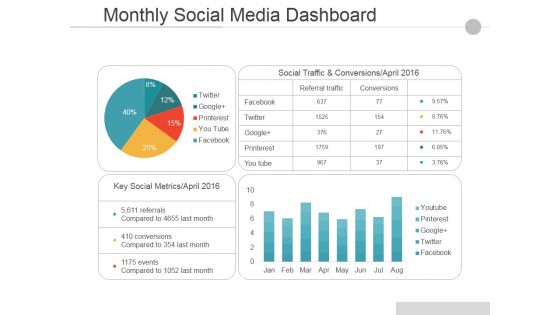
Monthly Social Media Dashboard Ppt PowerPoint Presentation Pictures Guide
This is a monthly social media dashboard ppt powerpoint presentation pictures guide. This is a two stage process. The stages in this process are social traffic and conversions april, key social metrics april, facebook, twitter, google.
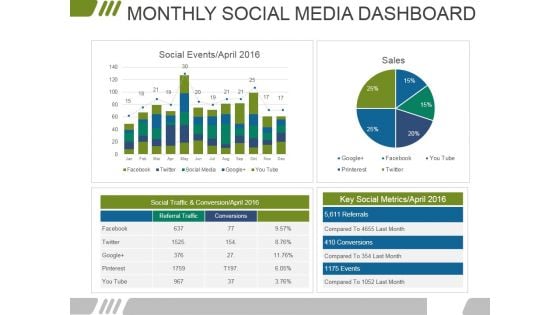
Monthly Social Media Dashboard Ppt PowerPoint Presentation Infographics Files
This is a monthly social media dashboard ppt powerpoint presentation infographics files. This is a four stage process. The stages in this process are marketing, business, financial, data analysis, management.
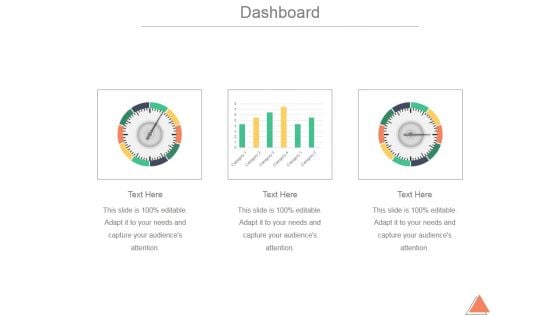
Dashboard Ppt PowerPoint Presentation Infographics
This is a dashboard ppt powerpoint presentation infographics. This is a three stage process. The stages in this process are business, marketing, dashboard, analysis, finance.
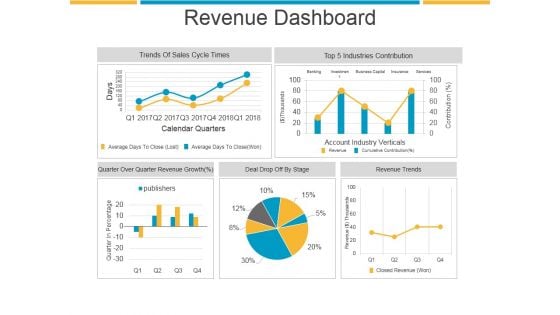
Revenue Dashboard Ppt PowerPoint Presentation Sample
This is a revenue dashboard ppt powerpoint presentation sample. This is a five stage process. The stages in this process are trends of sales cycle times, industries contribution, revenue trends, deal drop off by stage.
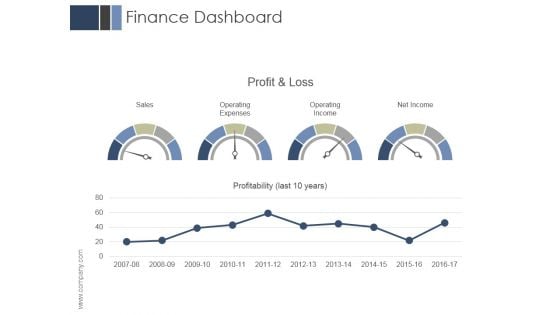
Finance Dashboard Ppt PowerPoint Presentation Design Ideas
This is a finance dashboard ppt powerpoint presentation design ideas. This is a two stage process. The stages in this process are sales, operating expenses, operating income, net income.
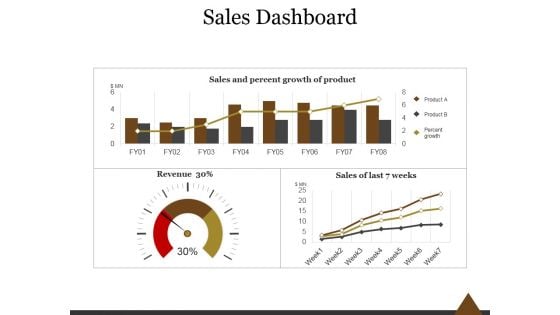
Sales Dashboard Template 1 Ppt PowerPoint Presentation Layouts
This is a sales dashboard template 1 ppt powerpoint presentation layouts. This is a three stage process. The stages in this process are sales and percent growth of product, sales of last weeks, percent growth.
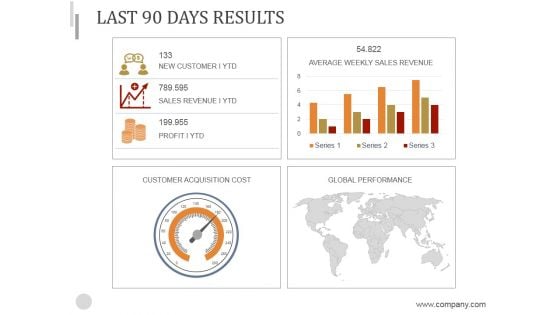
Last 90 Days Results Ppt PowerPoint Presentation Background Image
This is a last 90 days results ppt powerpoint presentation background image. This is a four stage process. The stages in this process are customer acquisition cost, global performance, average weekly sales revenue.
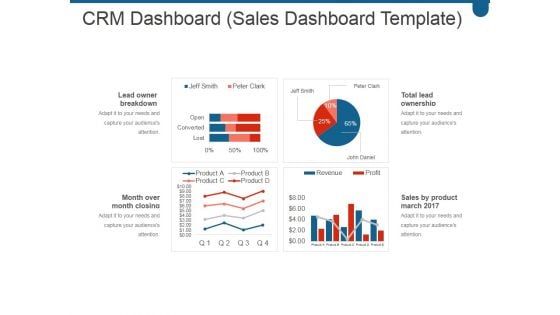
Crm Dashboard Sales Dashboard Template Ppt PowerPoint Presentation Microsoft
This is a crm dashboard sales dashboard template ppt powerpoint presentation microsoft. This is a four stage process. The stages in this process are lead owner breakdown, month over month closing trend, total lead ownership, sales by product march 2017.
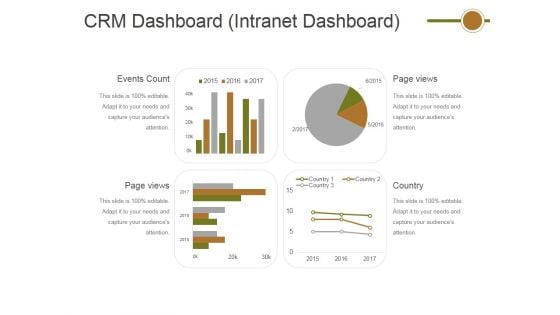
Crm Dashboard Intranet Dashboard Ppt PowerPoint Presentation Outline Professional
This is a crm dashboard intranet dashboard ppt powerpoint presentation outline professional. This is a four stage process. The stages in this process are events count, page views, page views, country.

Measurement Of Portfolio Analysis Ppt PowerPoint Presentation Ideas
This is a measurement of portfolio analysis ppt powerpoint presentation ideas. This is a four stage process. The stages in this process are your current portfolio, holding, current weight, current value.
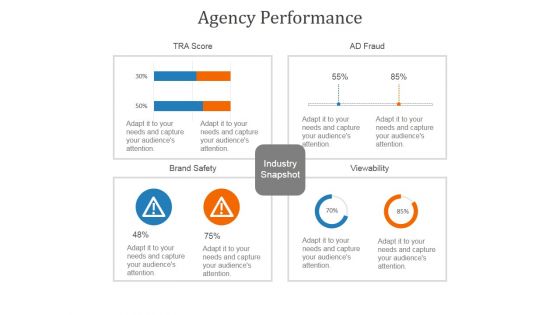
Agency Performance Template 2 Ppt PowerPoint Presentation Background Images
This is a agency performance template 2 ppt powerpoint presentation background images. This is a four stage process. The stages in this process are brand safety, viewability, industry snapshot.
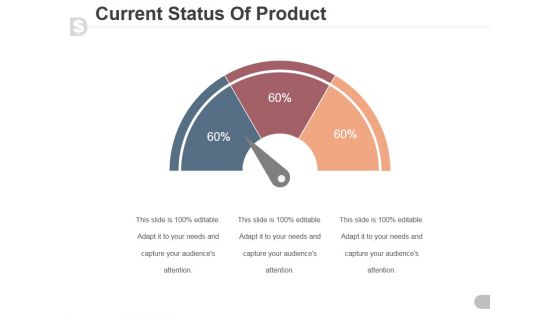
Current Status Of Product Ppt PowerPoint Presentation Designs Download
This is a current status of product ppt powerpoint presentation designs download. This is a three stage process. The stages in this process are speedometer, dashboard, business, marketing, finance.
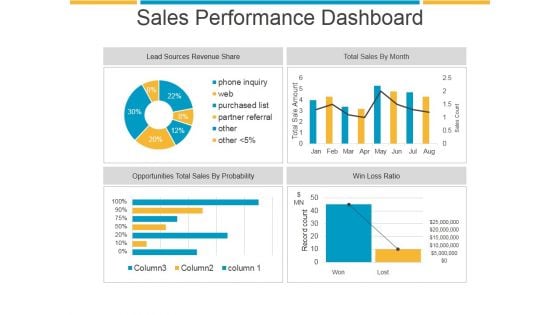
Sales Performance Dashboard Ppt PowerPoint Presentation Show
This is a sales performance dashboard ppt powerpoint presentation show. This is a four stage process. The stages in this process are lead sources revenue share, total sales by month, opportunities total sales by probability, win loss ratio.
Website Performance Review Ppt PowerPoint Presentation Icon Deck
This is a website performance review ppt powerpoint presentation icon deck. This is a three stage process. The stages in this process are conversion rate, average visit value goal, visits.
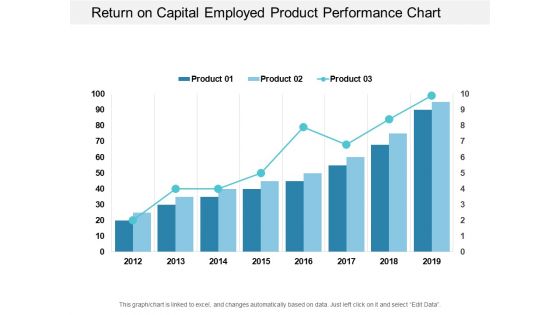
Return On Capital Employed Product Performance Chart Ppt PowerPoint Presentation Portfolio Visuals
This is a return on capital employed product performance chart ppt powerpoint presentation portfolio visuals. This is a three stage process. The stages in this process are accounting ratio, roce, return on capital employed.
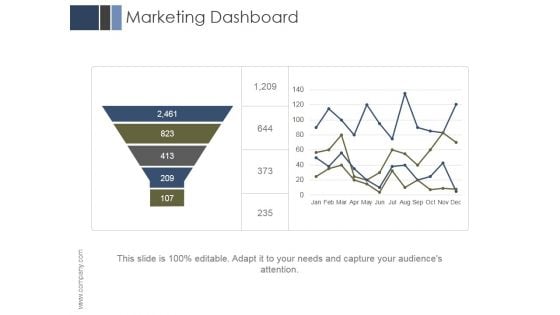
Marketing Dashboard Ppt PowerPoint Presentation Templates
This is a marketing dashboard ppt powerpoint presentation templates. This is a two stage process. The stages in this process are business, marketing, management, finance, dashboard.
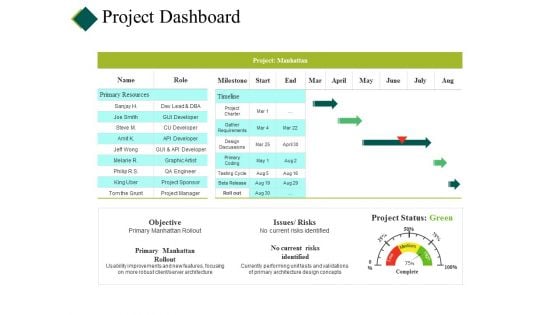
Project Dashboard Ppt PowerPoint Presentation Pictures Backgrounds
This is a project dashboard ppt powerpoint presentation pictures backgrounds. This is a four stage process. The stages in this process are cost, planning, table, project report, data management.
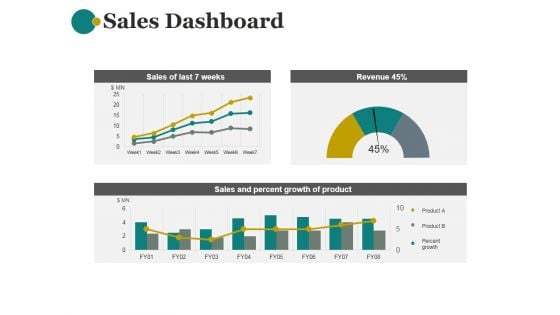
Sales Dashboard Template 1 Ppt PowerPoint Presentation Show
This is a sales dashboard template 1 ppt powerpoint presentation show. This is a three stage process. The stages in this process are sales of last 7 weeks, revenue, sales and percent growth of product.
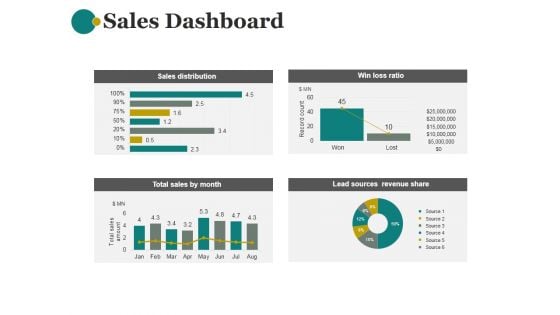
Sales Dashboard Template 2 Ppt PowerPoint Presentation Examples
This is a sales dashboard template 2 ppt powerpoint presentation examples. This is a four stage process. The stages in this process are sales distribution, win loss ratio, lead sources revenue share, total sales by month.
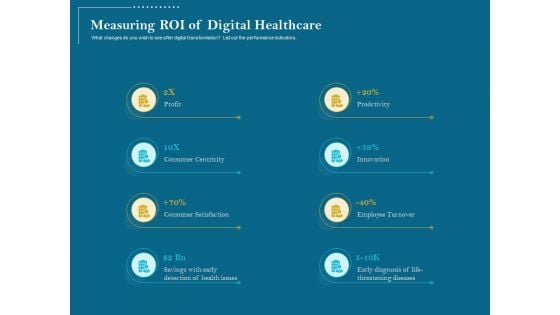
Utilizing Cyber Technology For Change Process Measuring ROI Of Digital Healthcare Formats PDF
What changes do you wish to see after digital transformation List out the performance indicators. This is a utilizing cyber technology for change process measuring roi of digital healthcare formats pdf template with various stages. Focus and dispense information on eight stages using this creative set, that comes with editable features. It contains large content boxes to add your information on topics like profit, consumer centricity, consumer satisfaction, savings with early detection of health issues, prodctivity, innovation, employee turnover, early diagnosis of life-threatening diseases. You can also showcase facts, figures, and other relevant content using this PPT layout. Grab it now.
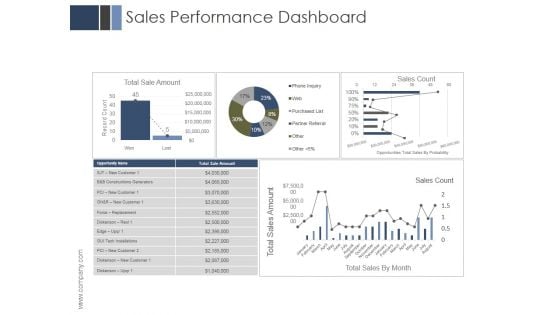
Sales Performance Dashboard Ppt PowerPoint Presentation Example 2015
This is a sales performance dashboard ppt powerpoint presentation example 2015. This is a four stage process. The stages in this process are business, marketing, management, finance, dashboard.
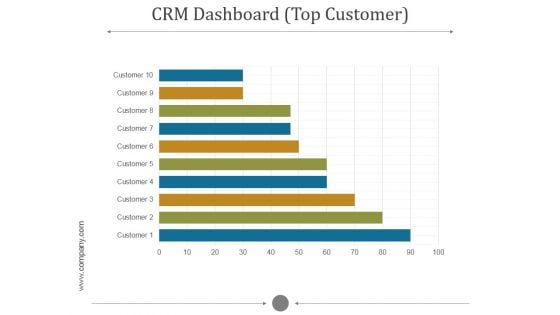
Crm Dashboard Top Customer Ppt PowerPoint Presentation Ideas
This is a crm dashboard top customer ppt powerpoint presentation ideas. This is a five stage process. The stages in this process are customer.
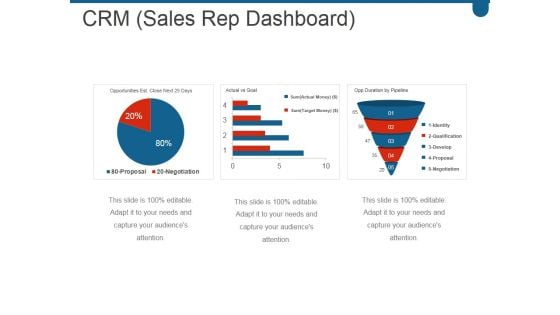
Crm Sales Rep Dashboard Ppt PowerPoint Presentation Clipart
This is a crm sales rep dashboard ppt powerpoint presentation clipart. This is a three stage process. The stages in this process are identity, qualification, develop, proposal, negotiation.

Email Activity Dashboard Ppt Powerpoint Presentation Styles Summary
This is a email activity dashboard ppt powerpoint presentation styles summary. This is a three stage process. The stages in this process are sent, opens, clicks, visits, unsubscribed, bounced, qualifying campaign.
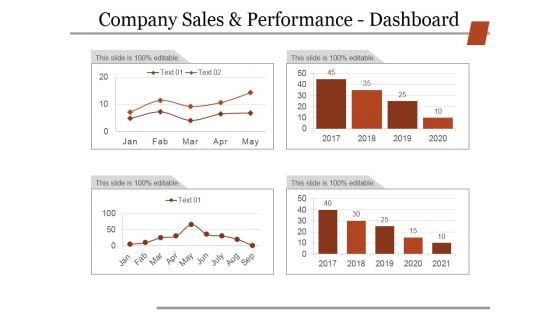
Company Sales And Performance Dashboard Ppt PowerPoint Presentation Slides Grid
This is a company sales and performance dashboard ppt powerpoint presentation slides grid. This is a four stage process. The stages in this process are business, strategy, marketing, finance, analysis.
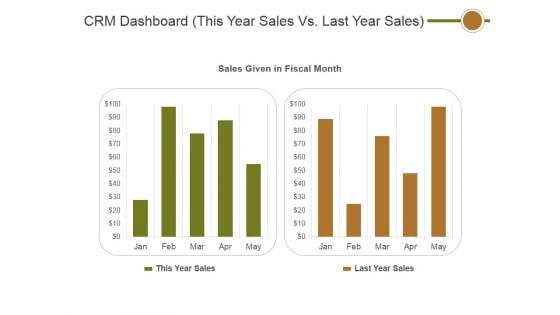
Crm Dashboard This Year Sales Vs Last Year Sales Ppt PowerPoint Presentation Layouts Outline
This is a crm dashboard this year sales vs last year sales ppt powerpoint presentation layouts outline. This is a two stage process. The stages in this process are sales given in fiscal month, this year sales, last year sales.
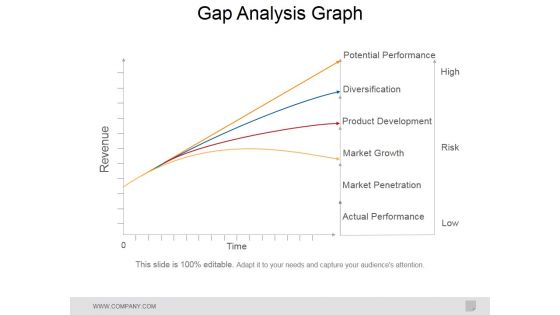
Gap Analysis Graph Ppt PowerPoint Presentation Portfolio Topics
This is a gap analysis graph ppt powerpoint presentation portfolio topics. This is a four stage process. The stages in this process are potential performance, diversification, product development, market growth, market penetration, actual performance.
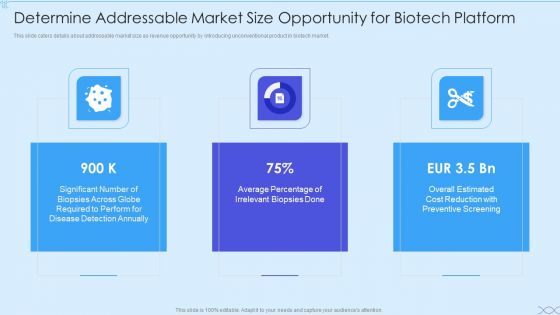
Biotech Firm Investor Funding Determine Addressable Market Size Opportunity For Biotech Platform Graphics PDF
This slide caters details about addressable market size as revenue opportunity by introducing unconventional product in biotech market. Presenting biotech firm investor funding determine addressable market size opportunity for biotech platform graphics pdf to provide visual cues and insights. Share and navigate important information on three stages that need your due attention. This template can be used to pitch topics like average percentage, overall estimated, significant number, required to perform, cost reduction. In addtion, this PPT design contains high resolution images, graphics, etc, that are easily editable and available for immediate download.
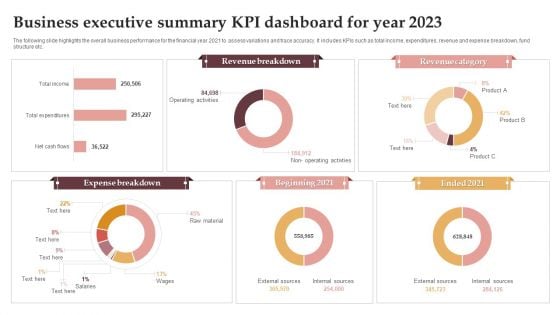
Business Executive Summary KPI Dashboard For Year 2023 Graphics PDF
The following slide highlights the overall business performance for the financial year 2021 to assess variations and trace accuracy. It includes KPIs such as total income, expenditures, revenue and expense breakdown, fund structure etc. Pitch your topic with ease and precision using this Business Executive Summary KPI Dashboard For Year 2023 Graphics PDF. This layout presents information on Revenue Breakdown, Revenue Category, Expense Breakdown. It is also available for immediate download and adjustment. So, changes can be made in the color, design, graphics or any other component to create a unique layout.
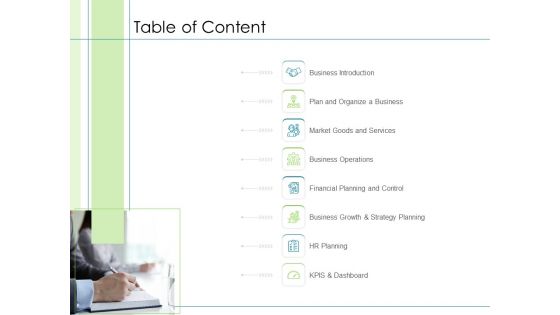
In Depth Business Assessment Table Of Content Ppt PowerPoint Presentation Inspiration Influencers PDF
Presenting in depth business assessment table of content ppt powerpoint presentation inspiration influencers pdf to provide visual cues and insights. Share and navigate important information on eight stages that need your due attention. This template can be used to pitch topics like business introduction, plan and organize business, market goods and services, business operations, financial planning and control, business growth and strategy planning, hr planning, kpis and dashboard. In addition, this PPT design contains high-resolution images, graphics, etc, that are easily editable and available for immediate download.
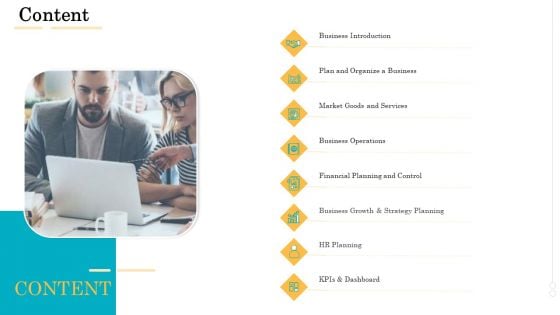
Administrative Regulation Content Ppt PowerPoint Presentation Inspiration Clipart Images PDF
Presenting administrative regulation content ppt powerpoint presentation inspiration clipart images pdf to provide visual cues and insights. Share and navigate important information on eight stages that need your due attention. This template can be used to pitch topics like business introduction, plan and organize a business, market goods and services, business operations, financial planning and control, business growth and strategy planning, hr planning, kpis and dashboard. In addition, this PPT design contains high-resolution images, graphics, etc, that are easily editable and available for immediate download.
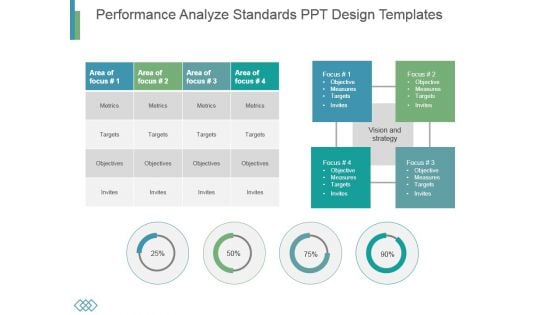
Performance Analyze Standards Ppt Design Templates
This is a performance analyze standards ppt design templates. This is a four stage process. The stages in this process are metrics, targets, objectives, invites.
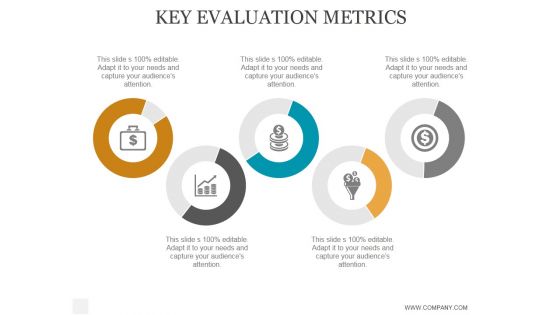
Key Evaluation Metrics Ppt PowerPoint Presentation Portfolio
This is a key evaluation metrics ppt powerpoint presentation portfolio. This is a five stage process. The stages in this process are business, strategy, marketing, analysis, success, icons.
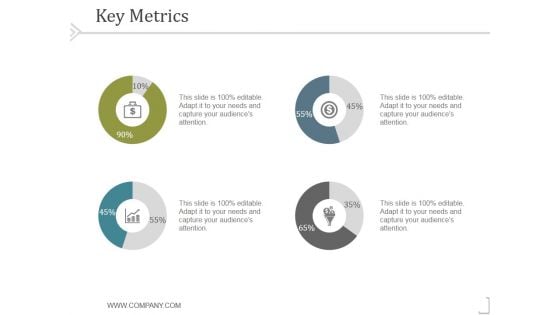
Key Metrics Ppt PowerPoint Presentation Rules
This is a key metrics ppt powerpoint presentation rules. This is a four stage process. The stages in this process are business, strategy, marketing, success, analysis, finance.
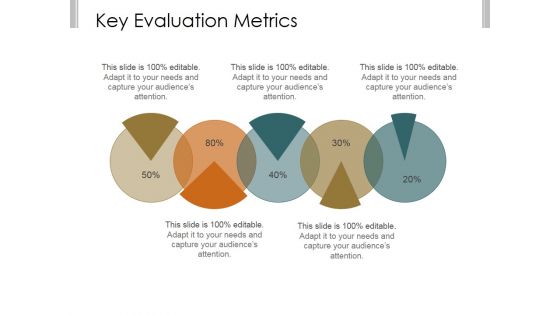
Key Evaluation Metrics Ppt PowerPoint Presentation Example File
This is a key evaluation metrics ppt powerpoint presentation example file. This is a five stage process. The stages in this process are business, strategy, marketing, analysis, finance.
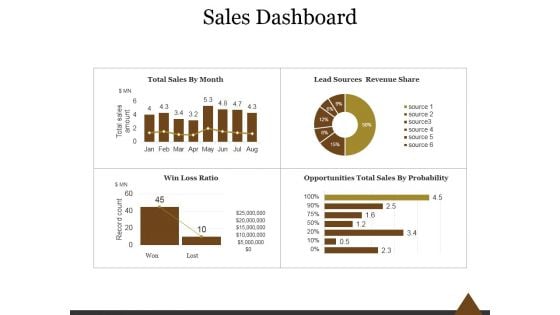
Sales Dashboard Template 2 Ppt PowerPoint Presentation Introduction
This is a sales dashboard template 2 ppt powerpoint presentation introduction. This is a four stage process. The stages in this process are total sales by month, lead sources revenue share, win loss ratio, opportunities total sales by probability.
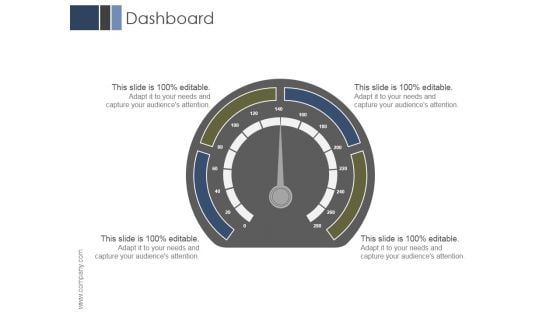
Dashboard Ppt PowerPoint Presentation Graphics
This is a dashboard ppt powerpoint presentation graphics. This is a four stage process. The stages in this process are business, marketing, management, dashboard, analysis.
Dashboard Ppt PowerPoint Presentation Portfolio
This is a dashboard ppt powerpoint presentation portfolio. This is a four stage process. The stages in this process are business, marketing, management, dashboard, finance.
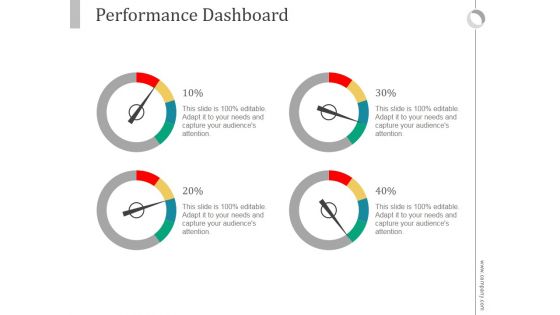
Performance Dashboard Ppt PowerPoint Presentation Background Image
This is a performance dashboard ppt powerpoint presentation background image. This is a four stage process. The stages in this process are business, marketing, management, dashboard, finance.
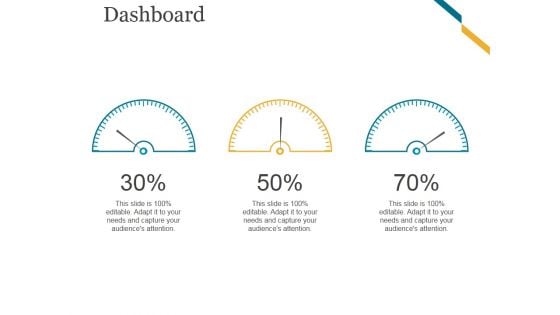
Dashboard Ppt PowerPoint Presentation Infographic Template Tips
This is a dashboard ppt powerpoint presentation infographic template tips. This is a three stage process. The stages in this process are speedometer, dashboard, business, marketing, equipment.
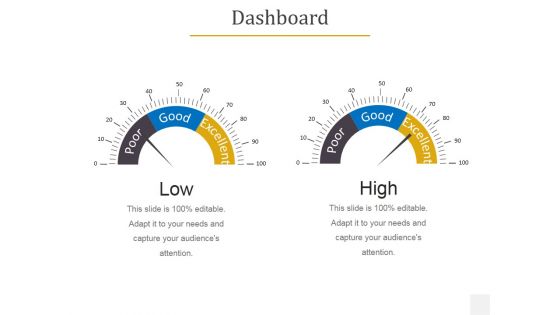
Dashboard Ppt PowerPoint Presentation Gallery Background
This is a dashboard ppt powerpoint presentation gallery background. This is a two stage process. The stages in this process are low, high, business, marketing, dashboard.


 Continue with Email

 Home
Home


