Financial Kpis
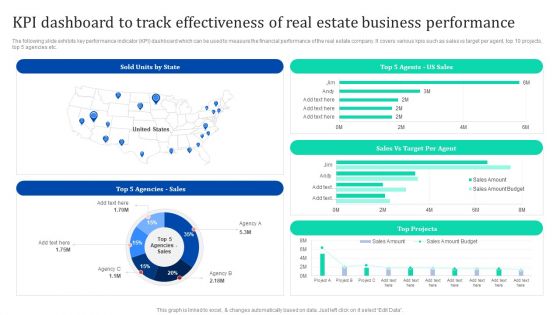
KPI Dashboard To Track Effectiveness Of Real Estate Business Enhancing Process Improvement By Regularly Themes PDF
The following slide exhibits key performance indicator KPI dashboard which can be used to measure the financial performance of the real estate company. It covers various kpis such as sales vs target per agent, top 10 projects, top 5 agencies etc. Welcome to our selection of the KPI Dashboard To Track Effectiveness Of Real Estate Business Enhancing Process Improvement By Regularly Themes PDF. These are designed to help you showcase your creativity and bring your sphere to life. Planning and Innovation are essential for any business that is just starting out. This collection contains the designs that you need for your everyday presentations. All of our PowerPoints are 100 parcent editable, so you can customize them to suit your needs. This multi-purpose template can be used in various situations. Grab these presentation templates today.
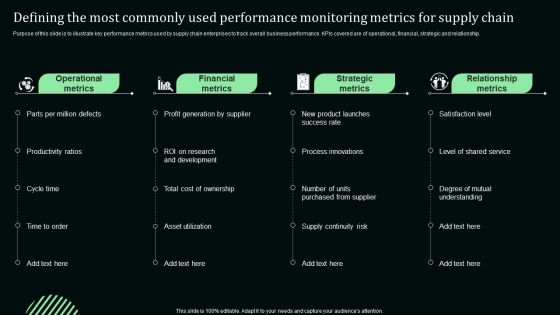
Defining The Most Commonly Used Performance Monitoring Metrics For Supply Chain Microsoft PDF
Purpose of this slide is to illustrate key performance metrics used by supply chain enterprises to track overall business performance. KPIs covered are of operational, financial, strategic and relationship.Crafting an eye-catching presentation has never been more straightforward. Let your presentation shine with this tasteful yet straightforward Defining The Most Commonly Used Performance Monitoring Metrics For Supply Chain Microsoft PDF template. It offers a minimalistic and classy look that is great for making a statement. The colors have been employed intelligently to add a bit of playfulness while still remaining professional. Construct the ideal Defining The Most Commonly Used Performance Monitoring Metrics For Supply Chain Microsoft PDF that effortlessly grabs the attention of your audience Begin now and be certain to wow your customers

Strategies For Dynamic Supply Chain Agility Defining The Most Commonly Used Performance Demonstration PDF
Purpose of this slide is to illustrate key performance metrics used by supply chain enterprises to track overall business performance. KPIs covered are of operational, financial, strategic and relationship. Create an editable Strategies For Dynamic Supply Chain Agility Defining The Most Commonly Used Performance Demonstration PDF that communicates your idea and engages your audience. Whether youre presenting a business or an educational presentation, pre designed presentation templates help save time. Strategies For Dynamic Supply Chain Agility Defining The Most Commonly Used Performance Demonstration PDF is highly customizable and very easy to edit, covering many different styles from creative to business presentations. Slidegeeks has creative team members who have crafted amazing templates. So, go and get them without any delay.
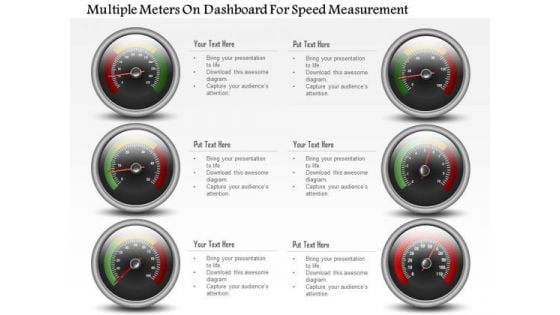
Business Diagram Multiple Meters On Dashboard For Speed Measurement PowerPoint Slide
This business diagram has been designed with multiple meters on dashboard. This slide can be used for business planning and progress. Use this diagram for your business and success milestones related presentations.
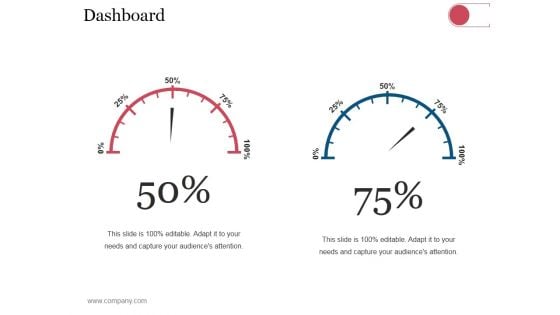
Dashboard Ppt PowerPoint Presentation Outline Grid
This is a dashboard ppt powerpoint presentation outline grid. This is a two stage process. The stages in this process are business, strategy, analysis, planning, dashboard, finance.
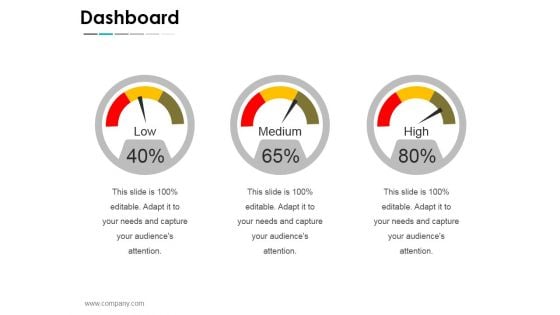
Dashboard Ppt PowerPoint Presentation Layouts Graphics Pictures
This is a dashboard ppt powerpoint presentation layouts graphics pictures. This is a three stage process. The stages in this process are business, strategy, analysis, planning, dashboard.
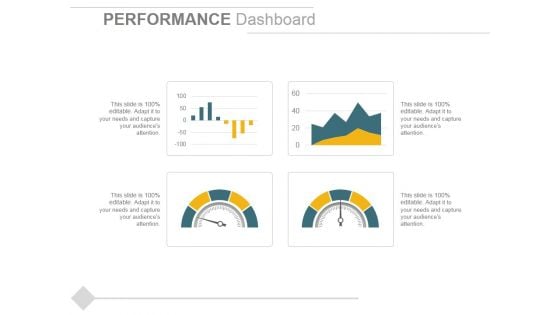
Performance Dashboard Template 2 Ppt PowerPoint Presentation Show Backgrounds
This is a performance dashboard template 2 ppt powerpoint presentation show backgrounds. This is a four stage process. The stages in this process are performance dashboard, business, marketing, management, finance.
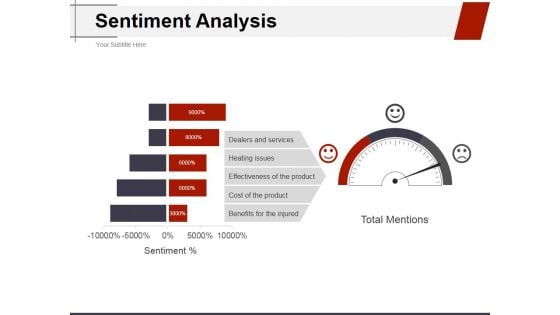
Sentiment Analysis Ppt PowerPoint Presentation Ideas Structure
This is a sentiment analysis ppt powerpoint presentation ideas structure. This is a three stage process. The stages in this process are dealers and services, heating issues, effectiveness of the product, cost of the product, benefits for the injured.
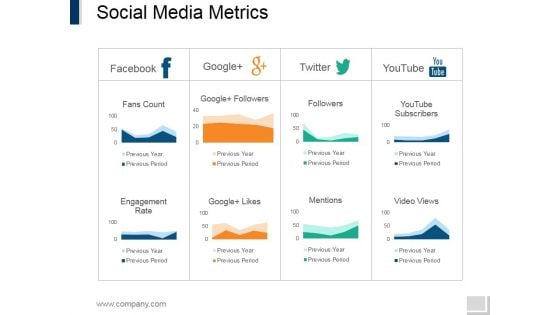
Social Media Metrics Ppt PowerPoint Presentation File Design Inspiration
This is a social media metrics ppt powerpoint presentation file design inspiration. This is a four stage process. The stages in this process are facebook, google, twitter, youtube.
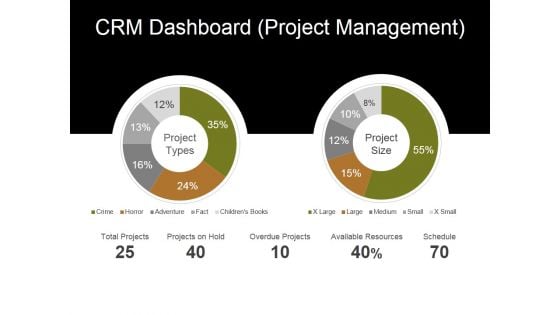
Crm Dashboard Project Management Ppt PowerPoint Presentation Layouts Ideas
This is a crm dashboard project management ppt powerpoint presentation layouts ideas. This is a two stage process. The stages in this process are total projects, projects on hold, overdue projects, available resources, schedule.
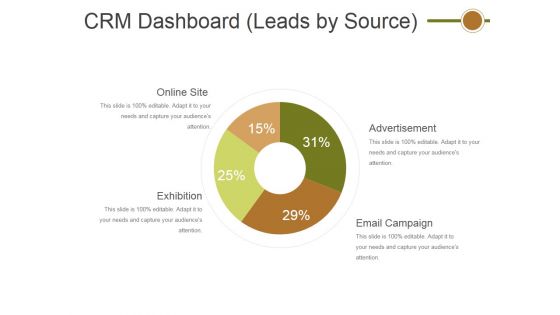
Crm Dashboard Leads By Source Ppt PowerPoint Presentation File Graphics Template
This is a crm dashboard leads by source ppt powerpoint presentation file graphics template. This is a four stage process. The stages in this process are online site, exhibition, advertisement, email campaign.
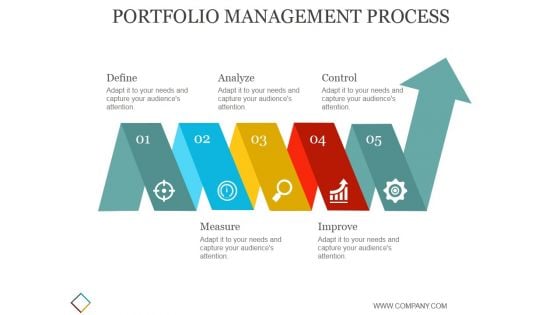
Portfolio Management Process Ppt PowerPoint Presentation Layout
This is a portfolio management process ppt powerpoint presentation layout. This is a five stage process. The stages in this process are define, analyze, control, measure, improve.
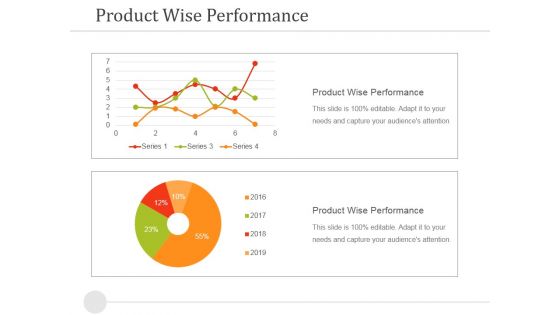
Product Wise Performance Ppt PowerPoint Presentation Visual Aids Outline
This is a product wise performance ppt powerpoint presentation visual aids outline. This is a two stage process. The stages in this process are product wise performance, business, marketing, success.
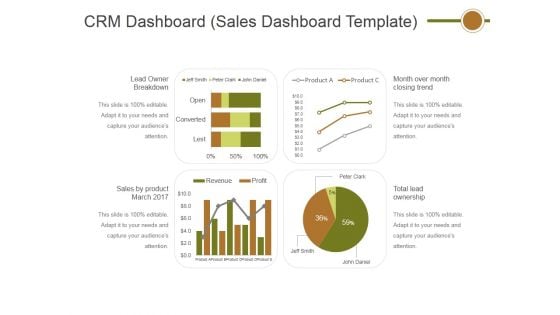
Crm Dashboard Sales Dashboard Template Ppt PowerPoint Presentation Professional Layout
This is a crm dashboard sales dashboard template ppt powerpoint presentation professional layout. This is a four stage process. The stages in this process are lead owner breakdown, sales by product march 2017, total lead ownership, month over month closing trend.
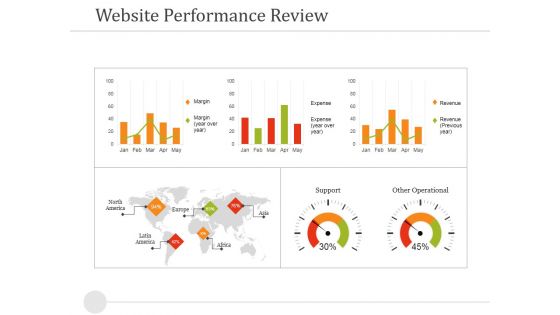
Website Performance Review Template 2 Ppt PowerPoint Presentation Gallery Objects
This is a website performance review template 2 ppt powerpoint presentation gallery objects. This is a three stage process. The stages in this process are margin, revenue, expense, support, other operational.
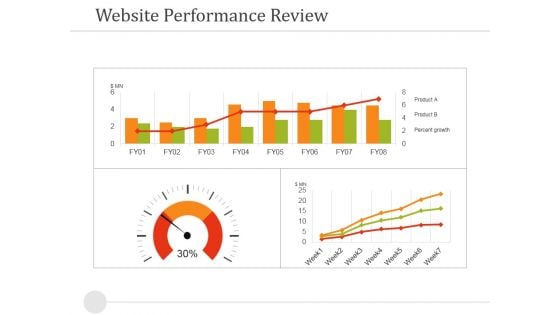
Website Performance Review Template 1 Ppt PowerPoint Presentation Portfolio Guide
This is a website performance review template 1 ppt powerpoint presentation portfolio guide. This is a four stage process. The stages in this process are website performance review, dashboard, business, marketing, finance.
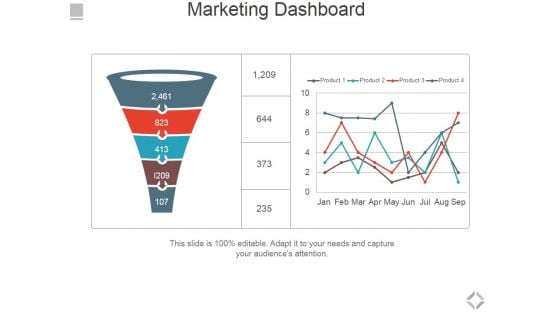
Marketing Dashboard Ppt PowerPoint Presentation Visual Aids Example 2015
This is a marketing dashboard ppt powerpoint presentation visual aids example 2015. This is a two stage process. The stages in this process are marketing, dashboard, funnel, business, process.
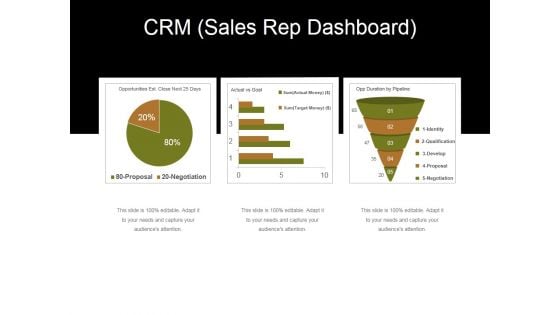
Crm Rep Dashboard Ppt PowerPoint Presentation Styles Objects
This is a crm rep dashboard ppt powerpoint presentation styles objects. This is a three stage process. The stages in this process are negotiation, proposal, develop, qualification, identity.
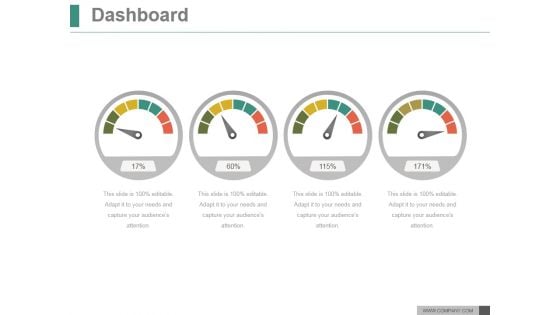
Dashboard Ppt PowerPoint Presentation Example 2015
This is a dashboard ppt powerpoint presentation example 2015. This is a four stage process. The stages in this process are business, marketing, management, analysis, dashboard.
Chart With Magnifying Glass For Business Research Ppt PowerPoint Presentation Inspiration Shapes
This is a chart with magnifying glass for business research ppt powerpoint presentation inspiration shapes. This is a two stage process. The stages in this process are metrics icon, kpis icon, statistics icon.
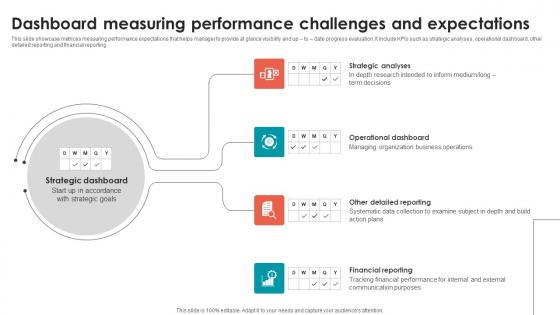
Dashboard Measuring Performance Challenges And Expectations Portrait Pdf
This slide showcase metrices measuring performance expectations that helps manager to provide at glance visibility and up to date progress evaluation. It include KPIs such as strategic analyses, operational dashboard, other detailed reporting and financial reporting. Showcasing this set of slides titled Dashboard Measuring Performance Challenges And Expectations Portrait Pdf. The topics addressed in these templates are Operational Dashboard, Strategic Analyses, Financial Reporting. All the content presented in this PPT design is completely editable. Download it and make adjustments in color, background, font etc. as per your unique business setting. This slide showcase metrices measuring performance expectations that helps manager to provide at glance visibility and up to date progress evaluation. It include KPIs such as strategic analyses, operational dashboard, other detailed reporting and financial reporting.
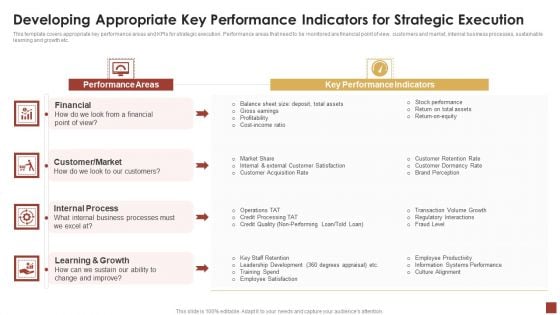
Strategical And Tactical Planning Developing Appropriate Key Performance Indicators Brochure PDF
This template covers appropriate key performance areas and KPIs for strategic execution. Performance areas that need to be monitored are financial point of view, customers and market, internal business processes, sustainable learning and growth etc. Deliver an awe inspiring pitch with this creative Strategical And Tactical Planning Developing Appropriate Key Performance Indicators Brochure PDF bundle. Topics like Performance Areas, Key Performance Indicators, Financial can be discussed with this completely editable template. It is available for immediate download depending on the needs and requirements of the user.
Metrics Scorecard With Internal Objectives And Customer Satisfaction Icons PDF
The purpose of this slide is to showcase different KPIs for company business. Information covered in this slide is related to financial status, business growth, internal objectives and customer satisfaction. Showcasing this set of slides titled Metrics Scorecard With Internal Objectives And Customer Satisfaction Icons PDF. The topics addressed in these templates are Financial Status, Customer Satisfaction, Internal Objectives. All the content presented in this PPT design is completely editable. Download it and make adjustments in color, background, font etc. as per your unique business setting.
Analytics Dashboard Tracking Effective Digital Transformation Journey PPT Presentation DT SS V
This slide represents an analytics dashboard for effective energy monitoring and management. It tracks KPIs such as energy production, solar energy production, savings, energy produced, carbon savings, and financial savings. Get a simple yet stunning designed Analytics Dashboard Tracking Effective Digital Transformation Journey PPT Presentation DT SS V. It is the best one to establish the tone in your meetings. It is an excellent way to make your presentations highly effective. So, download this PPT today from Slidegeeks and see the positive impacts. Our easy-to-edit Analytics Dashboard Tracking Effective Digital Transformation Journey PPT Presentation DT SS V can be your go-to option for all upcoming conferences and meetings. So, what are you waiting for Grab this template today. This slide represents an analytics dashboard for effective energy monitoring and management. It tracks KPIs such as energy production, solar energy production, savings, energy produced, carbon savings, and financial savings.
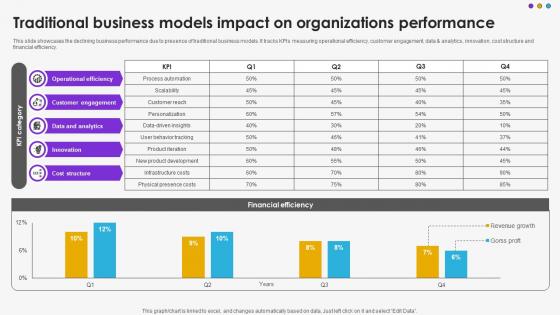
Traditional Business Models Impact On Organizations Performance DT SS V
This slide showcases the declining business performance due to presence of traditional business models. It tracks KPIs measuring operational efficiency, customer engagement, data and analytics, innovation, cost structure and financial efficiency.Do you have an important presentation coming up Are you looking for something that will make your presentation stand out from the rest Look no further than Traditional Business Models Impact On Organizations Performance DT SS V. With our professional designs, you can trust that your presentation will pop and make delivering it a smooth process. And with Slidegeeks, you can trust that your presentation will be unique and memorable. So why wait Grab Traditional Business Models Impact On Organizations Performance DT SS V today and make your presentation stand out from the rest This slide showcases the declining business performance due to presence of traditional business models. It tracks KPIs measuring operational efficiency, customer engagement, data and analytics, innovation, cost structure and financial efficiency.
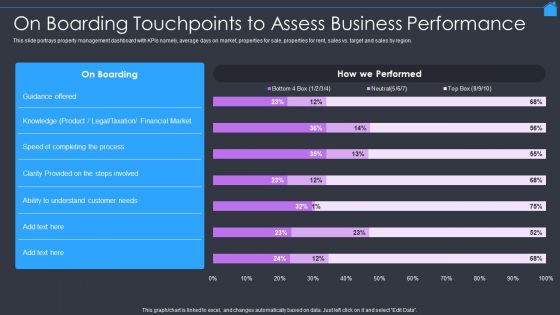
Marketing Strategy To Enhance Real Estate Sales On Boarding Touchpoints To Assess Business Performance Guidelines PDF
This slide portrays property management dashboard with KPIs namely, average days on market, properties for sale, properties for rent, sales vs. target and sales by region. Deliver an awe inspiring pitch with this creative Marketing Strategy To Enhance Real Estate Sales On Boarding Touchpoints To Assess Business Performance Guidelines PDF bundle. Topics like Financial Market, Taxation, Product can be discussed with this completely editable template. It is available for immediate download depending on the needs and requirements of the user.

Manufacturing Quality Assurance And Control Measures Understanding Scheduling Phase Production Pictures PDF
This slide provides glimpse about production scheduling to plan schedules for production phases that helps the business to manage production effectively. It includes KPIs for production scheduling, key factors, etc. There are so many reasons you need a Manufacturing Quality Assurance And Control Measures Understanding Scheduling Phase Production Pictures PDF. The first reason is you can not spend time making everything from scratch, Thus, Slidegeeks has made presentation templates for you too. You can easily download these templates from our website easily.
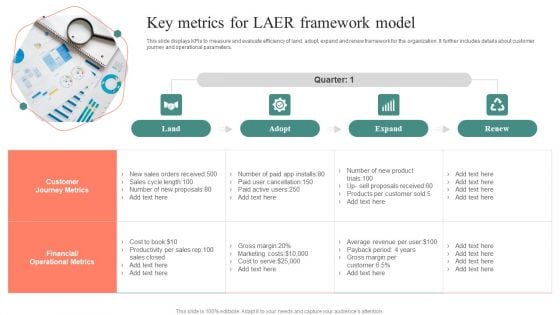
Key Metrics For LAER Framework Model Ideas PDF
This slide displays KPIs to measure and evaluate efficiency of land, adopt, expand and renew framework for the organization. It further includes details about customer journey and operational parameters. Presenting Key Metrics For LAER Framework Model Ideas PDF to dispense important information. This template comprises four stages. It also presents valuable insights into the topics including Customer Journey Metrics, Financial Operational Metrics. This is a completely customizable PowerPoint theme that can be put to use immediately. So, download it and address the topic impactfully.
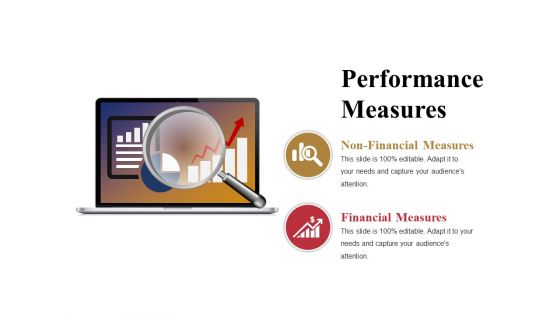
Performance Measures Ppt PowerPoint Presentation Inspiration Skills
This is a performance measures ppt powerpoint presentation inspiration skills. This is a two stage process. The stages in this process are non financial measures, financial measures, growth, business, marketing.
Performance Measures Ppt PowerPoint Presentation Slides Sample
This is a performance measures ppt powerpoint presentation slides sample. This is a two stage process. The stages in this process are financial measures, non financial measures, business, strategy.
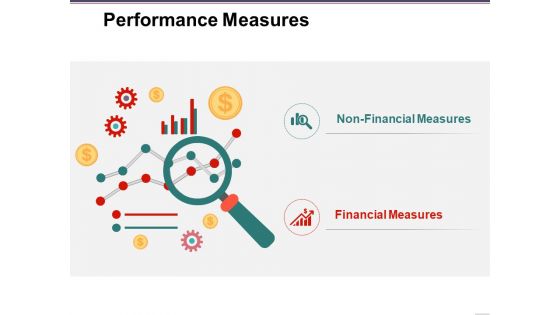
Performance Measures Ppt PowerPoint Presentation Layouts Clipart Images
This is a performance measures ppt powerpoint presentation layouts clipart images. This is a two stage process. The stages in this process are non financial measures, financial measures, business, icons, marketing.
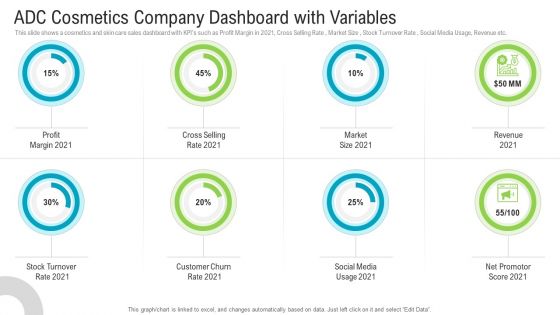
ADC Cosmetics Company Dashboard With Variables Summary PDF
This slide shows a cosmetics and skin care sales dashboard with KPIs such as Profit Margin in 2021, Cross Selling Rate , Market Size , Stock Turnover Rate , Social Media Usage, Revenue etc. Presenting adc cosmetics company dashboard with variables summary pdf to provide visual cues and insights. Share and navigate important information on eight stages that need your due attention. This template can be used to pitch topics like profit margin, cross selling rate, market size, revenue, stock turnover rate. In addtion, this PPT design contains high resolution images, graphics, etc, that are easily editable and available for immediate download.
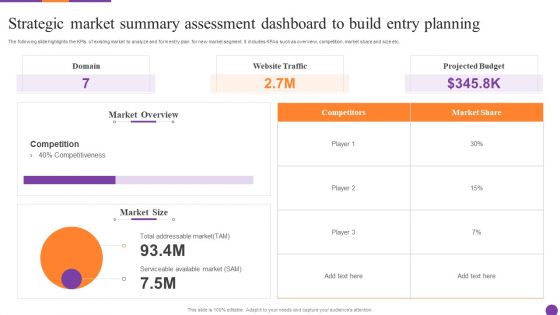
Strategic Market Summary Assessment Dashboard To Build Entry Planning Ppt Layouts Background Image PDF
The following slide highlights the KPIs of existing market to analyze and form entry plan for new market segment. It includes KPAs such as overview, competition, market share and size etc. Persuade your audience using this Strategic Market Summary Assessment Dashboard To Build Entry Planning Ppt Layouts Background Image PDF. This PPT design covers one stages, thus making it a great tool to use. It also caters to a variety of topics including Market Overview, Website Traffic, Projected Budget. Download this PPT design now to present a convincing pitch that not only emphasizes the topic but also showcases your presentation skills.
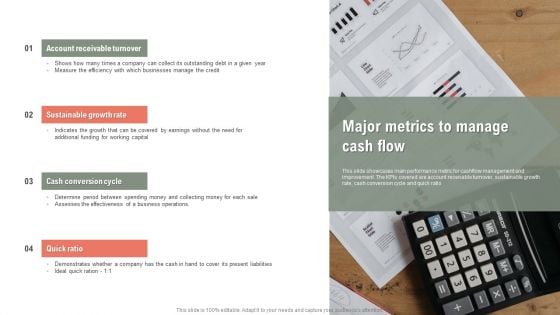
Major Metrics To Manage Cash Flow Ppt Infographics Portfolio PDF
This slide showcases main performance metric for cashflow management and improvement. The KPIs covered are account receivable turnover, sustainable growth rate, cash conversion cycle and quick ratio. Presenting Major Metrics To Manage Cash Flow Ppt Infographics Portfolio PDF to dispense important information. This template comprises four stages. It also presents valuable insights into the topics including Account Receivable Turnover, Sustainable Growth Rate, Cash Conversion Cycle. This is a completely customizable PowerPoint theme that can be put to use immediately. So, download it and address the topic impactfully.
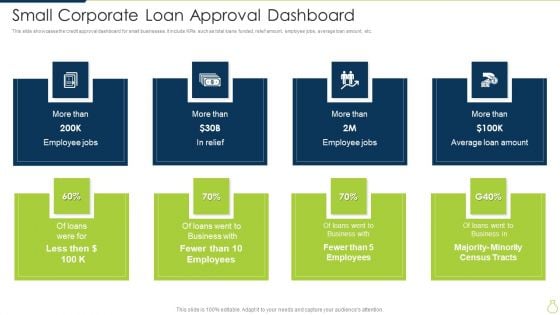
Small Corporate Loan Approval Dashboard Diagrams PDF
This slide showcases the credit approval dashboard for small businesses. It include KPIs such as total loans funded, relief amount, employee jobs, average loan amount, etc. Persuade your audience using this Small Corporate Loan Approval Dashboard Diagrams PDF. This PPT design covers eight stages, thus making it a great tool to use. It also caters to a variety of topics including Business, Loans, Census Tracts. Download this PPT design now to present a convincing pitch that not only emphasizes the topic but also showcases your presentation skills.
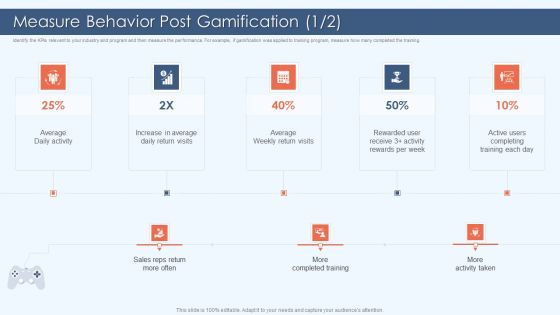
Gamification Strategy For Business Promotion Measure Behavior Post Gamification Slides PDF
Identify the KPIs relevant to your industry and program and then measure the performance. For example, if gamification was applied to training program, measure how many completed the training.This is a Gamification Strategy For Business Promotion Measure Behavior Post Gamification Slides PDF template with various stages. Focus and dispense information on five stages using this creative set, that comes with editable features. It contains large content boxes to add your information on topics like Completed Training, Increase In Average, Average Activity. You can also showcase facts, figures, and other relevant content using this PPT layout. Grab it now.
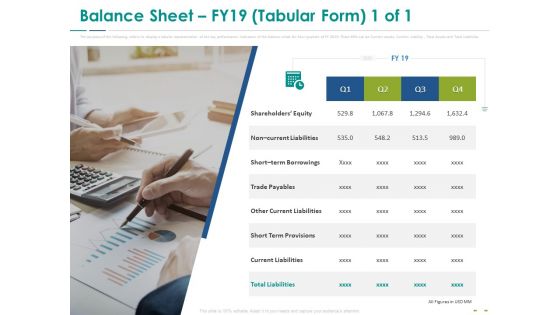
Stock Market Research Report Balance Sheet FY19 Tabular Form Equity Information PDF
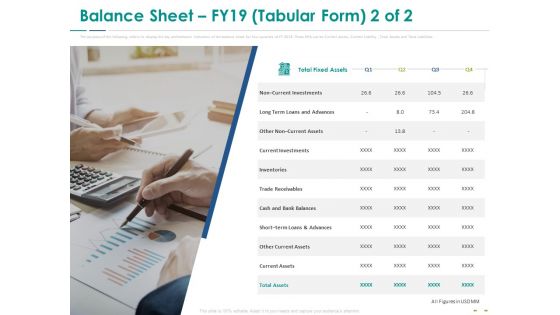
The purpose of the following slide is to display the key performance indicators of the balance sheet for four quarters of FY 2019. These KPIs can be Current assets, Current Liability , Total Assets and Total Liabilities. Presenting stock market research report balance sheet fy19 tabular form equity information pdf to provide visual cues and insights. Share and navigate important information on one stages that need your due attention. This template can be used to pitch topics like non current liabilities, short term borrowings, trade payables, other current liabilities, short term provisions. In addition, this PPT design contains high-resolution images, graphics, etc, that are easily editable and available for immediate download.
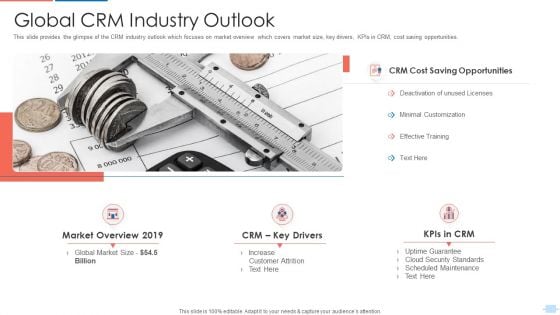
Customer Relationship Management Application Investor Global CRM Industry Outlook Information PDF
This slide provides the glimpse of the CRM industry outlook which focuses on market overview which covers market size, key drivers, KPIs in CRM, cost saving opportunities. This is a customer relationship management application investor global crm industry outlook information pdf template with various stages. Focus and dispense information on three stages using this creative set, that comes with editable features. It contains large content boxes to add your information on topics like global crm industry outlook. You can also showcase facts, figures, and other relevant content using this PPT layout. Grab it now.
Continuous Enhancement Strategy Impact Of Operational Excellence On Organization Icons PDF
Purpose of the following slide is to show the impact of operational excellence over the organization, these KPIs can be increase in employee efficiency, more efficient usage of resources and increase in interdepartmental Co-operation. Presenting Continuous Enhancement Strategy Impact Of Operational Excellence On Organization Icons PDF to provide visual cues and insights. Share and navigate important information on five stages that need your due attention. This template can be used to pitch topics like Increase Employee Efficiency, More Efficient Usage Resources, Increase Interdepartmental Co Operation. In addtion, this PPT design contains high resolution images, graphics, etc, that are easily editable and available for immediate download.
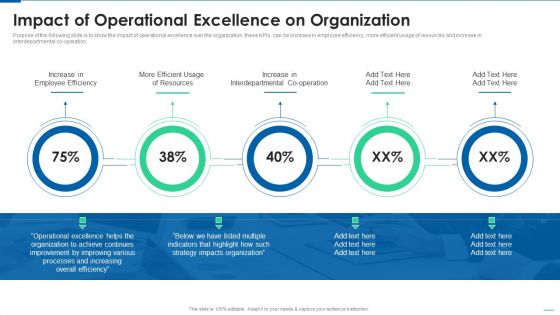
Six Sigma Continuous Process Impact Of Operational Excellence On Organization Topics PDF
Purpose of the following slide is to show the impact of operational excellence over the organization, these KPIs can be increase in employee efficiency, more efficient usage of resources and increase in interdepartmental co-operation. Presenting Six Sigma Continuous Process Impact Of Operational Excellence On Organization Topics PDF to provide visual cues and insights. Share and navigate important information on five stages that need your due attention. This template can be used to pitch topics like Increase Employee Efficient, More Efficient Usage Of Resources, Increase Interdepartmental Co Operation. In addtion, this PPT design contains high resolution images, graphics, etc, that are easily editable and available for immediate download.
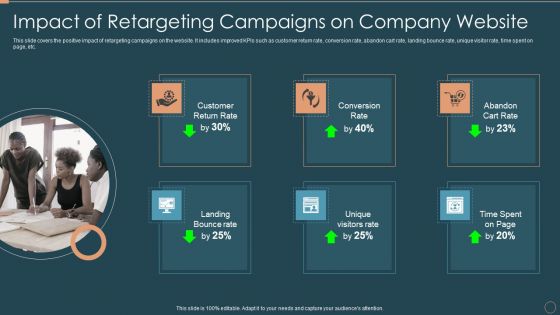
Remarketing Techniques Impact Of Retargeting Campaigns On Company Website Introduction PDF
This slide covers the positive impact of retargeting campaigns on the website. It includes improved KPIs such as customer return rate, conversion rate, abandon cart rate, landing bounce rate, unique visitor rate, time spent on page, etc. Presenting Remarketing Techniques Impact Of Retargeting Campaigns On Company Website Introduction PDF to provide visual cues and insights. Share and navigate important information on six stages that need your due attention. This template can be used to pitch topics like Customer Return Rate, Conversion Rate, Abandon Cart Rate. In addtion, this PPT design contains high resolution images, graphics, etc, that are easily editable and available for immediate download.
Professional Scrum Master Training IT Software Development Progress Tracking Dashboard Mockup PDF
This slide portrays software development project management dashboard with KPIs namely status of planning, design, development, testing project launch date, project budget, overdue tasks, workload and upcoming deadlines. Deliver and pitch your topic in the best possible manner with this professional scrum master training it software development progress tracking dashboard mockup pdf. Use them to share invaluable insights on financial risk, people risk, governance risk, competitive risk, system or technology and impress your audience. This template can be altered and modified as per your expectations. So, grab it now.
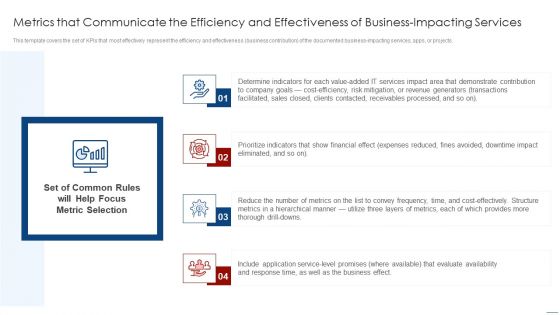
How To Evaluate And Develop The Organizational Value Of IT Service Metrics That Communicate The Efficiency Portrait PDF
This template covers the set of KPIs that most effectively represent the efficiency and effectiveness business contribution of the documented business-impacting services, apps, or projects. This is a how to evaluate and develop the organizational value of it service metrics that communicate the efficiency portrait pdf template with various stages. Focus and dispense information on four stages using this creative set, that comes with editable features. It contains large content boxes to add your information on topics like business, cost effectively, financial effect, goals. You can also showcase facts, figures, and other relevant content using this PPT layout. Grab it now.
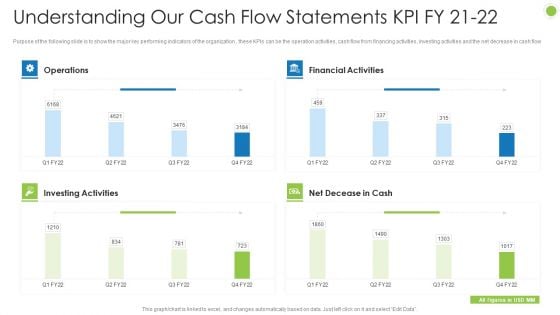
Debt Retrieval Techniques Understanding Our Cash Flow Statements Kpi Fy 21 22 Ppt Inspiration Deck PDF
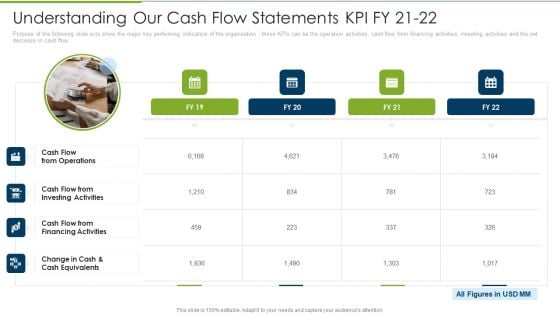
Purpose of the following slide is to show the major key performing indicators of the organization , these KPIs can be the operation activities, cash flow from financing activities, investing activities and the net decrease in cash flow Deliver an awe inspiring pitch with this creative debt retrieval techniques understanding our cash flow statements kpi fy 21 22 ppt inspiration deck pdf bundle. Topics like operations, investing activities, net decease in cash, financial activities can be discussed with this completely editable template. It is available for immediate download depending on the needs and requirements of the user.
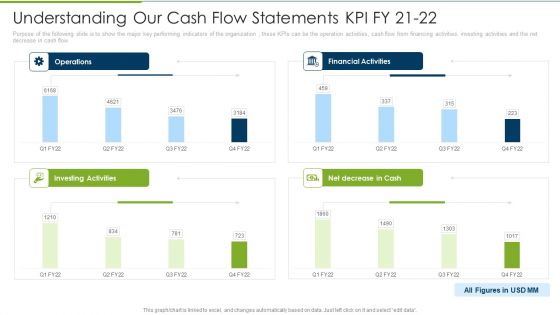
Debt Collection Improvement Plan Understanding Our Cash Flow Statements KPI Fy 21 To 22 Elements PDF
Purpose of the following slide is to show the major key performing indicators of the organization , these KPIs can be the operation activities, cash flow from financing activities, investing activities and the net decrease in cash flow. Deliver and pitch your topic in the best possible manner with this debt collection improvement plan understanding our cash flow statements kpi fy 21 to 22 elements pdf. Use them to share invaluable insights on operations, financial activities, investing activities, net decrease cash and impress your audience. This template can be altered and modified as per your expectations. So, grab it now.
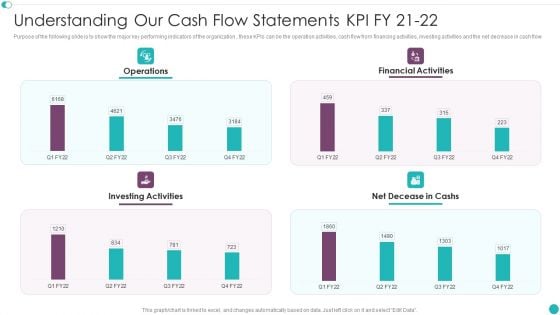
Credit Management And Recovery Policies Understanding Our Cash Flow Statements KPI Portrait PDF
Purpose of the following slide is to show the major key performing indicators of the organization , these KPIs can be the operation activities, cash flow from financing activities, investing activities and the net decrease in cash flow. Deliver an awe inspiring pitch with this creative Credit Management And Recovery Policies Understanding Our Cash Flow Statements KPI Portrait PDF bundle. Topics like Financial Activities, Investing Activities, Net Decease can be discussed with this completely editable template. It is available for immediate download depending on the needs and requirements of the user.
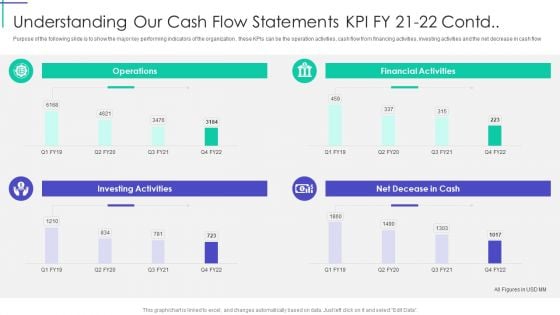
Understanding Our Cash Flow Statements KPI Fy 21 To 22 Contd Themes PDF
Purpose of the following slide is to show the major key performing indicators of the organization , these KPIs can be the operation activities, cash flow from financing activities, investing activities and the net decrease in cash flow Deliver and pitch your topic in the best possible manner with this Understanding Our Cash Flow Statements KPI Fy 21 To 22 Contd Themes PDF. Use them to share invaluable insights on Investing Activities, Financial Activities, Operations and impress your audience. This template can be altered and modified as per your expectations. So, grab it now.
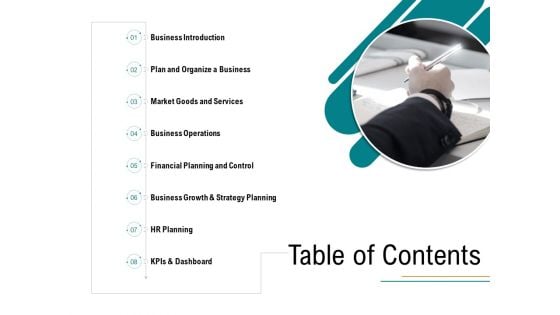
Business Operations Assessment Table Of Contents Ppt PowerPoint Presentation Infographic Template Guidelines PDF
Presenting business operations assessment table of contents ppt powerpoint presentation infographic template guidelines pdf to provide visual cues and insights. Share and navigate important information on eight stages that need your due attention. This template can be used to pitch topics like business introduction, plan and organize a business, market goods and services, business operations, financial planning and control, business growth and strategy planning , hr planning, kpis and dashboard. In addition, this PPT design contains high-resolution images, graphics, etc, that are easily editable and available for immediate download.
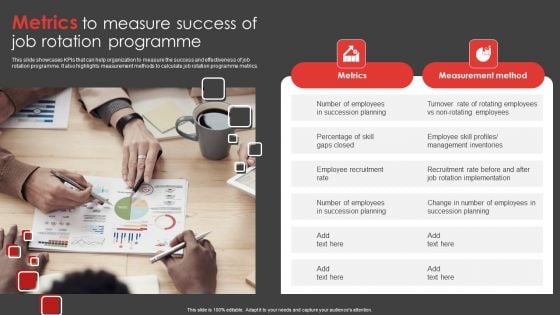
Job Rotation Plan For Staff Metrics To Measure Success Of Job Rotation Programme Diagrams PDF
This slide showcases KPIs that can help organization to measure the success and effectiveness of job rotation programme. It also highlights measurement methods to calculate job rotation programme metrics. Slidegeeks is one of the best resources for PowerPoint templates. You can download easily and regulate Job Rotation Plan For Staff Metrics To Measure Success Of Job Rotation Programme Diagrams PDF for your personal presentations from our wonderful collection. A few clicks is all it takes to discover and get the most relevant and appropriate templates. Use our Templates to add a unique zing and appeal to your presentation and meetings. All the slides are easy to edit and you can use them even for advertisement purposes.
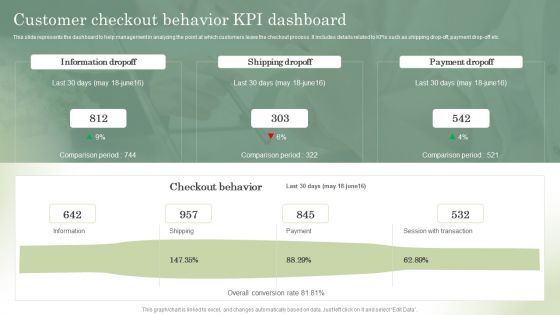
Optimizing Online Stores Customer Checkout Behavior KPI Dashboard Brochure PDF
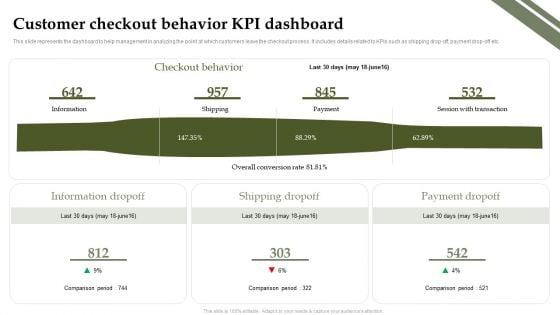
This slide represents the dashboard to help management in analyzing the point at which customers leave the checkout process. It includes details related to KPIs such as shipping drop-off, payment drop-off etc. Slidegeeks is here to make your presentations a breeze with Optimizing Online Stores Customer Checkout Behavior KPI Dashboard Brochure PDF With our easy-to-use and customizable templates, you can focus on delivering your ideas rather than worrying about formatting. With a variety of designs to choose from, youre sure to find one that suits your needs. And with animations and unique photos, illustrations, and fonts, you can make your presentation pop. So whether youre giving a sales pitch or presenting to the board, make sure to check out Slidegeeks first.
Analyzing And Deploying Effective CMS Customer Checkout Behavior KPI Dashboard Elements PDF
This slide represents the dashboard to help management in analyzing the point at which customers leave the checkout process. It includes details related to KPIs such as shipping drop off, payment drop off etc. If you are looking for a format to display your unique thoughts, then the professionally designed Analyzing And Deploying Effective CMS Customer Checkout Behavior KPI Dashboard Elements PDF is the one for you. You can use it as a Google Slides template or a PowerPoint template. Incorporate impressive visuals, symbols, images, and other charts. Modify or reorganize the text boxes as you desire. Experiment with shade schemes and font pairings. Alter, share or cooperate with other people on your work. Download Analyzing And Deploying Effective CMS Customer Checkout Behavior KPI Dashboard Elements PDF and find out how to give a successful presentation. Present a perfect display to your team and make your presentation unforgettable.
Stock Market Research Report Balance Sheet FY19 Tabular Form Investments Designs PDF
The purpose of the following slide is to display a tabular representation of the key performance indicators of the balance sheet for four quarters of FY 2019. These KPIs can be Current assets, Current Liability , Total Assets and Total Liabilities. This is a stock market research report balance sheet fy19 tabular form investments designs pdf template with various stages. Focus and dispense information on one stages using this creative set, that comes with editable features. It contains large content boxes to add your information on topics like non current investments, long term loans and advances, current investments, inventories, trade receivables. You can also showcase facts, figures, and other relevant content using this PPT layout. Grab it now.
Debt Retrieval Techniques Understanding Our Cash Flow Statements Kpi Fy 20 21 Ppt Infographic Template Background Images PDF
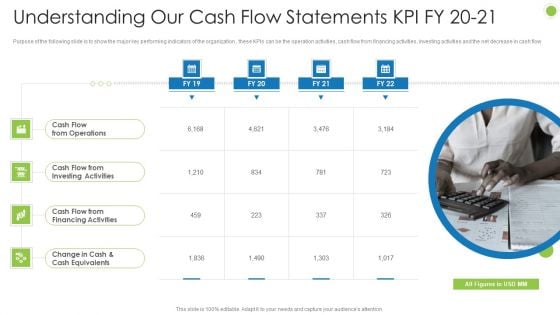
Purpose of the following slide is to show the major key performing indicators of the organization , these KPIs can be the operation activities, cash flow from financing activities, investing activities and the net decrease in cash flow This is a debt retrieval techniques understanding our cash flow statements kpi fy 20 21 ppt infographic template background images pdf template with various stages. Focus and dispense information on four stages using this creative set, that comes with editable features. It contains large content boxes to add your information on topics like cash flow from operations, cash flow from investing activities, cash flow from financing activities, change in cash and cash equivalents. You can also showcase facts, figures, and other relevant content using this PPT layout. Grab it now.
Understanding Our Cash Flow Statements KPI Fy 21 To 22 Debt Collection Improvement Plan Slides PDF
Purpose of the following slide is to show the major key performing indicators of the organization , these KPIs can be the operation activities, cash flow from financing activities, investing activities and the net decrease in cash flow. Presenting understanding our cash flow statements kpi fy 21 to 22 debt collection improvement plan slides pdf to provide visual cues and insights. Share and navigate important information on four stages that need your due attention. This template can be used to pitch topics like cash flow from operations, cash flow from investing activities, cash flow from financing activities, change in cash and cash equivalents. In addtion, this PPT design contains high resolution images, graphics, etc, that are easily editable and available for immediate download.
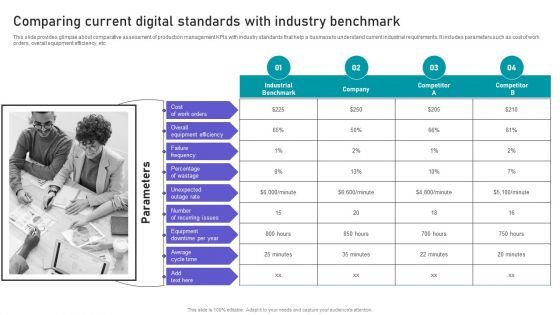
Effective Manufacturing Planning And Control Administration System Comparing Current Digital Standards Introduction PDF
This slide provides glimpse about comparative assessment of production management KPIs with industry standards that help a business to understand current industrial requirements. It includes parameters such as cost of work orders, overall equipment efficiency, etc. Coming up with a presentation necessitates that the majority of the effort goes into the content and the message you intend to convey. The visuals of a PowerPoint presentation can only be effective if it supplements and supports the story that is being told. Keeping this in mind our experts created Effective Manufacturing Planning And Control Administration System Comparing Current Digital Standards Introduction PDF to reduce the time that goes into designing the presentation. This way, you can concentrate on the message while our designers take care of providing you with the right template for the situation.
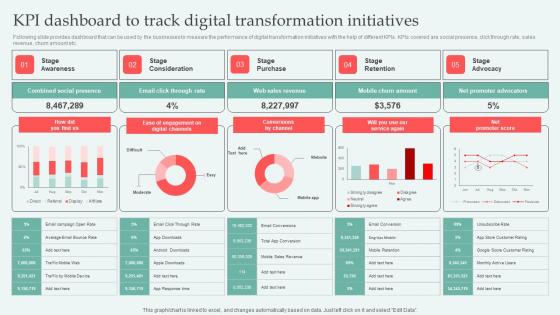
KPI Dashboard To Track Digital Approaches To Increase Business Growth Professional Pdf
Following slide provides dashboard that can be used by the businesses to measure the performance of digital transformation initiatives with the help of different KPIs. KPIs covered are social presence, click through rate, sales revenue, churn amount etc. If your project calls for a presentation, then Slidegeeks is your go to partner because we have professionally designed, easy to edit templates that are perfect for any presentation. After downloading, you can easily edit KPI Dashboard To Track Digital Approaches To Increase Business Growth Professional Pdf and make the changes accordingly. You can rearrange slides or fill them with different images. Check out all the handy templates Following slide provides dashboard that can be used by the businesses to measure the performance of digital transformation initiatives with the help of different KPIs. KPIs covered are social presence, click through rate, sales revenue, churn amount etc.
Key Performance Indicators For Smarketing Ppt Icon Graphic Images PDF
This slide shows various KPIs which can be used to measure marketing and sales alignment. These are overall revenue, sales cycle length, marketing qualified leads, etc. Presenting Key Performance Indicators For Smarketing Ppt Icon Graphic Images PDF to dispense important information. This template comprises one stages. It also presents valuable insights into the topics including KPIs, Overall Revenue, Sales Cycle Length. This is a completely customizable PowerPoint theme that can be put to use immediately. So, download it and address the topic impactfully.
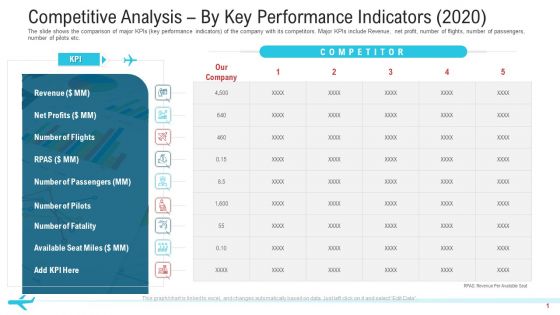
Competitive Analysis By Key Performance Indicators 2020 Designs PDF
The slide shows the comparison of major KPIs key performance indicators of the company with its competitors. Major KPIs include Revenue, net profit, number of flights, number of passengers, number of pilots etc.Deliver an awe-inspiring pitch with this creative competitive analysis by key performance indicators 2020 designs pdf. bundle. Topics like net profits, revenue, number of passengers can be discussed with this completely editable template. It is available for immediate download depending on the needs and requirements of the user.
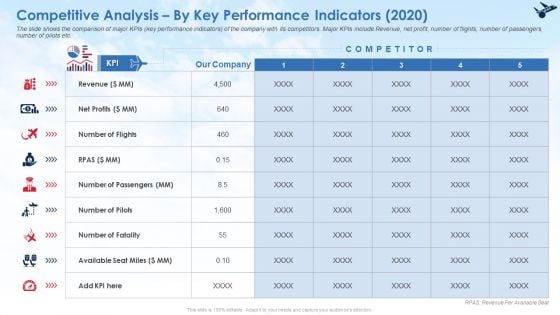
Competitive Analysis By Key Performance Indicators 2020 Professional PDF
The slide shows the comparison of major KPIs key performance indicators of the company with its competitors. Major KPIs include Revenue, net profit, number of flights, number of passengers, number of pilots etc. Deliver an awe inspiring pitch with this creative competitive analysis by key performance indicators 2020 professional pdf bundle. Topics like revenue, net profits can be discussed with this completely editable template. It is available for immediate download depending on the needs and requirements of the user.
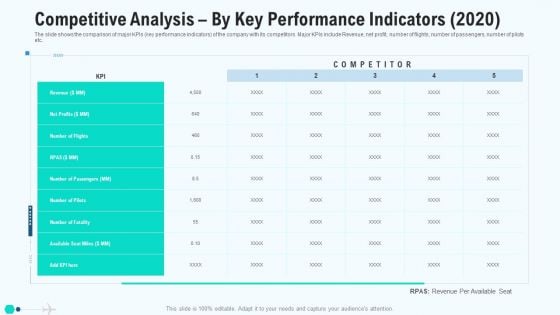
Competitive Analysis By Key Performance Indicators 2020 Elements PDF
The slide shows the comparison of major KPIs key performance indicators of the company with its competitors. Major KPIs include Revenue, net profit, number of flights, number of passengers, number of pilots etc. Deliver an awe inspiring pitch with this creative competitive analysis by key performance indicators 2020 elements pdf bundle. Topics like competitive analysis by key performance indicators can be discussed with this completely editable template. It is available for immediate download depending on the needs and requirements of the user.


 Continue with Email

 Home
Home


