Financial Kpis
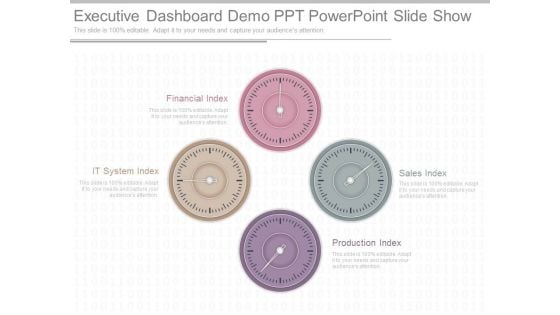
Executive Dashboard Demo Ppt Powerpoint Slide Show
This is a executive dashboard demo ppt powerpoint slide show. This is a four stage process. The stages in this process are financial index, it system index, production index, sales index.
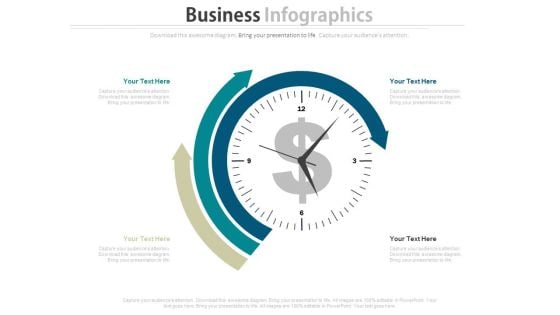
Dashboard Diagram For Finance And Strategic Analysis Powerpoint Slides
This PowerPoint template display graphics of clock with arrows around it and dollar symbol in center. You may use this PPT slide for financial and strategic analysis. This dashboard slide may useful for multilevel status report creation and approval process.
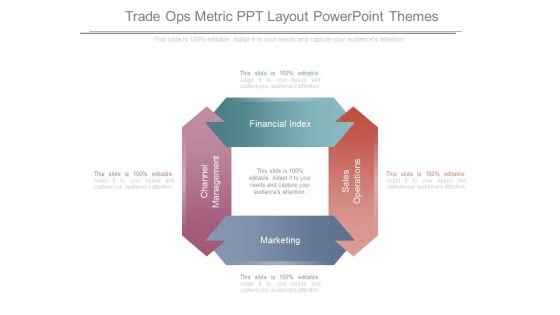
Trade Ops Metric Ppt Layout Powerpoint Themes
This is a trade ops metric ppt layout powerpoint themes. This is a four stage process. The stages in this process are channel management, marketing, sales operations, financial index.
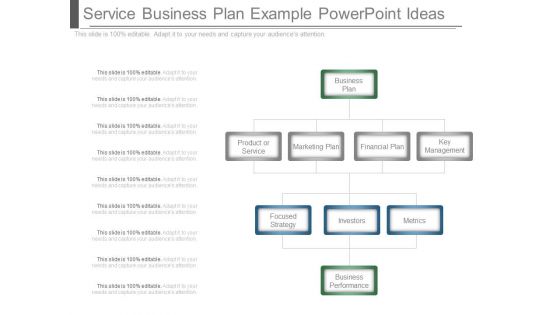
Service Business Plan Example Powerpoint Ideas
This is a service business plan example powerpoint ideas. This is a nine stage process. The stages in this process are business plan, product or service, marketing plan, financial plan, key management, focused strategy, investors, metrics.
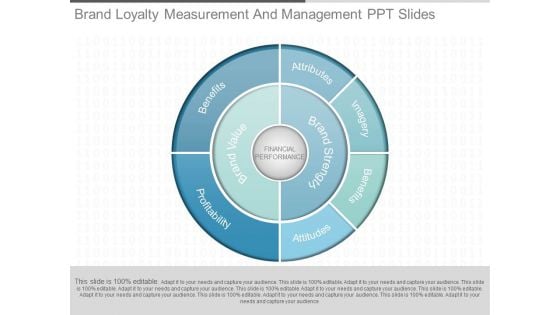
Brand Loyalty Measurement And Management Ppt Slides
This is a brand loyalty measurement and management ppt slides. This is a six stage process. The stages in this process are financial performance, brand value, brand strategy, benefits, profitability, imagery, attributes, attitudes.
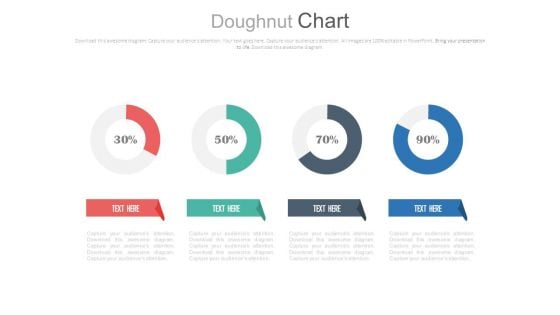
Four Circle Chart With Percentage Ratios Powerpoint Slides
This PowerPoint template has been designed with graphics of four circles and percentage ratios. You may use this dashboard slide design for topics like profit growth and financial planning. This PPT slide is powerful tool to describe your ideas.
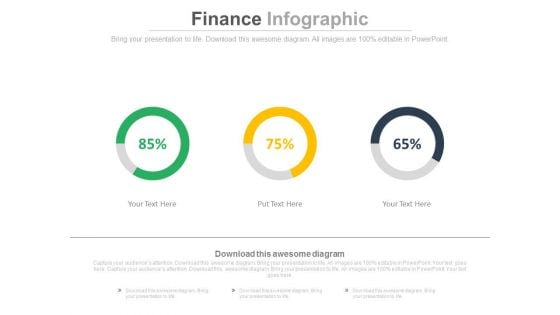
Linear Circles Percentage Analysis Charts Powerpoint Slides
This PowerPoint template has been designed with graphics of three circles and percentage ratios. You may use this dashboard slide design for topics like profit growth and financial planning. This PPT slide is powerful tool to describe your ideas.
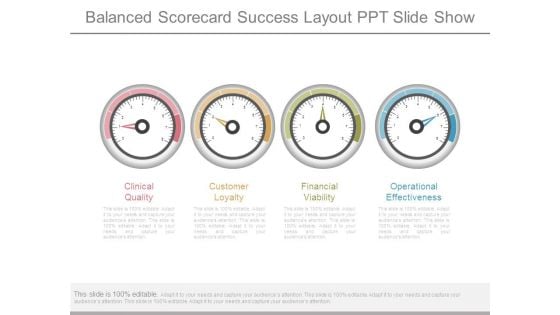
Balanced Scorecard Success Layout Ppt Slide Show
This is a balanced scorecard success layout ppt slide show. This is a four stage process. The stages in this process are clinical quality, customer loyalty, financial viability, operational effectiveness.
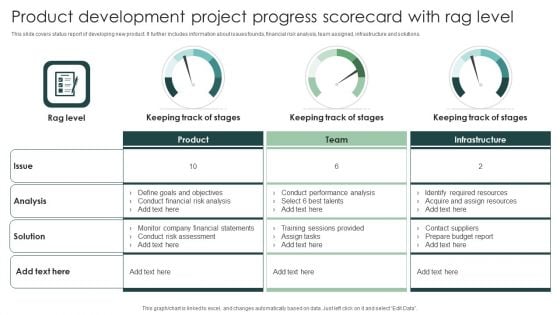
Product Development Project Progress Scorecard With Rag Level Themes PDF
This slide covers status report of developing new product. It further includes information about issues founds, financial risk analysis, team assigned, infrastructure and solutions. Showcasing this set of slides titled Product Development Project Progress Scorecard With Rag Level Themes PDF. The topics addressed in these templates are Conduct Financial, Prepare Budget Report, Assign Resources. All the content presented in this PPT design is completely editable. Download it and make adjustments in color, background, font etc. as per your unique business setting.
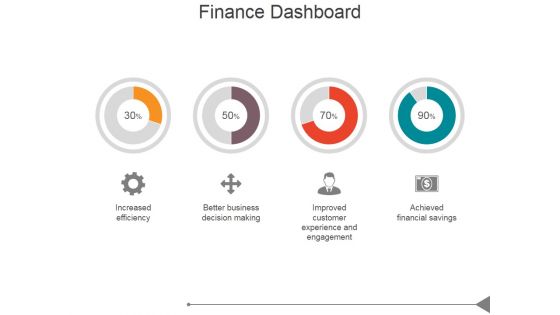
Finance Dashboard Ppt PowerPoint Presentation Diagrams
This is a finance dashboard ppt powerpoint presentation diagrams. This is a four stage process. The stages in this process are increased efficiency, better business decision making, improved customer experience and engagement, achieved financial savings.
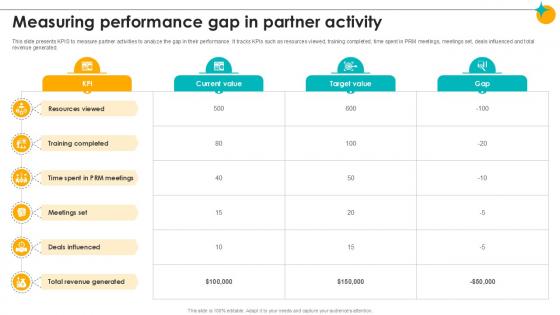
Measuring Performance Gap In Partner Activity Partner Relationship Ppt Slides
This slide presents KPIS to measure partner activities to analyze the gap in their performance. It tracks KPIs such as resources viewed, training completed, time spent in PRM meetings, meetings set, deals influenced and total revenue generated. Do you have to make sure that everyone on your team knows about any specific topic I yes, then you should give Measuring Performance Gap In Partner Activity Partner Relationship Ppt Slides a try. Our experts have put a lot of knowledge and effort into creating this impeccable Measuring Performance Gap In Partner Activity Partner Relationship Ppt Slides. You can use this template for your upcoming presentations, as the slides are perfect to represent even the tiniest detail. You can download these templates from the Slidegeeks website and these are easy to edit. So grab these today This slide presents KPIS to measure partner activities to analyze the gap in their performance. It tracks KPIs such as resources viewed, training completed, time spent in PRM meetings, meetings set, deals influenced and total revenue generated.
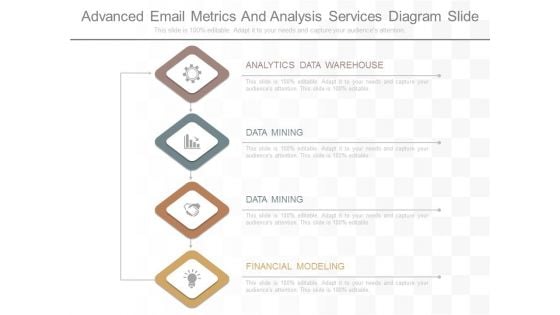
Advanced Email Metrics And Analysis Services Diagram Slide
This is a advanced email metrics and analysis services diagram slide. This is a four stage process. The stages in this process are analytics data warehouse, data mining, financial modeling.

Stock Performance Metrics For Warehouse Management Ppt Tips PDF
This slide indicates the inventory KPIs for warehouse management which helps in improving logistics business activities. It includes parameters such as financial, productivity, utilization, etc. Showcasing this set of slides titled Stock Performance Metrics For Warehouse Management Ppt Tips PDF. The topics addressed in these templates are Receiving, Financial, Productivity. All the content presented in this PPT design is completely editable. Download it and make adjustments in color, background, font etc. as per your unique business setting.
Measure A Firms Market Risk Example Ppt Example File
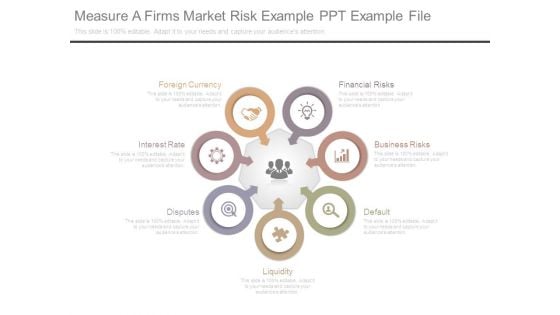
This is a measure a firms market risk example ppt example file. This is a seven stage process. The stages in this process are foreign currency, interest rate, disputes, liquidity, default, business risks, financial risks.
Four Companies With Web Services Powerpoint Slides
This PowerPoint template display graphics of four corporate buildings. You may use this PPT slide for financial and strategic analysis for web services companies. This dashboard slide may useful for multilevel status report creation and approval process.
Local Consumer Services International Trade Of Products And Services PPT Example CP SS V
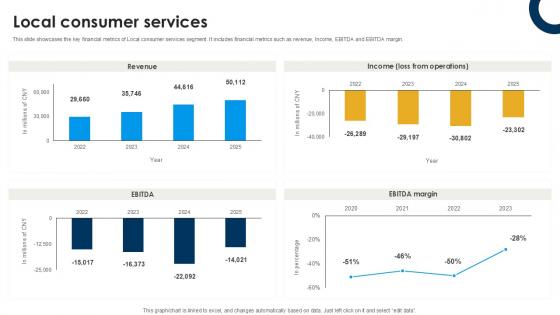
This slide showcases the key financial metrics of Local consumer services segment. It includes financial metrics such as revenue, Income, EBITDA and EBITDA margin. Welcome to our selection of the Local Consumer Services International Trade Of Products And Services PPT Example CP SS V. These are designed to help you showcase your creativity and bring your sphere to life. Planning and Innovation are essential for any business that is just starting out. This collection contains the designs that you need for your everyday presentations. All of our PowerPoints are 100Percent editable, so you can customize them to suit your needs. This multi-purpose template can be used in various situations. Grab these presentation templates today. This slide showcases the key financial metrics of Local consumer services segment. It includes financial metrics such as revenue, Income, EBITDA and EBITDA margin.
Business Performance Ppt PowerPoint Presentation File Graphics
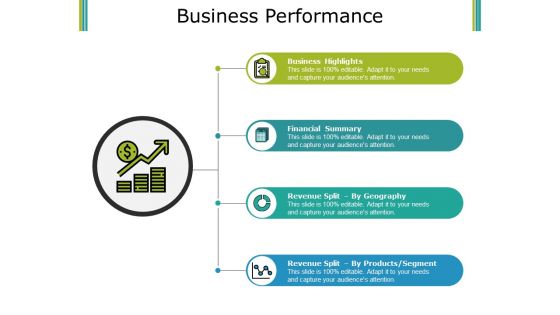
This is a business performance ppt powerpoint presentation file graphics. This is a four stage process. The stages in this process are business highlights, financial summary, revenue split by geography, revenue split by products.
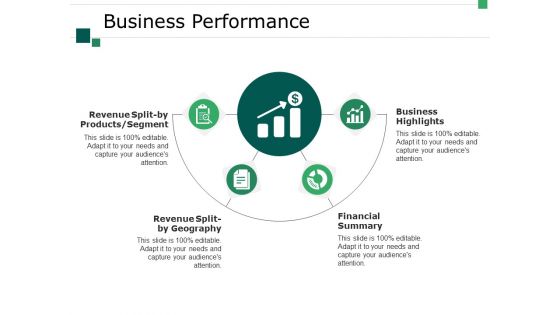
Business Performance Ppt PowerPoint Presentation Inspiration Examples
This is a business performance ppt powerpoint presentation inspiration examples. This is a four stage process. The stages in this process are business, revenue split by geography, financial summary, business highlights, revenue split by products segment.
Four Circles With Percentage Values And Icons Powerpoint Slides
This PowerPoint template displays info graphic diagram of linear circles. This diagram may be used to exhibit financial growth and analysis. Grab center stage with this slide and capture the attention of your audience.
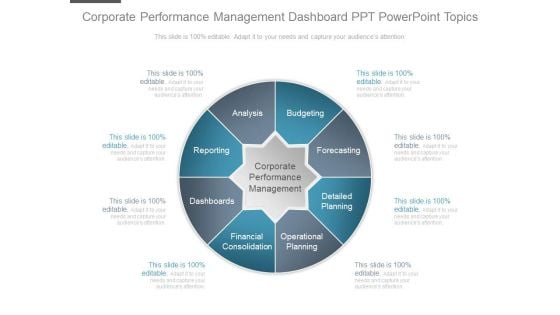
Corporate Performance Management Dashboard Ppt Powerpoint Topics
This is a corporate performance management dashboard ppt powerpoint topics. This is a eight stage process. The stages in this process are analysis, reporting, dashboards, financial consolidation, budgeting, forecasting, detailed planning, operational planning, corporate performance management.
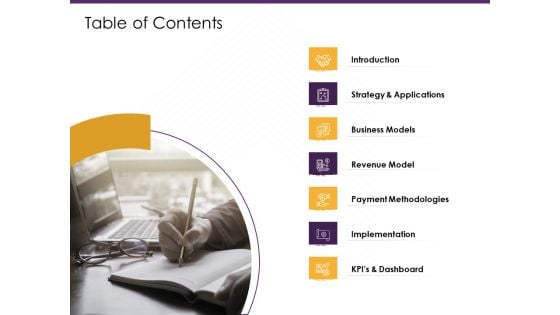
E Commerce Table Of Contents Ppt PowerPoint Presentation Diagram Templates PDF
Presenting this set of slides with name e commerce table of contents ppt powerpoint presentation diagram templates pdf. This is a seven stage process. The stages in this process are introduction, strategy and applications, business models, revenue model, payment methodologies, implementation, kpis and dashboard. This is a completely editable PowerPoint presentation and is available for immediate download. Download now and impress your audience.
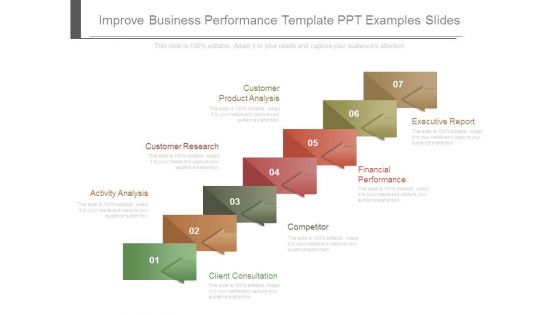
Improve Business Performance Template Ppt Examples Slides
This is a improve business performance template ppt examples slides. This is a seven stage process. The stages in this process are customer product analysis, customer research, activity analysis, executive report, financial performance, competitor, client consultation.

Clear Point Community Dashboard Example Ppt Slide
This is a clear point community dashboard example ppt slide. This is a four stage process. The stages in this process are internal perspective, learning and growth, financial perspective, customer perspective.
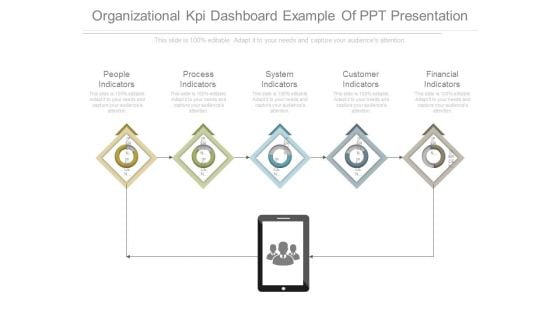
Organizational Kpi Dashboard Example Of Ppt Presentation
This is a organizational kpi dashboard example of ppt presentation. This is a five stage process. The stages in this process are people indicators, process indicators, system indicators, customer indicators, financial indicators.
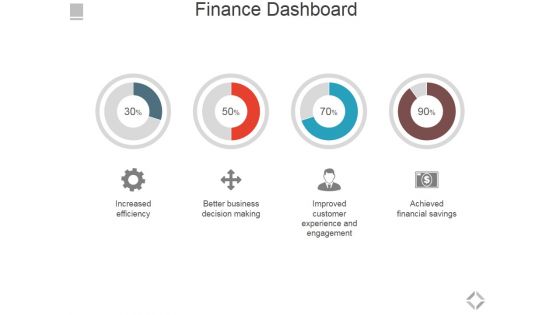
Finance Dashboard Ppt PowerPoint Presentation Layouts Infographics
This is a finance dashboard ppt powerpoint presentation layouts infographics. This is a four stage process. The stages in this process are increased efficiency, better business decision making, improved customer experience and engagement, achieved financial savings.
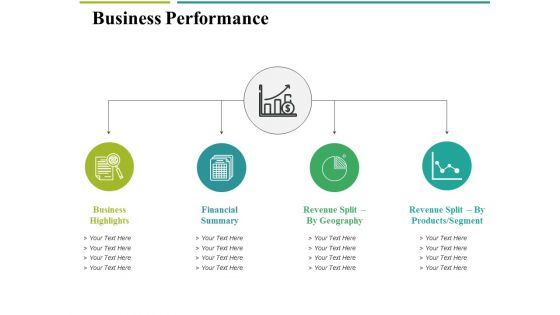
Business Performance Ppt PowerPoint Presentation Professional Visual Aids
This is a business performance ppt powerpoint presentation professional visual aids. This is a four stage process. The stages in this process are business, business highlights, financial summary, revenue split by geography, revenue split by products segment.
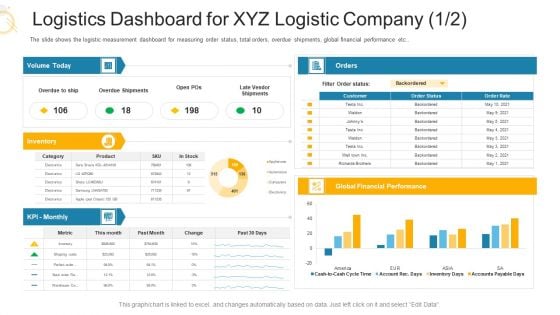
Logistics Dashboard For XYZ Logistic Company Performance Ppt Portfolio Slides PDF
The slide shows the logistic measurement dashboard for measuring order status, total orders, overdue shipments, global financial performance etc. Deliver an awe inspiring pitch with this creative logistics dashboard for XYZ logistic company performance ppt portfolio slides pdf bundle. Topics like financial performance, product, logistics dashboard for XYZ logistic company can be discussed with this completely editable template. It is available for immediate download depending on the needs and requirements of the user.
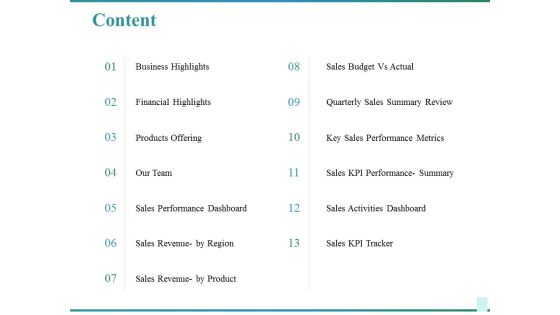
Content Ppt PowerPoint Presentation Infographics Diagrams
This is a content ppt powerpoint presentation infographics diagrams. This is a thirteen stage process. The stages in this process are business highlights, financial highlights, products offering, sales performance dashboard, sales revenue by region.

Knowledge Management Process Model Ppt Slides
This is a knowledge management process model ppt slides. This is a six stage process. The stages in this process are knowledge manager, reports dashboard, metrics manager, financial tracker, resource manager, project tracker, result, strategy, execution.
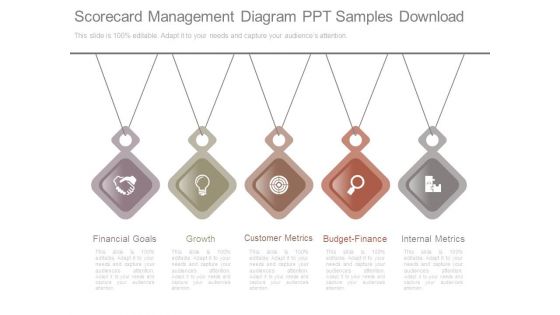
Scorecard Management Diagram Ppt Samples Download
This is a scorecard management diagram ppt samples download. This is a five stage process. The stages in this process are financial goals, growth, customer metrics, budget finance, internal metrics.
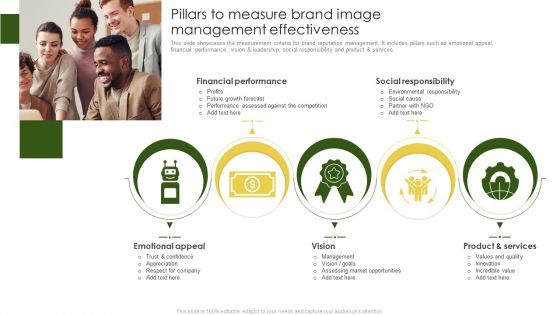
Pillars To Measure Brand Image Management Effectiveness Brochure PDF
This slide showcases the measurement criteria for brand reputation management. It includes pillars such as emotional appeal, financial performance, vision and leadership, social responsibility and product and services. Showcasing this set of slides titled Pillars To Measure Brand Image Management Effectiveness Brochure PDF. The topics addressed in these templates are Financial Performance, Social Responsibility, Emotional Appeal. All the content presented in this PPT design is completely editable. Download it and make adjustments in color, background, font etc. as per your unique business setting.
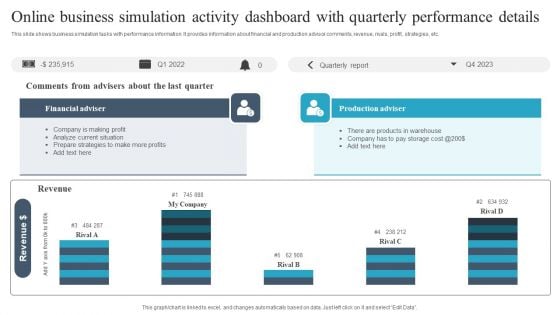
Online Business Simulation Activity Dashboard With Quarterly Performance Details Guidelines PDF
This slide shows business simulation tasks with performance information. It provides information about financial and production advisor comments, revenue, rivals, profit, strategies, etc. Pitch your topic with ease and precision using this Online Business Simulation Activity Dashboard With Quarterly Performance Details Guidelines PDF. This layout presents information on Financial Adviser, Production Adviser, Revenue. It is also available for immediate download and adjustment. So, changes can be made in the color, design, graphics or any other component to create a unique layout.
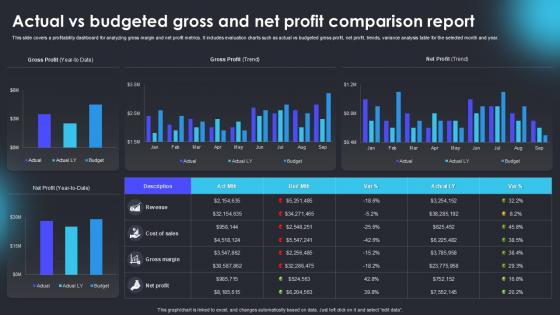
Actual Vs Budgeted Gross And Net Profit Comparison Report
Boost your pitch with our creative Actual Vs Budgeted Gross And Net Profit Comparison Report. Deliver an awe-inspiring pitch that will mesmerize everyone. Using these presentation templates you will surely catch everyones attention. You can browse the ppts collection on our website. We have researchers who are experts at creating the right content for the templates. So you do not have to invest time in any additional work. Just grab the template now and use them. This PowerPoint template is designed to present a detailed comparison between actual financial performance and budgeted projections for gross and net profit. It includes charts, graphs, and tables to effectively illustrate variances, percentage differences, and key financial insights. The template helps in identifying discrepancies, evaluating financial strategies, and guiding corrective measures. Ideal for finance professionals, analysts, and business executives for quarterly, annual, or project-based financial reviews.
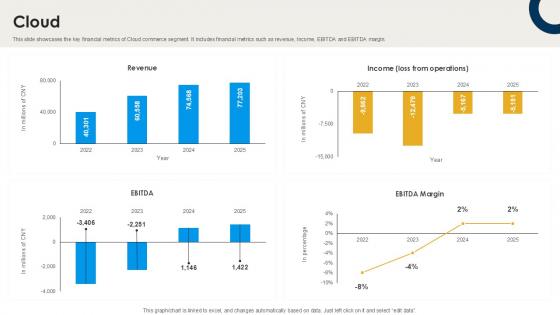
Cloud International Trade Of Products And Services PPT Sample CP SS V
This slide showcases the key financial metrics of Cloud commerce segment. It includes financial metrics such as revenue, Income, EBITDA and EBITDA margin. Do you have to make sure that everyone on your team knows about any specific topic I yes, then you should give Cloud International Trade Of Products And Services PPT Sample CP SS V a try. Our experts have put a lot of knowledge and effort into creating this impeccable Cloud International Trade Of Products And Services PPT Sample CP SS V. You can use this template for your upcoming presentations, as the slides are perfect to represent even the tiniest detail. You can download these templates from the Slidegeeks website and these are easy to edit. So grab these today This slide showcases the key financial metrics of Cloud commerce segment. It includes financial metrics such as revenue, Income, EBITDA and EBITDA margin.
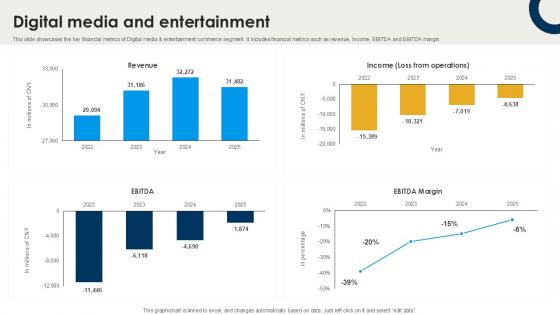
Digital Media And Entertainment International Trade Of Products And Services PPT Example CP SS V
This slide showcases the key financial metrics of Digital media and entertainment commerce segment. It includes financial metrics such as revenue, Income, EBITDA and EBITDA margin. Whether you have daily or monthly meetings, a brilliant presentation is necessary. Digital Media And Entertainment International Trade Of Products And Services PPT Example CP SS V can be your best option for delivering a presentation. Represent everything in detail using Digital Media And Entertainment International Trade Of Products And Services PPT Example CP SS V and make yourself stand out in meetings. The template is versatile and follows a structure that will cater to your requirements. All the templates prepared by Slidegeeks are easy to download and edit. Our research experts have taken care of the corporate themes as well. So, give it a try and see the results. This slide showcases the key financial metrics of Digital media and entertainment commerce segment. It includes financial metrics such as revenue, Income, EBITDA and EBITDA margin.
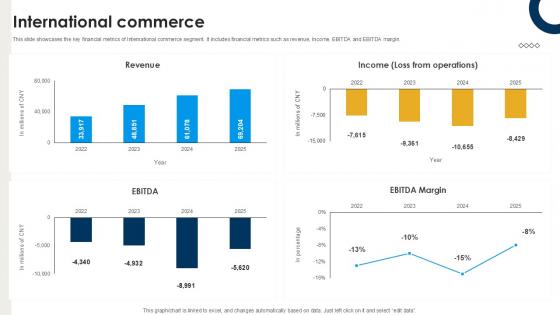
International Commerce International Trade Of Products And Services PPT Presentation CP SS V
This slide showcases the key financial metrics of International commerce segment. It includes financial metrics such as revenue, Income, EBITDA and EBITDA margin. Coming up with a presentation necessitates that the majority of the effort goes into the content and the message you intend to convey. The visuals of a PowerPoint presentation can only be effective if it supplements and supports the story that is being told. Keeping this in mind our experts created International Commerce International Trade Of Products And Services PPT Presentation CP SS V to reduce the time that goes into designing the presentation. This way, you can concentrate on the message while our designers take care of providing you with the right template for the situation. This slide showcases the key financial metrics of International commerce segment. It includes financial metrics such as revenue, Income, EBITDA and EBITDA margin.
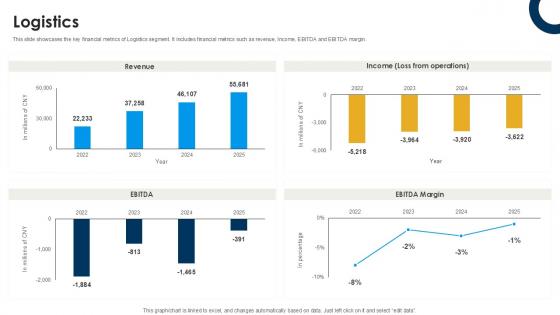
Logistics International Trade Of Products And Services PPT Sample CP SS V
This slide showcases the key financial metrics of Logistics segment. It includes financial metrics such as revenue, Income, EBITDA and EBITDA margin. Explore a selection of the finest Logistics International Trade Of Products And Services PPT Sample CP SS V here. With a plethora of professionally designed and pre-made slide templates, you can quickly and easily find the right one for your upcoming presentation. You can use our Logistics International Trade Of Products And Services PPT Sample CP SS V to effectively convey your message to a wider audience. Slidegeeks has done a lot of research before preparing these presentation templates. The content can be personalized and the slides are highly editable. Grab templates today from Slidegeeks. This slide showcases the key financial metrics of Logistics segment. It includes financial metrics such as revenue, Income, EBITDA and EBITDA margin.
Organizational Alignment Ppt Infographic Template
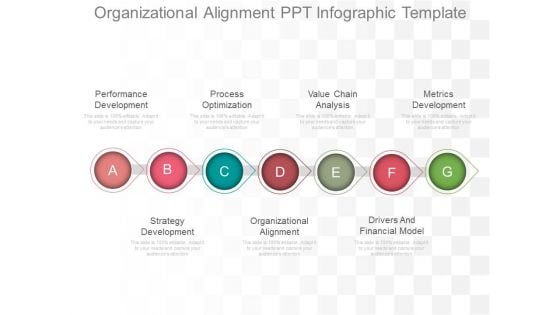
This is a organizational alignment ppt infographic template. This is a seven stage process. The stages in this process are performance development, process optimization, value chain analysis, metrics development, strategy development, organizational alignment, drivers and financial model.
Corporate Balanced Scorecard Diagram Ppt Diagrams
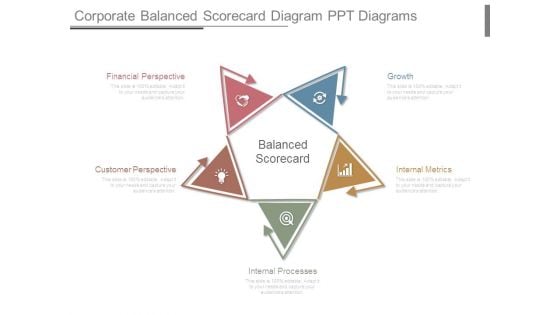
This is a corporate balanced scorecard diagram ppt diagrams. This is a five stage process. The stages in this process are financial perspective, customer perspective, internal processes, growth, internal metrics, balanced scorecard.
Annual Planning Calendar Diagram Powerpoint Guide
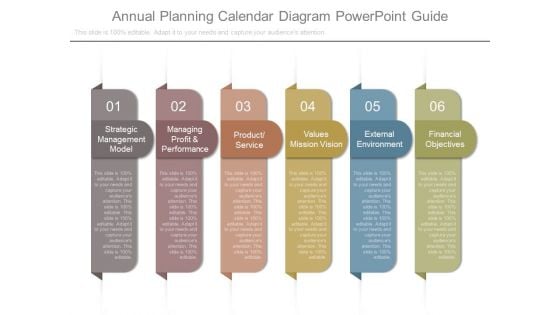
This is a annual planning calendar diagram powerpoint guide. This is a six stage process. The stages in this process are strategic management model, managing profit and performance, product service, values mission vision, external environment, financial objectives.
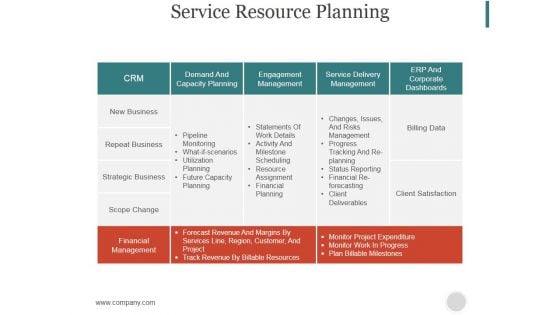
Service Resource Planning Ppt PowerPoint Presentation Styles
This is a service resource planning ppt powerpoint presentation styles. This is a five stage process. The stages in this process are crm, demand and capacity planning, engagement management, service delivery management, erp and corporate dashboards, financial management.
Sales Motivation Outline Ppt PowerPoint Presentation Icon
This is a sales motivation outline ppt powerpoint presentation icon. This is a seven stage process. The stages in this process are sales performance dashboard template, sales target for current financial year, talk about the mission, encourage leadership, personalize rewards.
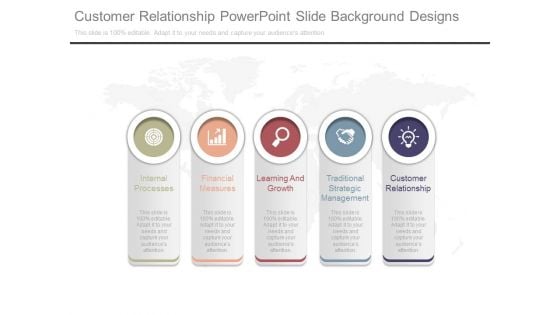
Customer Relationship Powerpoint Slide Background Designs
This is a customer relationship powerpoint slide background designs. This is a five stage process. The stages in this process are internal processes, financial measures, learning and growth, traditional strategic management, customer relationship.
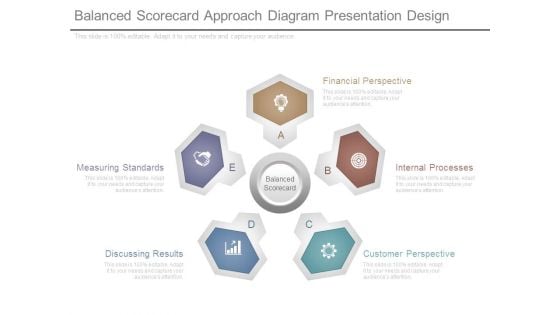
Balanced Scorecard Approach Diagram Presentation Design
This is a balanced scorecard approach diagram presentation design. This is a five stage process. The stages in this process are measuring standards, discussing results, customer perspective, internal processes, financial perspective, balanced scorecard.
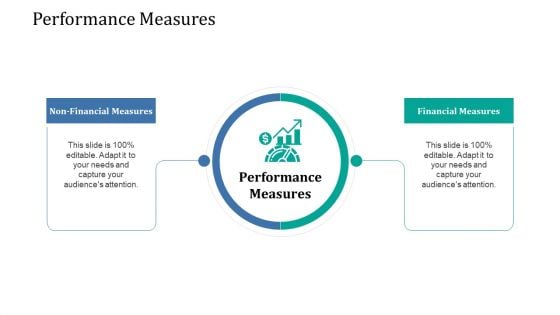
Supply Network Management Growth Performance Measures Rules PDF
This is a supply network management growth performance measures rules pdf template with various stages. Focus and dispense information on two stages using this creative set, that comes with editable features. It contains large content boxes to add your information on topics like non financial measures, financial measures. You can also showcase facts, figures, and other relevant content using this PPT layout. Grab it now.
Multiple Phases For Supply Chain Management Performance Measures Themes PDF
This is a multiple phases for supply chain management performance measures themes pdf template with various stages. Focus and dispense information on two stages using this creative set, that comes with editable features. It contains large content boxes to add your information on topics like non financial measures, financial measures. You can also showcase facts, figures, and other relevant content using this PPT layout. Grab it now.

Planning And Predicting Of Logistics Management Performance Measures Professional PDF
This is a planning and predicting of logistics management performance measures professional pdf. template with various stages. Focus and dispense information on two stages using this creative set, that comes with editable features. It contains large content boxes to add your information on topics like non financial measures, financial measures. You can also showcase facts, figures, and other relevant content using this PPT layout. Grab it now.
Logistics Dashboard For XYZ Logistic Company Orders Slides PDF
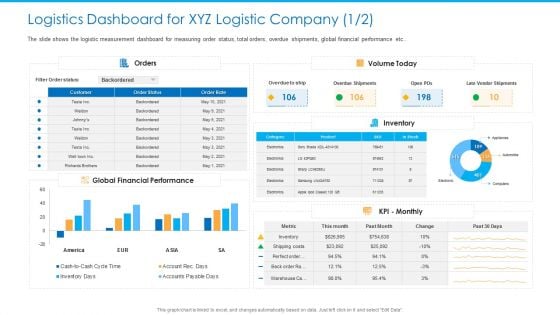
The slide shows the logistic measurement dashboard for measuring order status, total orders, overdue shipments, global financial performance etc.Deliver and pitch your topic in the best possible manner with this logistics dashboard for xyz logistic company orders slides pdf. Use them to share invaluable insights on global financial performance, overdue shipments, late vendor shipments and impress your audience. This template can be altered and modified as per your expectations. So, grab it now.
Goals And Measures For Effective Business Growth Template PDF
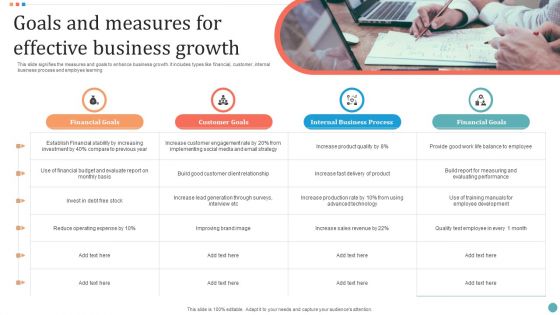
This slide signifies the measures and goals to enhance business growth. It includes types like financial, customer, internal business process and employee learning. Presenting Goals And Measures For Effective Business Growth Template PDF to dispense important information. This template comprises five stages. It also presents valuable insights into the topics including Financial Goals, Customer Goals, Internal Business Process. This is a completely customizable PowerPoint theme that can be put to use immediately. So, download it and address the topic impactfully.
Dashboard Related To Logistic Company Electronics Ideas PDF
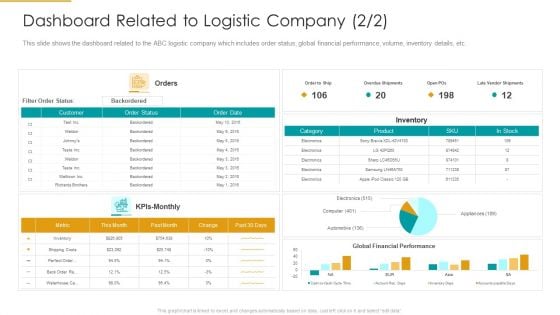
This slide shows the dashboard related to the ABC logistic company which includes order status, global financial performance, volume, inventory details, etc. Deliver an awe inspiring pitch with this creative dashboard related to logistic company electronics ideas pdf bundle. Topics like inventory, global financial performance, product can be discussed with this completely editable template. It is available for immediate download depending on the needs and requirements of the user.

Roadmap Five Year Professional Development Plan Clipart Pdf
This slide highlights a 5 Year financial planning roadmap. This template aims to provide a sample roadmap for developing a 5 year financial career plan by achieving a diversified portfolio, debt free status, and a strong emergency fund. It includes goals such as reducing debt, starting an emergency fund, etc. Pitch your topic with ease and precision using this Roadmap Five Year Professional Development Plan Clipart Pdf. This layout presents information on Success Metric, Benefits, Process. It is also available for immediate download and adjustment. So, changes can be made in the color, design, graphics or any other component to create a unique layout. This slide highlights a 5 Year financial planning roadmap. This template aims to provide a sample roadmap for developing a 5 year financial career plan by achieving a diversified portfolio, debt free status, and a strong emergency fund. It includes goals such as reducing debt, starting an emergency fund, etc.
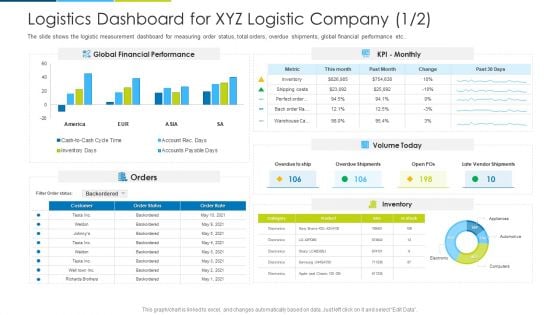
Logistics Dashboard For XYZ Logistic Company Orders Ppt Infographic Template Diagrams PDF
The slide shows the logistic measurement dashboard for measuring order status, total orders, overdue shipments, global financial performance etc. Deliver and pitch your topic in the best possible manner with this logistics dashboard for xyz logistic company orders ppt infographic template diagrams pdf. Use them to share invaluable insights on global financial performance, orders, inventory and impress your audience. This template can be altered and modified as per your expectations. So, grab it now.
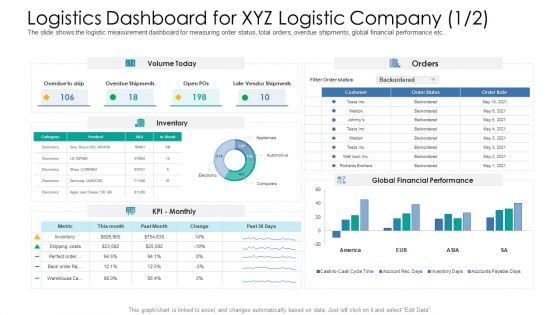
Logistics Dashboard For XYZ Logistic Company Inventory Ppt Infographic Template Background PDF
The slide shows the logistic measurement dashboard for measuring order status, total orders, overdue shipments, global financial performance etc.Deliver and pitch your topic in the best possible manner with this logistics dashboard for XYZ logistic company inventory ppt infographic template background pdf. Use them to share invaluable insights on global financial performance, orders, volume today and impress your audience. This template can be altered and modified as per your expectations. So, grab it now.
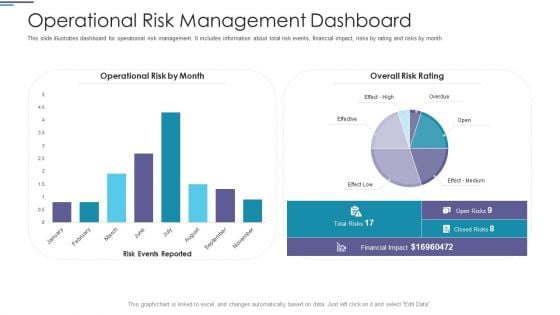
Operational Risk Management Dashboard Ppt PowerPoint Presentation Styles Pictures PDF
This slide illustrates dashboard for operational risk management. It includes information about total risk events, financial impact, risks by rating and risks by month.Deliver an awe-inspiring pitch with this creative operational risk management dashboard ppt powerpoint presentation styles pictures pdf. bundle. Topics like financial impact, operational risk by month, overall risk rating can be discussed with this completely editable template. It is available for immediate download depending on the needs and requirements of the user.
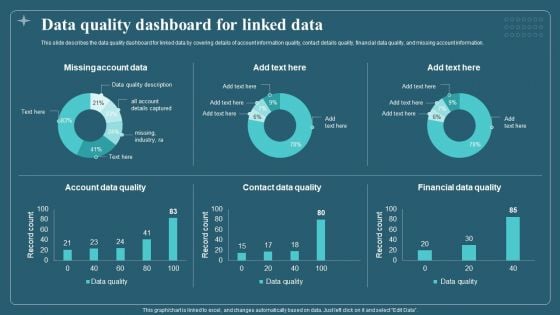
Data Quality Dashboard For Linked Data Download PDF
This slide describes the data quality dashboard for linked data by covering details of account information quality, contact details quality, financial data quality, and missing account information. Deliver an awe inspiring pitch with this creative Data Quality Dashboard For Linked Data Download PDF bundle. Topics like Account Data Quality, Contact Data Quality, Financial Data Quality can be discussed with this completely editable template. It is available for immediate download depending on the needs and requirements of the user.
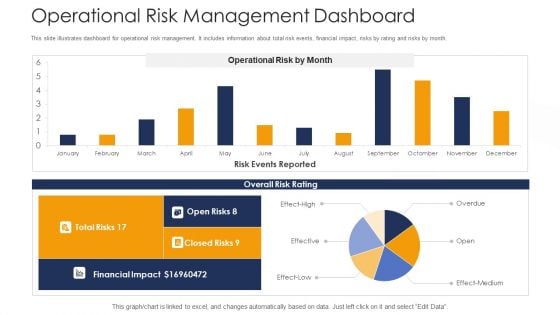
Strategies To Tackle Operational Risk In Banking Institutions Operational Risk Management Dashboard Structure PDF
This slide illustrates dashboard for operational risk management. It includes information about total risk events, financial impact, risks by rating and risks by month. Deliver an awe inspiring pitch with this creative strategies to tackle operational risk in banking institutions operational risk management dashboard structure pdf bundle. Topics like financial impact, operational risk management dashboard can be discussed with this completely editable template. It is available for immediate download depending on the needs and requirements of the user.
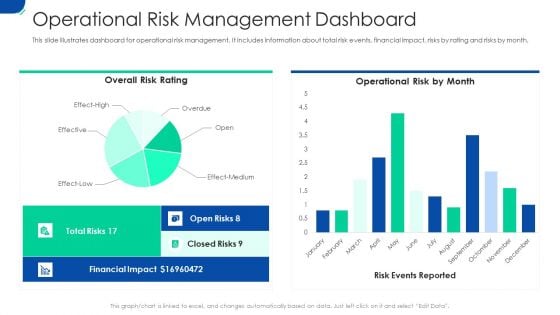
Initiating Hazard Managing Structure Firm Operational Risk Management Dashboard Brochure PDF
This slide illustrates dashboard for operational risk management. It includes information about total risk events, financial impact, risks by rating and risks by month. Deliver an awe-inspiring pitch with this creative initiating hazard managing structure firm operational risk management dashboard brochure pdf bundle. Topics like financial impact, operational risk, risk events, risk rating can be discussed with this completely editable template. It is available for immediate download depending on the needs and requirements of the user.
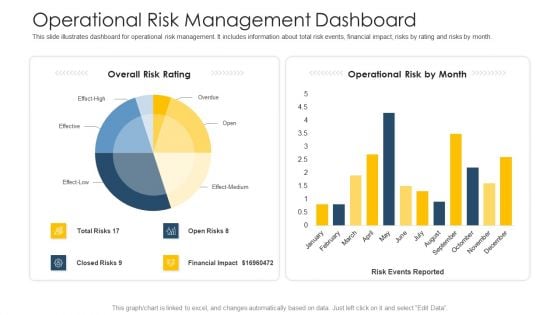
Establishing Operational Risk Framework Banking Operational Risk Management Dashboard Slides PDF
This slide illustrates dashboard for operational risk management. It includes information about total risk events, financial impact, risks by rating and risks by month. Deliver and pitch your topic in the best possible manner with this establishing operational risk framework banking operational risk management dashboard slides pdf. Use them to share invaluable insights on financial impact, operational risk, overall risk rating and impress your audience. This template can be altered and modified as per your expectations. So, grab it now.
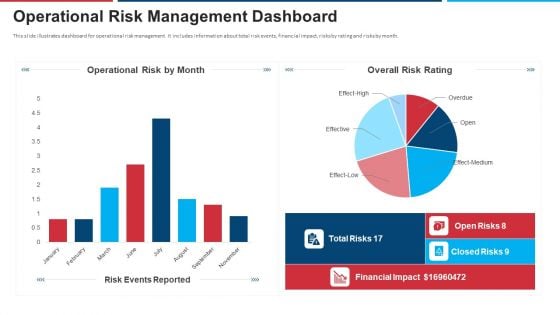
Mitigation Strategies For Operational Threat Operational Risk Management Dashboard Ppt Layouts Example PDF
This slide illustrates dashboard for operational risk management. It includes information about total risk events, financial impact, risks by rating and risks by month. Deliver and pitch your topic in the best possible manner with this mitigation strategies for operational threat operational risk management dashboard ppt layouts example pdf. Use them to share invaluable insights on financial, effective, operational risk, overall risk rating and impress your audience. This template can be altered and modified as per your expectations. So, grab it now.
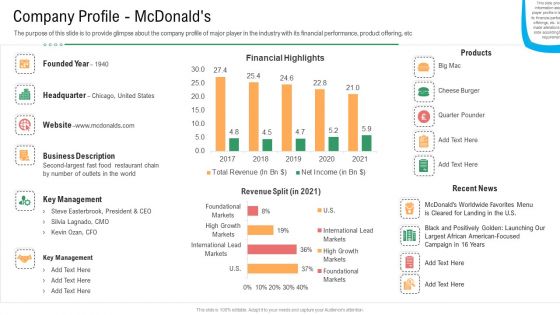
Company Profile Mcdonaldsmerchandise Industry Operational Plan For Business Startup Microsoft PDF
The purpose of this slide is to provide glimpse about the company profile of major player in the industry with its financial performance, product offering, etc. Deliver an awe inspiring pitch with this creative company profile mcdonaldsmerchandise industry operational plan for business startup microsoft pdf bundle. Topics like financial, performance, product, industry, growth can be discussed with this completely editable template. It is available for immediate download depending on the needs and requirements of the user.


 Continue with Email

 Home
Home


