Financial Snapshot
Product And Customer Performance Tracking Dashboard Summary PDF
This slide provides information regarding dashboard utilized by firm to monitor performance of products offered and customer associated. The performance is tracked through revenues generated, new customer acquired, customer satisfaction, sales comparison, etc. If you are looking for a format to display your unique thoughts, then the professionally designed Product And Customer Performance Tracking Dashboard Summary PDF is the one for you. You can use it as a Google Slides template or a PowerPoint template. Incorporate impressive visuals, symbols, images, and other charts. Modify or reorganize the text boxes as you desire. Experiment with shade schemes and font pairings. Alter, share or cooperate with other people on your work. Download Product And Customer Performance Tracking Dashboard Summary PDF and find out how to give a successful presentation. Present a perfect display to your team and make your presentation unforgettable.
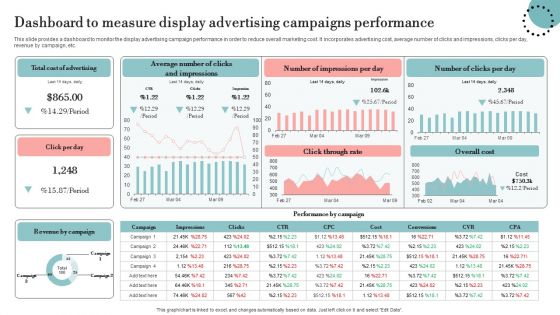
Dashboard To Measure Display Advertising Campaigns Performance Graphics PDF
This slide provides a dashboard to monitor the display advertising campaign performance in order to reduce overall marketing cost. It incorporates advertising cost, average number of clicks and impressions, clicks per day, revenue by campaign, etc. Formulating a presentation can take up a lot of effort and time, so the content and message should always be the primary focus. The visuals of the PowerPoint can enhance the presenters message, so our Dashboard To Measure Display Advertising Campaigns Performance Graphics PDF was created to help save time. Instead of worrying about the design, the presenter can concentrate on the message while our designers work on creating the ideal templates for whatever situation is needed. Slidegeeks has experts for everything from amazing designs to valuable content, we have put everything into Dashboard To Measure Display Advertising Campaigns Performance Graphics PDF
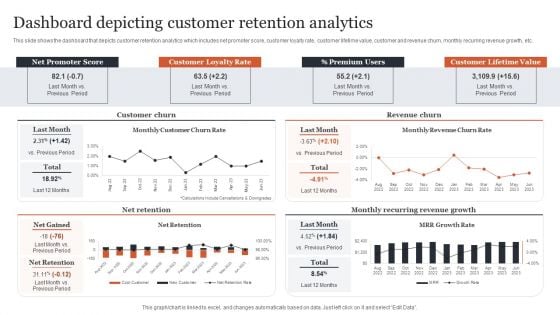
CRM Administration To Reduce Churn Rate Dashboard Depicting Customer Retention Analytics Themes PDF
This slide shows the dashboard that depicts customer retention analytics which includes net promoter score, customer loyalty rate, customer lifetime value, customer and revenue churn, monthly recurring revenue growth, etc. Make sure to capture your audiences attention in your business displays with our gratis customizable CRM Administration To Reduce Churn Rate Dashboard Depicting Customer Retention Analytics Themes PDF. These are great for business strategies, office conferences, capital raising or task suggestions. If you desire to acquire more customers for your tech business and ensure they stay satisfied, create your own sales presentation with these plain slides.

Most Common Predictive Analytics Software Developing Strategic Insights Using Big Data Analytics SS V
This slide showcases major software providers for predictive analytics based on company revenue. It provides information regarding companies such as microsoft, siemens, IBM corporation, oracle , google cloud and SAS institute inc. Make sure to capture your audiences attention in your business displays with our gratis customizable Most Common Predictive Analytics Software Developing Strategic Insights Using Big Data Analytics SS V. These are great for business strategies, office conferences, capital raising or task suggestions. If you desire to acquire more customers for your tech business and ensure they stay satisfied, create your own sales presentation with these plain slides. This slide showcases major software providers for predictive analytics based on company revenue. It provides information regarding companies such as microsoft, siemens, IBM corporation, oracle , google cloud and SAS institute inc.
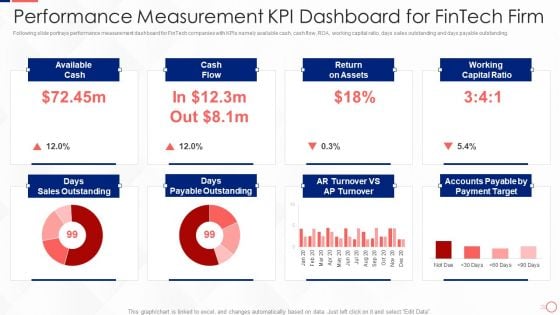
Investing In Tech Innovation Performance Measurement Kpi Dashboard For Fintech Firm Mockup PDF
Following slide portrays performance measurement dashboard for FinTech companies with KPIs namely available cash, cash flow, ROA, working capital ratio, days sales outstanding and days payable outstanding. Deliver and pitch your topic in the best possible manner with this Investing In Tech Innovation Performance Measurement Kpi Dashboard For Fintech Firm Mockup PDF. Use them to share invaluable insights on Available Cash, Cash Flow, Return on Assets, Working Capital Ratio and impress your audience. This template can be altered and modified as per your expectations. So, grab it now.
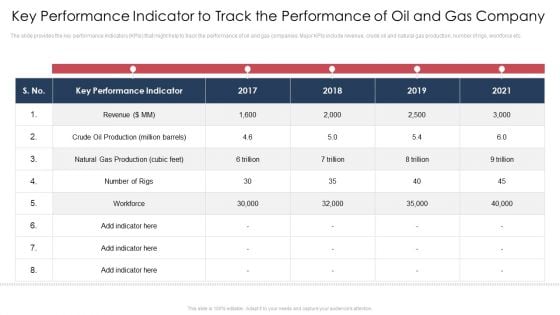
Key Performance Indicator To Track The Performance Of Oil And Gas Company Slides PDF
The slide provides the key performance indicators KPIs that might help to track the performance of oil and gas companies. Major KPIs include revenue, crude oil and natural gas production, number of rigs, workforce etc.Deliver and pitch your topic in the best possible manner with this key performance indicator to track the performance of oil and gas company slides pdf. Use them to share invaluable insights on revenue, crude oil production, natural gas production and impress your audience. This template can be altered and modified as per your expectations. So, grab it now.
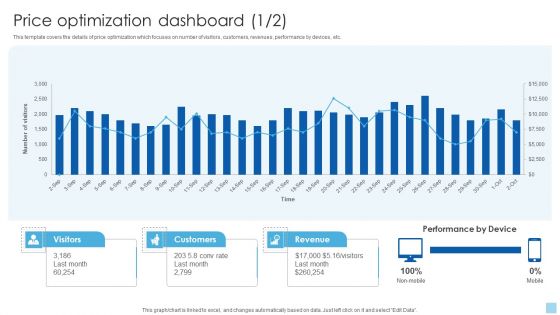
Strategies To Select Effective Price Optimization Dashboard Graphics PDF
This template covers the details of price optimization which focuses on number of visitors, customers, revenues, performance by devices, etc. Here you can discover an assortment of the finest PowerPoint and Google Slides templates. With these templates, you can create presentations for a variety of purposes while simultaneously providing your audience with an eye-catching visual experience. Download Strategies To Select Effective Price Optimization Dashboard Graphics PDF to deliver an impeccable presentation. These templates will make your job of preparing presentations much quicker, yet still, maintain a high level of quality. Slidegeeks has experienced researchers who prepare these templates and write high-quality content for you. Later on, you can personalize the content by editing the Strategies To Select Effective Price Optimization Dashboard Graphics PDF.
Dashboard For Tracking Brand Awareness Advertisement Campaign Results Designs PDF
This slide showcases dashboard that can help organization to track results of online advertisement campaigns. Its key components ad impressions, click through rate, cost per conversion, revenue per click, impressions, new users and sessions.Are you in need of a template that can accommodate all of your creative concepts This one is crafted professionally and can be altered to fit any style. Use it with Google Slides or PowerPoint. Include striking photographs, symbols, depictions, and other visuals. Fill, move around, or remove text boxes as desired. Test out color palettes and font mixtures. Edit and save your work, or work with colleagues. Download Dashboard For Tracking Brand Awareness Advertisement Campaign Results Designs PDF and observe how to make your presentation outstanding. Give an impeccable presentation to your group and make your presentation unforgettable.
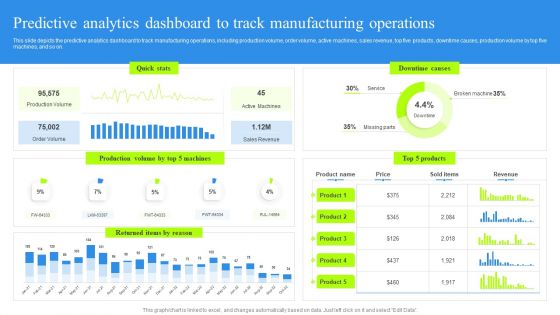
Predictive Analytics Dashboard To Track Manufacturing Operations Rules PDF
This slide depicts the predictive analytics dashboard to track manufacturing operations, including production volume, order volume, active machines, sales revenue, top five products, downtime causes, production volume by top five machines, and so on. Present like a pro with Predictive Analytics Dashboard To Track Manufacturing Operations Rules PDF Create beautiful presentations together with your team, using our easy-to-use presentation slides. Share your ideas in real-time and make changes on the fly by downloading our templates. So whether you are in the office, on the go, or in a remote location, you can stay in sync with your team and present your ideas with confidence. With Slidegeeks presentation got a whole lot easier. Grab these presentations today.
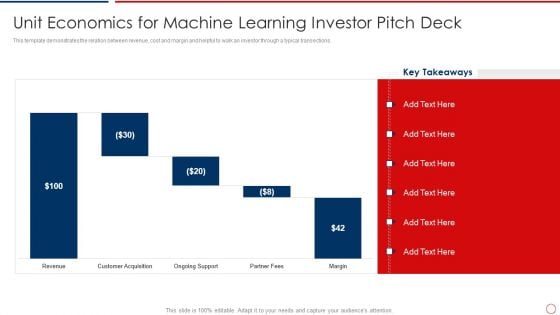
Unit Economics For Machine Learning Investor Pitch Deck Ppt Pictures Background Images PDF
This template demonstrates the relation between revenue, cost and margin and helpful to walk an investor through a typical transections. Deliver an awe inspiring pitch with this creative unit economics for machine learning investor pitch deck ppt pictures background images pdf bundle. Topics like unit economics for machine learning investor pitch deck can be discussed with this completely editable template. It is available for immediate download depending on the needs and requirements of the user.

Key Performance Indicators To Track Effectiveness Of Traditional Marketing Strategies Demonstration PDF
The following slide outlines different metrics through which marketing team can evaluate success of offline marketing techniques. The key metrics outlined in slide are reach, new visitors, patient satisfaction rate, revenue, and partnerships. Find highly impressive Key Performance Indicators To Track Effectiveness Of Traditional Marketing Strategies Demonstration PDF on Slidegeeks to deliver a meaningful presentation. You can save an ample amount of time using these presentation templates. No need to worry to prepare everything from scratch because Slidegeeks experts have already done a huge research and work for you. You need to download Key Performance Indicators To Track Effectiveness Of Traditional Marketing Strategies Demonstration PDF for your upcoming presentation. All the presentation templates are 100 percent editable and you can change the color and personalize the content accordingly. Download now
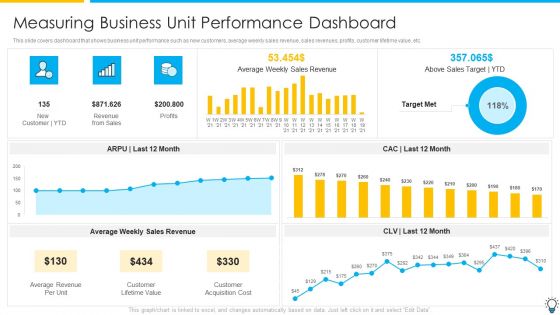
Assuring Management In Product Innovation To Enhance Processes Measuring Business Unit Performance Dashboard Inspiration PDF
This slide covers dashboard that shows business unit performance such as new customers, average weekly sales revenue, sales revenues, profits, customer lifetime value, etc.Deliver an awe inspiring pitch with this creative assuring management in product innovation to enhance processes measuring business unit performance dashboard inspiration pdf bundle. Topics like average weekly sales revenue, customer lifetime value, customer acquisition cost can be discussed with this completely editable template. It is available for immediate download depending on the needs and requirements of the user.
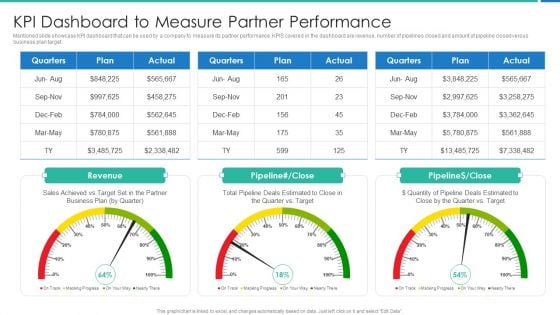
Strong Business Partnership To Ensure Company Success KPI Dashboard To Measure Partner Performance Sample PDF
Mentioned slide showcase KPI dashboard that can be used by a company to measure its partner performance. KPIS covered in the dashboard are revenue, number of pipelines closed and amount of pipeline closed versus business plan target.Deliver an awe inspiring pitch with this creative strong business partnership to ensure company success kpi dashboard to measure partner performance sample pdf bundle. Topics like kpi dashboard to measure partner performance can be discussed with this completely editable template. It is available for immediate download depending on the needs and requirements of the user.
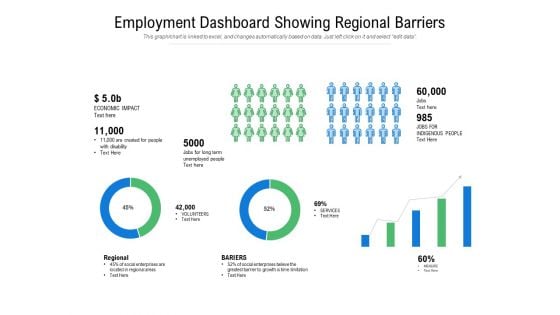
Employment Dashboard Showing Regional Barriers Ppt PowerPoint Presentation Infographic Template Examples PDF
Showcasing this set of slides titled employment dashboard showing regional barriers ppt powerpoint presentation infographic template examples pdf. The topics addressed in these templates are regional, Barriers, economic impact, jobs for long term unemployed people. All the content presented in this PPT design is completely editable. Download it and make adjustments in color, background, font etc. as per your unique business setting.
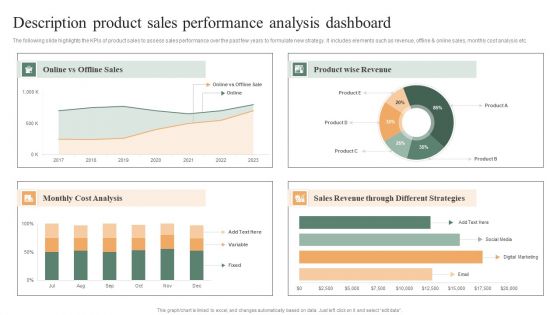
Description Product Sales Performance Analysis Dashboard Ppt PowerPoint Presentation File Samples PDF
The following slide highlights the KPIs of product sales to assess sales performance over the past few years to formulate new strategy. It includes elements such as revenue, offline and online sales, monthly cost analysis etc. Pitch your topic with ease and precision using this Description Product Sales Performance Analysis Dashboard Ppt PowerPoint Presentation File Samples PDF. This layout presents information on Product Wise Revenue, Monthly Cost Analysis, Sales Revenue, Different Strategies. It is also available for immediate download and adjustment. So, changes can be made in the color, design, graphics or any other component to create a unique layout.
Business To Business Sales Playbook B2B Sales Representatives Performance Tracking Dashboard Introduction PDF
This slide provides information regarding B2B sales representatives performance tracking dashboard to measure leads by region, revenue breakdown, top performers by leads, revenues, etc. Deliver and pitch your topic in the best possible manner with this business to business sales playbook b2b sales representatives performance tracking dashboard introduction pdf. Use them to share invaluable insights on b2b sales representatives performance tracking dashboard and impress your audience. This template can be altered and modified as per your expectations. So, grab it now.
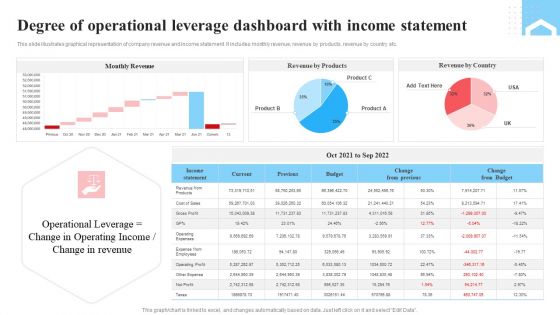
Degree Of Operational Leverage Dashboard With Income Statement Ppt Infographics Layout PDF
This slide illustrates graphical representation of company revenue and income statement. It includes monthly revenue, revenue by products, revenue by country etc. Pitch your topic with ease and precision using this Degree Of Operational Leverage Dashboard With Income Statement Ppt Infographics Layout PDF. This layout presents information on Monthly Revenue, Income Statement, Product. It is also available for immediate download and adjustment. So, changes can be made in the color, design, graphics or any other component to create a unique layout.
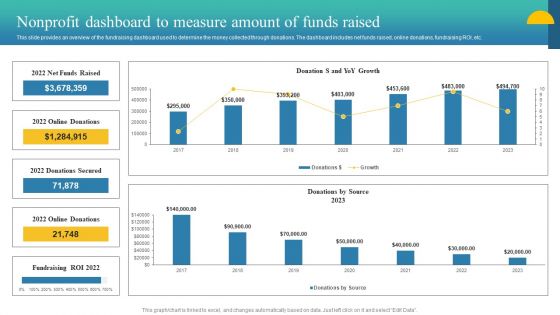
Charity Fundraising Marketing Plan Nonprofit Dashboard To Measure Amount Sample PDF
This slide provides an overview of the fundraising dashboard used to determine the money collected through donations. The dashboard includes net funds raised, online donations, fundraising ROI, etc. Slidegeeks is one of the best resources for PowerPoint templates. You can download easily and regulate Charity Fundraising Marketing Plan Nonprofit Dashboard To Measure Amount Sample PDF for your personal presentations from our wonderful collection. A few clicks is all it takes to discover and get the most relevant and appropriate templates. Use our Templates to add a unique zing and appeal to your presentation and meetings. All the slides are easy to edit and you can use them even for advertisement purposes.
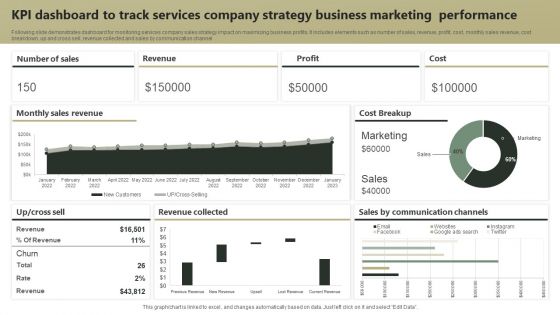
KPI Dashboard To Track Services Company Strategy Business Marketing Performance Guidelines PDF
Following slide demonstrates dashboard for monitoring services company sales strategy impact on maximizing business profits. It includes elements such as number of sales, revenue, profit, cost, monthly sales revenue, cost breakdown, up and cross sell, revenue collected and sales by communication channel. Showcasing this set of slides titled KPI Dashboard To Track Services Company Strategy Business Marketing Performance Guidelines PDF. The topics addressed in these templates are Revenue, Profit, Cost. All the content presented in this PPT design is completely editable. Download it and make adjustments in color, background, font etc. as per your unique business setting.
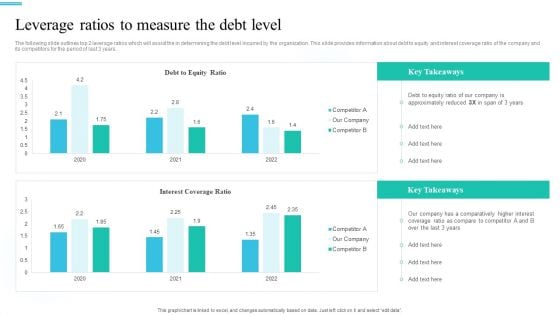
Monetary Planning And Evaluation Guide Leverage Ratios To Measure The Debt Level Ppt Infographics Show PDF
The following slide outlines top 2 leverage ratios which will assist the in determining the debt level incurred by the organization. This slide provides information about debt to equity and interest coverage ratio of the company and its competitors for the period of last 3 years. This modern and well-arranged Monetary Planning And Evaluation Guide Leverage Ratios To Measure The Debt Level Ppt Infographics Show PDF provides lots of creative possibilities. It is very simple to customize and edit with the Powerpoint Software. Just drag and drop your pictures into the shapes. All facets of this template can be edited with Powerpoint no extra software is necessary. Add your own material, put your images in the places assigned for them, adjust the colors, and then you can show your slides to the world, with an animated slide included.
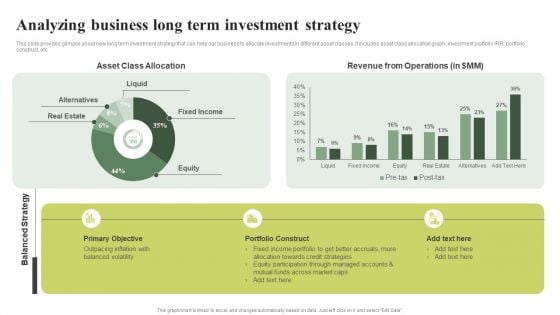
Analyzing Business Long Term Investment Strategy Effective Planning For Monetary Mockup PDF
This slide provides glimpse about new long term investment strategy that can help our business to allocate investments in different asset classes. It includes asset class allocation graph, investment portfolio IRR, portfolio construct, etc.This modern and well-arranged Analyzing Business Long Term Investment Strategy Effective Planning For Monetary Mockup PDF provides lots of creative possibilities. It is very simple to customize and edit with the Powerpoint Software. Just drag and drop your pictures into the shapes. All facets of this template can be edited with Powerpoint no extra software is necessary. Add your own material, put your images in the places assigned for them, adjust the colors, and then you can show your slides to the world, with an animated slide included.
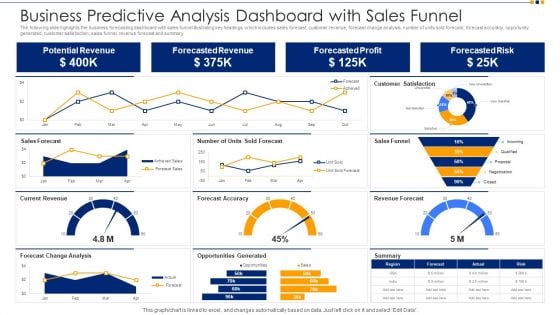
Business Predictive Analysis Dashboard With Sales Funnel Ppt Show Images PDF
The following slide highlights the business forecasting dashboard with sales funnel illustrating key headings which includes sales forecast, customer revenue, forecast change analysis, number of units sold forecast, forecast accuracy, opportunity generated, customer satisfaction, sales funnel, revenue forecast and summary. Pitch your topic with ease and precision using this business predictive analysis dashboard with sales funnel ppt show images pdf. This layout presents information on potential revenue, forecasted revenue, forecasted profit, forecasted risk. It is also available for immediate download and adjustment. So, changes can be made in the color, design, graphics or any other component to create a unique layout.
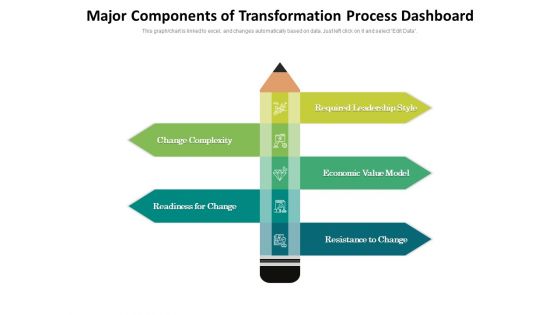
Major Components Of Transformation Process Dashboard Ppt PowerPoint Presentation Infographics Deck PDF
Presenting this set of slides with name major components of transformation process dashboard ppt powerpoint presentation infographics deck pdf. This is a five stage process. The stages in this process are required leadership style, economic value model, resistance to change, readiness for change, change complexity. This is a completely editable PowerPoint presentation and is available for immediate download. Download now and impress your audience.

Deploying And Managing Recurring Key Metrices For Revenue Model Pictures PDF
The purpose of the following slide is to compare various revenue models based on different metrices such as Annual recurring revenue, Average revenue per unit, customer conversion rate, customer net profitability and customer churn rate. Find highly impressive Deploying And Managing Recurring Key Metrices For Revenue Model Pictures PDF on Slidegeeks to deliver a meaningful presentation. You can save an ample amount of time using these presentation templates. No need to worry to prepare everything from scratch because Slidegeeks experts have already done a huge research and work for you. You need to download Deploying And Managing Recurring Key Metrices For Revenue Model Pictures PDF for your upcoming presentation. All the presentation templates are 100 percent editable and you can change the color and personalize the content accordingly. Download now.

Recurring Income Generation Model Key Metrices For Revenue Model Pictures PDF
The purpose of the following slide is to compare various revenue models based on different metrices such as Annual recurring revenue, Average revenue per unit, customer conversion rate, customer net profitability and customer churn rate. This Recurring Income Generation Model Key Metrices For Revenue Model Pictures PDF is perfect for any presentation, be it in front of clients or colleagues. It is a versatile and stylish solution for organizing your meetings. The Recurring Income Generation Model Key Metrices For Revenue Model Pictures PDF features a modern design for your presentation meetings. The adjustable and customizable slides provide unlimited possibilities for acing up your presentation. Slidegeeks has done all the homework before launching the product for you. So, do not wait, grab the presentation templates today
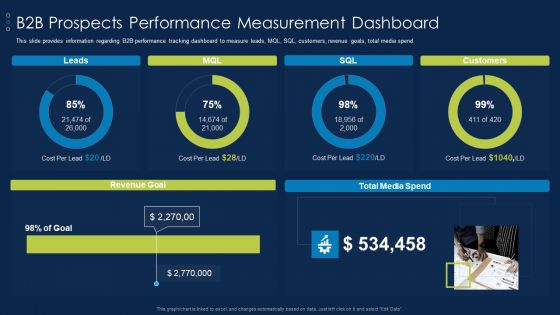
Business To Business Account B2B Prospects Performance Measurement Dashboard Slides PDF
This slide provides information regarding B2B performance tracking dashboard to measure leads, MQL, SQL, customers, revenue goals, total media spend. Deliver an awe inspiring pitch with this creative Business To Business Account B2B Prospects Performance Measurement Dashboard Slides PDF bundle. Topics like Leads, MQL, SQL, Customers, Total Media Spend, Revenue Goal can be discussed with this completely editable template. It is available for immediate download depending on the needs and requirements of the user.
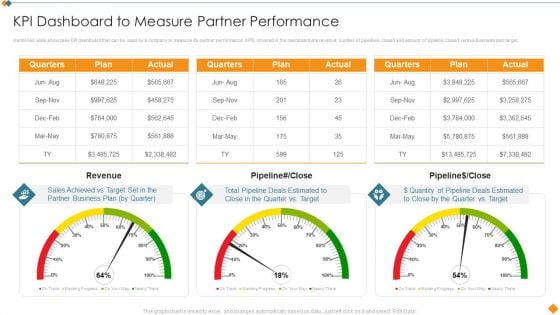
Maintaining Partner Relationships KPI Dashboard To Measure Partner Performance Structure PDF
Mentioned slide showcase KPI dashboard that can be used by a company to measure its partner performance. KPIS covered in the dashboard are revenue, number of pipelines closed and amount of pipeline closed versus business plan target. Deliver an awe inspiring pitch with this creative Maintaining Partner Relationships KPI Dashboard To Measure Partner Performance Structure PDF bundle. Topics like Quarters, Plan, Actual, Revenue, Pipeline can be discussed with this completely editable template. It is available for immediate download depending on the needs and requirements of the user.
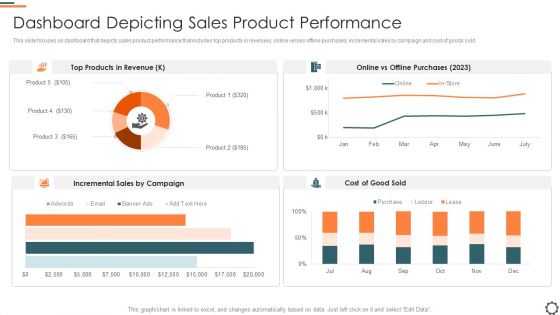
Agile Group For Product Development Dashboard Depicting Sales Product Performance Pictures PDF
This slide focuses on dashboard that depicts sales product performance that includes top products in revenues, online verses offline purchases, incremental sales by campaign and cost of goods sold. Deliver and pitch your topic in the best possible manner with this agile group for product development dashboard depicting sales product performance pictures pdf. Use them to share invaluable insights on dashboard depicting sales product performance and impress your audience. This template can be altered and modified as per your expectations. So, grab it now.
Stock Photo Business Growth Strategy Coins Concept Of Money Pictures Images
Control The Fall Of The Dice With Our stock photo business growth strategy coins concept of money pictures images. Your Forecasts Will Come Out Correct. Our marketing Can Control Fate. The Dice Will Fall As Per Your Call.
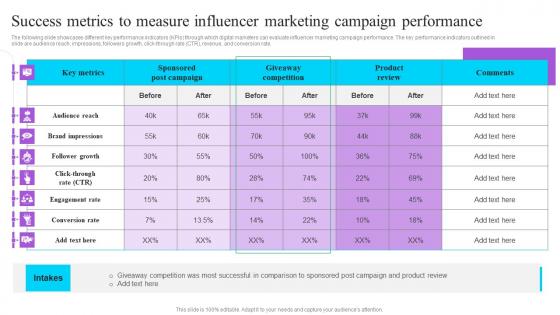
Success Metrics To Measure Influencer Marketing Campaign Performance Effective GTM Techniques Summary PDF
The following slide showcases different key performance indicators KPIs through which digital marketers can evaluate influencer marketing campaign performance. The key performance indicators outlined in slide are audience reach, impressions, followers growth, click-through rate CTR, revenue, and conversion rate. Present like a pro with Success Metrics To Measure Influencer Marketing Campaign Performance Effective GTM Techniques Summary PDF Create beautiful presentations together with your team, using our easy-to-use presentation slides. Share your ideas in real-time and make changes on the fly by downloading our templates. So whether you are in the office, on the go, or in a remote location, you can stay in sync with your team and present your ideas with confidence. With Slidegeeks presentation got a whole lot easier. Grab these presentations today. The following slide showcases different key performance indicators KPIs through which digital marketers can evaluate influencer marketing campaign performance. The key performance indicators outlined in slide are audience reach, impressions, followers growth, click-through rate CTR, revenue, and conversion rate.
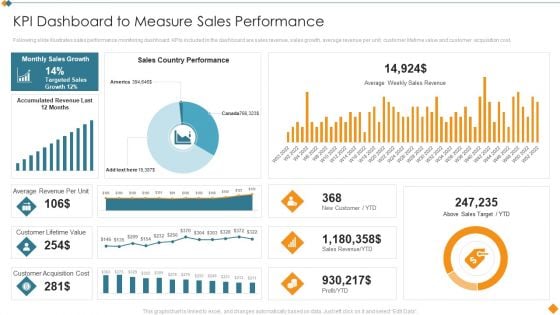
Maintaining Partner Relationships KPI Dashboard To Measure Sales Performance Rules PDF
Following slide illustrates sales performance monitoring dashboard. KPIs included in the dashboard are sales revenue, sales growth, average revenue per unit, customer lifetime value and customer acquisition cost. Deliver and pitch your topic in the best possible manner with this Maintaining Partner Relationships KPI Dashboard To Measure Sales Performance Rules PDF. Use them to share invaluable insights on Sales Country Performance, Above Sales Target, YTD, Customer Lifetime Value, Customer Acquisition Cost and impress your audience. This template can be altered and modified as per your expectations. So, grab it now.
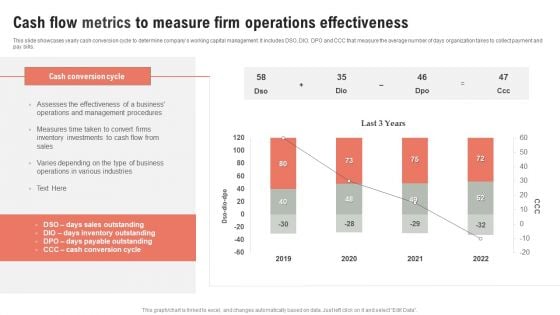
Cash Flow Metrics To Measure Firm Operations Effectiveness Ppt Outline Infographic Template PDF
This slide showcases yearly cash conversion cycle to determine companys working capital management. It includes DSO, DIO, DPO and CCC that measure the average number of days organization takes to collect payment and pay bills. Pitch your topic with ease and precision using this Cash Flow Metrics To Measure Firm Operations Effectiveness Ppt Outline Infographic Template PDF. This layout presents information on Cash Conversion Cycle, 2019 To 2022, Cash Flow. It is also available for immediate download and adjustment. So, changes can be made in the color, design, graphics or any other component to create a unique layout.
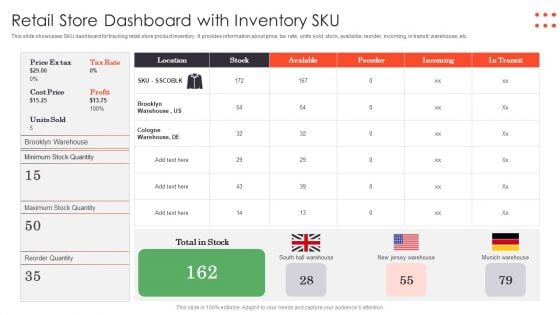
Retail Store Dashboard With Inventory SKU Ppt PowerPoint Presentation Gallery Graphics Template PDF
This slide showcases SKU dashboard for tracking retail store product inventory. It provides information about price, tax rate, units sold, stock, available, reorder, incoming, in transit, warehouse, etc. Showcasing this set of slides titled Retail Store Dashboard With Inventory SKU Ppt PowerPoint Presentation Gallery Graphics Template PDF. The topics addressed in these templates are South Hall Warehouse, New Jersey Warehouse, Munich Warehouse. All the content presented in this PPT design is completely editable. Download it and make adjustments in color, background, font etc. as per your unique business setting.

Marketing Plan Word Cloud With Magnifying Glass Ppt Powerpoint Presentation File Slides
This is a marketing plan word cloud with magnifying glass ppt powerpoint presentation file slides. This is a three stage process. The stages in this process are success, business, motivation, management, always, objectives, item, organizational, money, taking.
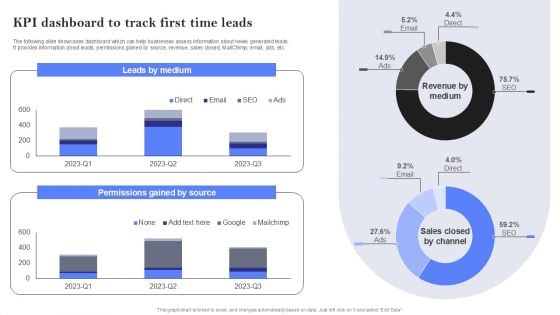
KPI Dashboard To Track First Time Leads Ppt PowerPoint Presentation File Pictures PDF
Organization Investment Yield Dashboard With High Risk Funds Ppt PowerPoint Presentation Icon Example Introduction PDF
This slide displays a dashboard for gains to organization from money invested in securities. It further includes details about current value, ROI, growth, portfolio, number of units, etc. Showcasing this set of slides titled Organization Investment Yield Dashboard With High Risk Funds Ppt PowerPoint Presentation Icon Example Introduction PDF. The topics addressed in these templates are Investment Funds, Investment Profit, Investment Growth. All the content presented in this PPT design is completely editable. Download it and make adjustments in color, background, font etc. as per your unique business setting.
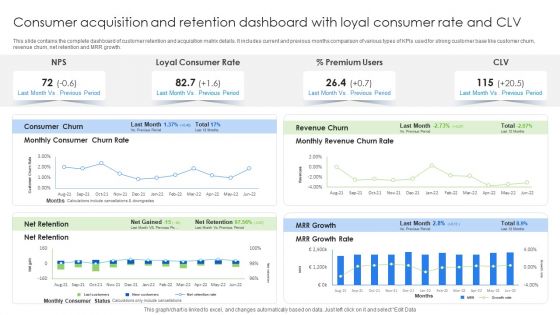
Consumer Acquisition And Retention Dashboard With Loyal Consumer Rate And CLV Brochure PDF
This slide contains the complete dashboard of customer retention and acquisition matrix details. It includes current and previous months comparison of various types of KPIs used for strong customer base like customer churn, revenue churn, net retention and MRR growth. Showcasing this set of slides titled Consumer Acquisition And Retention Dashboard With Loyal Consumer Rate And CLV Brochure PDF. The topics addressed in these templates are Consumer Churn, Revenue Churn, Premium Users. All the content presented in this PPT design is completely editable. Download it and make adjustments in color, background, font etc. as per your unique business setting.
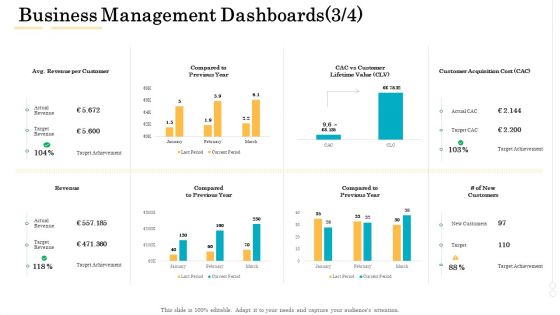
Administrative Regulation Business Management Dashboards Customer Ppt PowerPoint Presentation Images PDF
Deliver an awe-inspiring pitch with this creative administrative regulation business management dashboards customer ppt powerpoint presentation images pdf bundle. Topics like actual revenue, target revenue, target achievement, new customers, customer acquisition cost can be discussed with this completely editable template. It is available for immediate download depending on the needs and requirements of the user.

Sales Optimization Best Practices To Close More Deals Sales KPI Dashboard Accumulated Topics PDF
The sales dashboard is an effective tool that helps in monitoring various sales KPIs in order to aid sales teams in reaching sales goals by analyzing the sales performance. Deliver and pitch your topic in the best possible manner with this sales optimization best practices to close more deals sales kpi dashboard accumulated topics pdf. Use them to share invaluable insights on incremental sales, sales revenue, cost breakdown, accumulated revenue and impress your audience. This template can be altered and modified as per your expectations. So, grab it now.
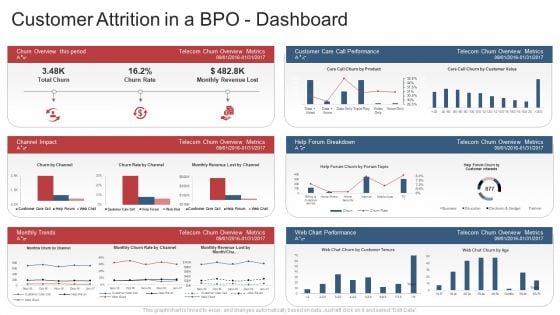
Customer Attrition In A Bpo Dashboard Rate Ppt Slides Designs Download PDF
This slide shows a Customer Attrition Rate Dashboard with KPIs such as Company Revenue , Customer Attrition Rate in 2021 , Annual Growth Rate , Average Customer Queue Time , Onboarding Process Effectiveness etc. Deliver an awe-inspiring pitch with this creative customer attrition in a bpo dashboard rate ppt slides designs download pdf. bundle. Topics like company revenue, customer attrition rate, annual growth rate, customer satisfaction, rate, operational efficiency can be discussed with this completely editable template. It is available for immediate download depending on the needs and requirements of the user.
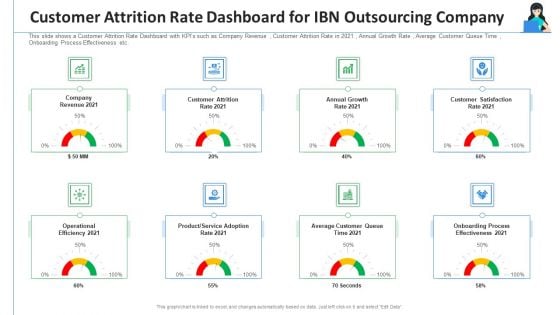
Customer Attrition Rate Dashboard For IBN Outsourcing Company Ppt Ideas Samples PDF
This slide shows a Customer Attrition Rate Dashboard with KPIs such as Company Revenue , Customer Attrition Rate in 2021 , Annual Growth Rate , Average Customer Queue Time , Onboarding Process Effectiveness etc. Deliver and pitch your topic in the best possible manner with this customer attrition rate dashboard for IBN outsourcing company ppt ideas samples pdf. Use them to share invaluable insights on revenue, operational efficiency, product service, onboarding process effectiveness, annual growth and impress your audience. This template can be altered and modified as per your expectations. So, grab it now.
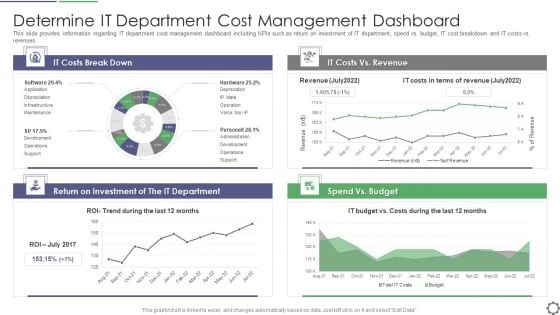
Determine IT Department Cost Management Dashboard Ppt PowerPoint Presentation Gallery Outline PDF
This slide provides information regarding IT department cost management dashboard including KPIs such as return on investment of IT department, spend vs. budget, IT cost breakdown and IT costs vs. revenues. Deliver an awe inspiring pitch with this creative determine it department cost management dashboard ppt powerpoint presentation gallery outline pdf bundle. Topics like it costs break down, it costs vs revenue, spend vs budget, return on investment can be discussed with this completely editable template. It is available for immediate download depending on the needs and requirements of the user.
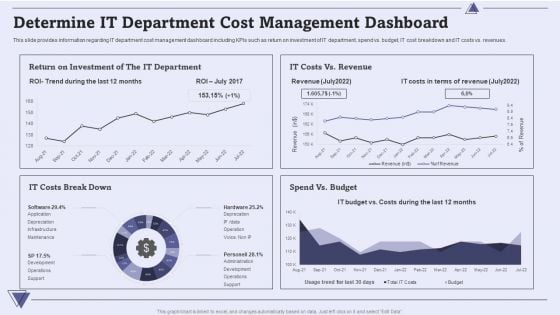
CIO For IT Cost Optimization Techniques Determine IT Department Cost Management Dashboard Introduction PDF
This slide provides information regarding IT department cost management dashboard including KPIs such as return on investment of IT department, spend vs. budget, IT cost breakdown and IT costs vs. revenues. Deliver and pitch your topic in the best possible manner with this CIO For IT Cost Optimization Techniques Determine IT Department Cost Management Dashboard Introduction PDF. Use them to share invaluable insights on Costs, Budget, Revenue and impress your audience. This template can be altered and modified as per your expectations. So, grab it now.
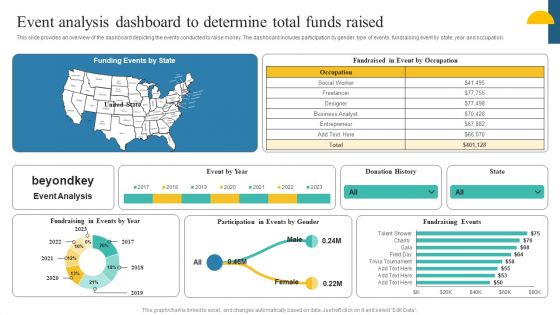
Charity Fundraising Marketing Plan Event Analysis Dashboard To Determine Total Guidelines PDF
This slide provides an overview of the dashboard depicting the events conducted to raise money. The dashboard includes participation by gender, type of events, fundraising event by state, year and occupation. This modern and well-arranged Charity Fundraising Marketing Plan Event Analysis Dashboard To Determine Total Guidelines PDF provides lots of creative possibilities. It is very simple to customize and edit with the Powerpoint Software. Just drag and drop your pictures into the shapes. All facets of this template can be edited with Powerpoint, no extra software is necessary. Add your own material, put your images in the places assigned for them, adjust the colors, and then you can show your slides to the world, with an animated slide included.
Effective NPO Promotional Strategies For Recruit Volunteers Event Analysis Dashboard Determine Total Funds Raised Icons PDF
This slide provides an overview of the dashboard depicting the events conducted to raise money. The dashboard includes participation by gender, type of events, fundraising event by state, year and occupation. This modern and well-arranged Effective NPO Promotional Strategies For Recruit Volunteers Event Analysis Dashboard Determine Total Funds Raised Icons PDF provides lots of creative possibilities. It is very simple to customize and edit with the Powerpoint Software. Just drag and drop your pictures into the shapes. All facets of this template can be edited with Powerpoint, no extra software is necessary. Add your own material, put your images in the places assigned for them, adjust the colors, and then you can show your slides to the world, with an animated slide included.
Controlling Customer Retention Dashboard Customer Purchase Tracking Sales Ppt Portfolio Template PDF
The firm is looking forward to track customer experience by tracking various touchpoints in order to handle issues such customer churn. KPIs mentioned in the dashboard are measured regularly across the organization. Deliver an awe inspiring pitch with this creative controlling customer retention dashboard customer purchase tracking sales ppt portfolio template pdf bundle. Topics like value, product, revenues can be discussed with this completely editable template. It is available for immediate download depending on the needs and requirements of the user.
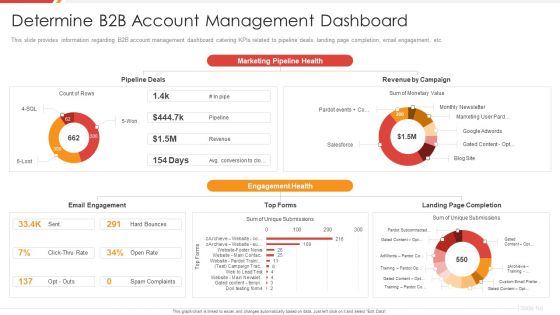
Enhancing B2B Demand Creation And Sales Growth Determine B2B Account Management Dashboard Template PDF
This slide provides information regarding B2B account management dashboard catering KPIs related to pipeline deals, landing page completion, email engagement, etc. Deliver and pitch your topic in the best possible manner with this enhancing b2b demand creation and sales growth determine b2b account management dashboard template pdf. Use them to share invaluable insights on pipeline deals, email engagement, revenue by campaign, landing page completion and impress your audience. This template can be altered and modified as per your expectations. So, grab it now.
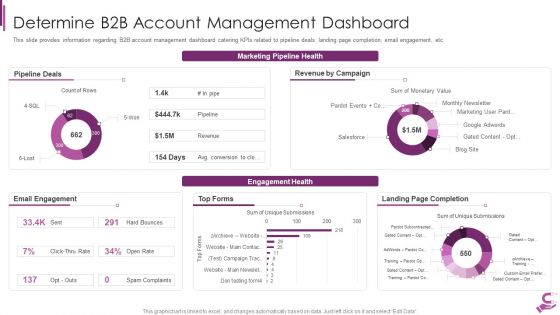
B2B Demand Generation Best Practices Determine B2B Account Management Dashboard Themes PDF
This slide provides information regarding B2B account management dashboard catering KPIs related to pipeline deals, landing page completion, email engagement, etc. Deliver and pitch your topic in the best possible manner with this b2b demand generation best practices determine b2b account management dashboard themes pdf. Use them to share invaluable insights on pipeline deals, revenue by campaign, email engagement, landing page completion, top forms and impress your audience. This template can be altered and modified as per your expectations. So, grab it now.
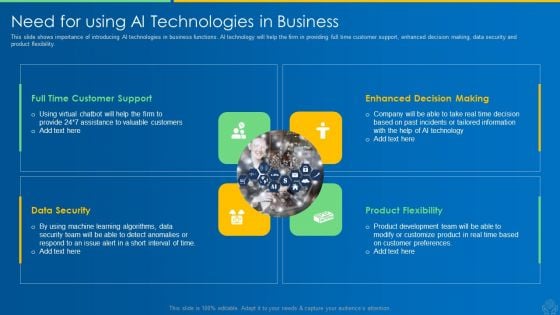
AI And ML Driving Monetary Value For Organization Need For Using AI Technologies In Business Portrait PDF
This slide shows importance of introducing AI technologies in business functions. AI technology will help the firm in providing full time customer support, enhanced decision making, data security and product flexibility. Presenting ai and ml driving monetary value for organization need for using ai technologies in business portrait pdf to provide visual cues and insights. Share and navigate important information on three stages that need your due attention. This template can be used to pitch topics like full time customer support, data security, product flexibility, enhanced decision making. In addtion, this PPT design contains high resolution images, graphics, etc, that are easily editable and available for immediate download.
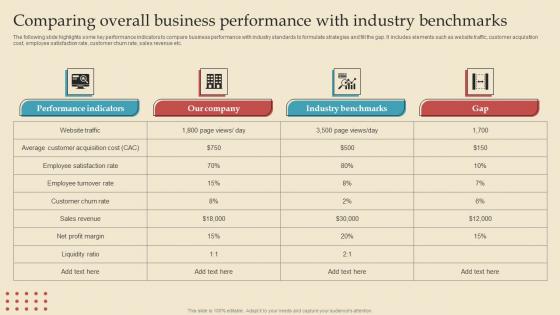
Comparing Overall Benchmarks Describing Business Performance Administration Goals Brochure Pdf
The following slide highlights some key performance indicators to compare business performance with industry standards to formulate strategies and fill the gap. It includes elements such as website traffic, customer acquisition cost, employee satisfaction rate, customer churn rate, sales revenue etc. The Comparing Overall Benchmarks Describing Business Performance Administration Goals Brochure Pdf is a compilation of the most recent design trends as a series of slides. It is suitable for any subject or industry presentation, containing attractive visuals and photo spots for businesses to clearly express their messages. This template contains a variety of slides for the user to input data, such as structures to contrast two elements, bullet points, and slides for written information. Slidegeeks is prepared to create an impression. The following slide highlights some key performance indicators to compare business performance with industry standards to formulate strategies and fill the gap. It includes elements such as website traffic, customer acquisition cost, employee satisfaction rate, customer churn rate, sales revenue etc.
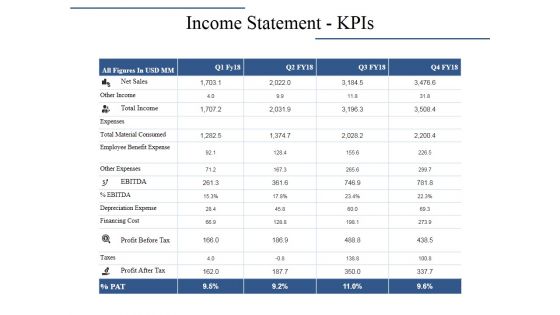
Income Statement Kpis Ppt PowerPoint Presentation Layouts Graphics Pictures
This is a income statement kpis ppt powerpoint presentation layouts graphics pictures. This is a four stage process. The stages in this process are net sales, total income, other income, profit before tax, expenses.
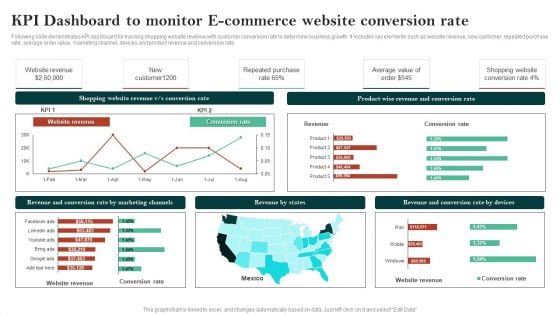
Kpi Dashboard To Monitor E Commerce Website Conversion Rate Clipart PDF
Following slide demonstrates KPI dashboard for tracking shopping website revenue with customer conversion rate to determine business growth. It includes key elements such as website revenue, new customer, repeated purchase rate, average order value, marketing channel, devices and product revenue and conversion rate. Showcasing this set of slides titled Kpi Dashboard To Monitor E Commerce Website Conversion Rate Clipart PDF. The topics addressed in these templates are Shopping Website Revenue, Conversion Rate, Website Revenue. All the content presented in this PPT design is completely editable. Download it and make adjustments in color, background, font etc. as per your unique business setting.
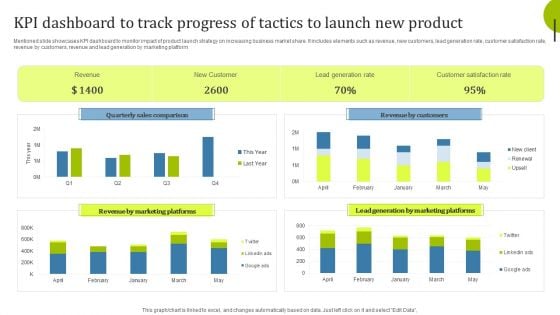
Kpi Dashboard To Track Progress Of Tactics To Launch New Product Infographics PDF
Mentioned slide showcases KPI dashboard to monitor impact of product launch strategy on increasing business market share. It includes elements such as revenue, new customers, lead generation rate, customer satisfaction rate, revenue by customers, revenue and lead generation by marketing platform. Showcasing this set of slides titled Kpi Dashboard To Track Progress Of Tactics To Launch New Product Infographics PDF. The topics addressed in these templates are Quarterly Sales Comparison, Revenue Marketing, Revenue Customers. All the content presented in this PPT design is completely editable. Download it and make adjustments in color, background, font etc. as per your unique business setting.
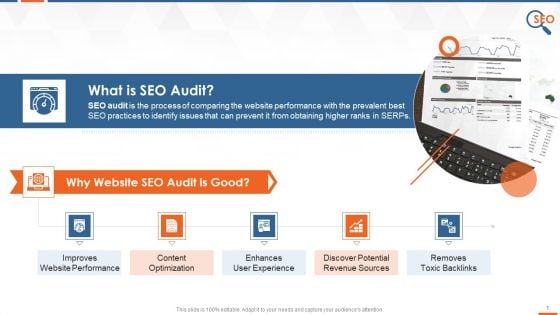
What Is SEO Audit And Its Significance Training Ppt
This slide provides information regarding the SEO audit. It also covers details of its importance in improving website performance, content optimization, enhancing user experience, discovering potential revenue sources, and removing toxic backlinks.
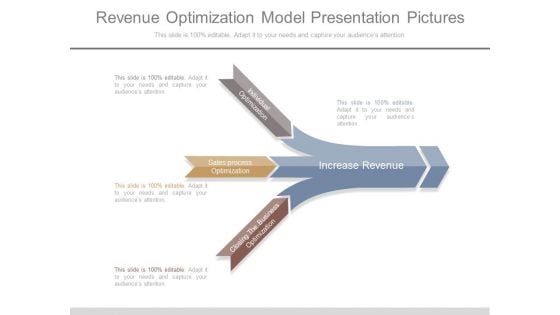
Revenue Optimization Model Presentation Pictures
This is a revenue optimization model presentation pictures. This is a four stage process. The stages in this process are individual optimization, sales process optimization, closing the business optimization, increase revenue.
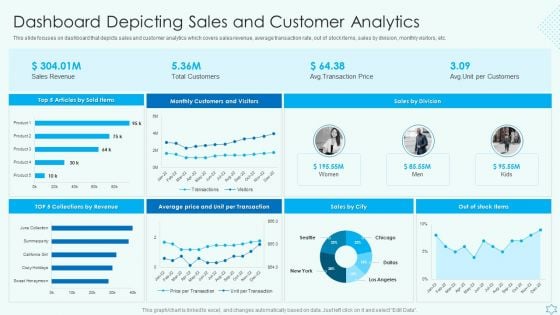
Deploy Merchandise Program To Enhance Sales Dashboard Depicting Sales And Customer Analytics Sample PDF
This slide focuses on dashboard that depicts sales and customer analytics which covers sales revenue, average transaction rate, out of stock items, sales by division, monthly visitors, etc. Make sure to capture your audiences attention in your business displays with our gratis customizable Deploy Merchandise Program To Enhance Sales Dashboard Depicting Sales And Customer Analytics Sample PDF. These are great for business strategies, office conferences, capital raising or task suggestions. If you desire to acquire more customers for your tech business and ensure they stay satisfied, create your own sales presentation with these plain slides.
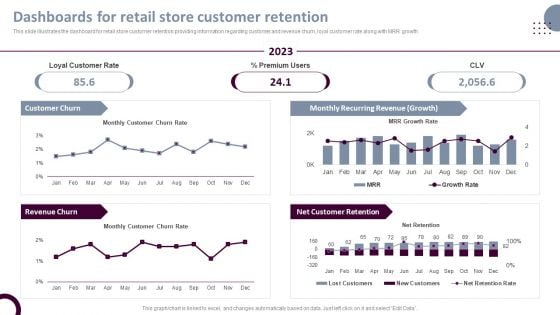
Retail Store Operations Dashboards For Retail Store Customer Retention Clipart PDF
This slide illustrates the dashboard for retail store customer retention providing information regarding customer and revenue churn, loyal customer rate along with MRR growth. Make sure to capture your audiences attention in your business displays with our gratis customizable Retail Store Operations Dashboards For Retail Store Customer Retention Clipart PDF. These are great for business strategies, office conferences, capital raising or task suggestions. If you desire to acquire more customers for your tech business and ensure they stay satisfied, create your own sales presentation with these plain slides.
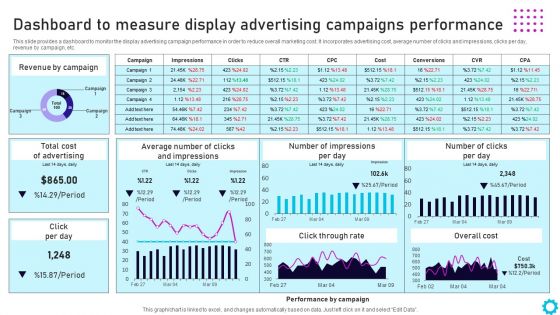
Complete Guide For Display Dashboard To Measure Display Advertising Campaigns Themes PDF
This slide provides a dashboard to monitor the display advertising campaign performance in order to reduce overall marketing cost. It incorporates advertising cost, average number of clicks and impressions, clicks per day, revenue by campaign, etc. Make sure to capture your audiences attention in your business displays with our gratis customizable Complete Guide For Display Dashboard To Measure Display Advertising Campaigns Themes PDF. These are great for business strategies, office conferences, capital raising or task suggestions. If you desire to acquire more customers for your tech business and ensure they stay satisfied, create your own sales presentation with these plain slides.
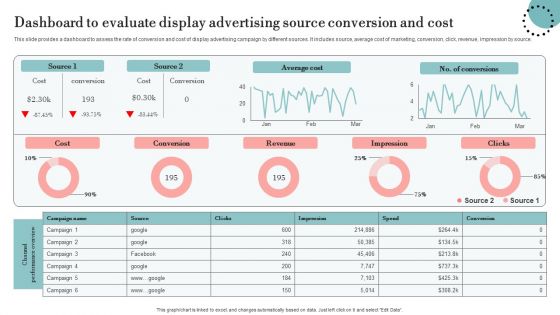
Dashboard To Evaluate Display Advertising Source Conversion And Cost Designs PDF
This slide provides a dashboard to assess the rate of conversion and cost of display advertising campaign by different sources. It includes source, average cost of marketing, conversion, click, revenue, impression by source. Make sure to capture your audiences attention in your business displays with our gratis customizable Dashboard To Evaluate Display Advertising Source Conversion And Cost Designs PDF. These are great for business strategies, office conferences, capital raising or task suggestions. If you desire to acquire more customers for your tech business and ensure they stay satisfied, create your own sales presentation with these plain slides.
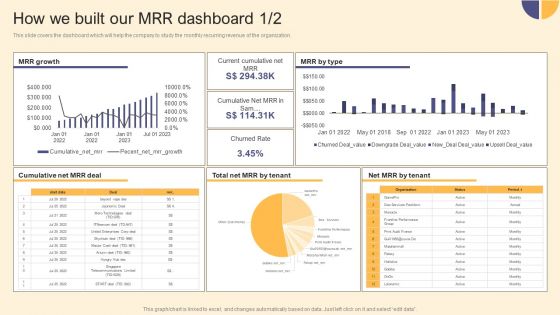
Per Device Pricing Strategy For Managed Solutions How We Built Our MRR Dashboard Infographics PDF
This slide covers the dashboard which will help the company to study the monthly recurring revenue of the organization. Make sure to capture your audiences attention in your business displays with our gratis customizable Per Device Pricing Strategy For Managed Solutions How We Built Our MRR Dashboard Infographics PDF. These are great for business strategies, office conferences, capital raising or task suggestions. If you desire to acquire more customers for your tech business and ensure they stay satisfied, create your own sales presentation with these plain slides.


 Continue with Email

 Home
Home


