Financial Snapshot

Stock Photo Business Plan Strategy Put Money Piggy Bank Pictures Images
Our stock photo business plan strategy put money piggy bank pictures images Abhor Any Flaws. Give Your Expression A Beautiful Background. Honor Your Forefathers With Our Finance. They Also Descend From An Esteemed Ancestry.
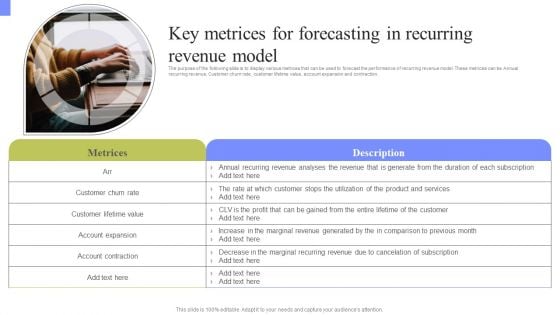
Periodic Revenue Model Key Metrices For Forecasting In Recurring Revenue Model Portrait PDF
The purpose of the following slide is to display various metrices that can be used to forecast the performance of recurring revenue model. These metrices can be Annual recurring revenue, Customer churn rate, customer lifetime value, account expansion and contraction. Find a pre designed and impeccable Periodic Revenue Model Key Metrices For Forecasting In Recurring Revenue Model Portrait PDF. The templates can ace your presentation without additional effort. You can download these easy to edit presentation templates to make your presentation stand out from others. So, what are you waiting for Download the template from Slidegeeks today and give a unique touch to your presentation.
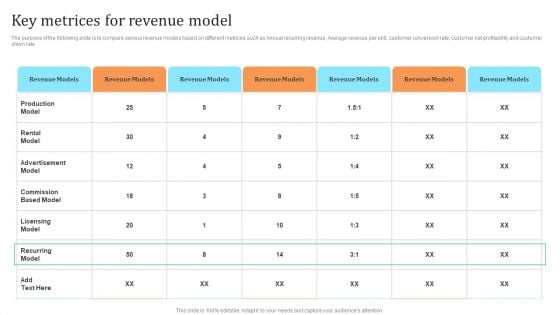
Membership Based Revenue Plan Key Metrices For Revenue Model Inspiration PDF
The purpose of the following slide is to compare various revenue models based on different metrices such as Annual recurring revenue, Average revenue per unit, customer conversion rate, customer net profitability and customer churn rate. If your project calls for a presentation, then Slidegeeks is your go-to partner because we have professionally designed, easy-to-edit templates that are perfect for any presentation. After downloading, you can easily edit Membership Based Revenue Plan Key Metrices For Revenue Model Inspiration PDF and make the changes accordingly. You can rearrange slides or fill them with different images. Check out all the handy templates
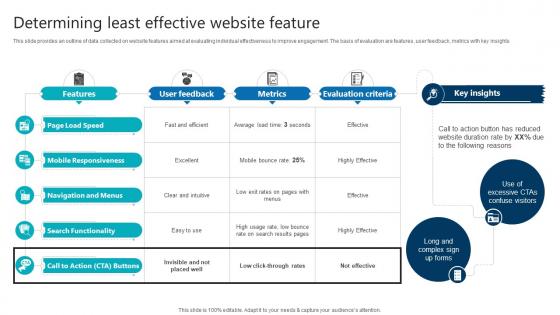
Determining Least Effective Website Feature Product Analytics Implementation Data Analytics V
This slide provides an outline of data collected on website features aimed at evaluating individual effectiveness to improve engagement. The basis of evaluation are features, user feedback, metrics with key insights Make sure to capture your audiences attention in your business displays with our gratis customizable Determining Least Effective Website Feature Product Analytics Implementation Data Analytics V. These are great for business strategies, office conferences, capital raising or task suggestions. If you desire to acquire more customers for your tech business and ensure they stay satisfied, create your own sales presentation with these plain slides. This slide provides an outline of data collected on website features aimed at evaluating individual effectiveness to improve engagement. The basis of evaluation are features, user feedback, metrics with key insights
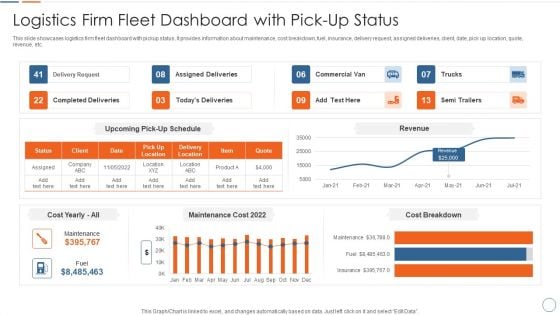
Logistics Firm Fleet Dashboard With Pick Up Status Introduction PDF
This slide showcases logistics firm fleet dashboard with pickup status. It provides information about maintenance, cost breakdown, fuel, insurance, delivery request, assigned deliveries, client, date, pick up location, quote, revenue, etc. Pitch your topic with ease and precision using this Logistics Firm Fleet Dashboard With Pick Up Status Introduction PDF. This layout presents information on Logistics Firm Fleet Dashboard With Pick Up Status. It is also available for immediate download and adjustment. So, changes can be made in the color, design, graphics or any other component to create a unique layout.
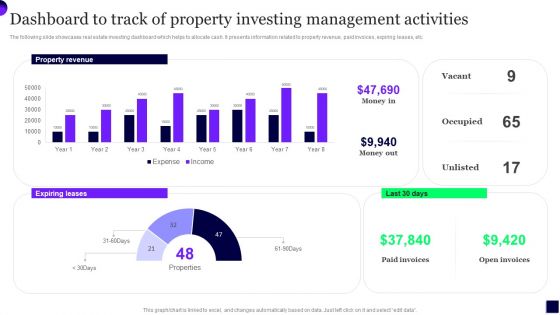
Dashboard To Track Of Property Investing Management Activities Sample PDF
The following slide showcases real estate investing dashboard which helps to allocate cash. It presents information related to property revenue, paid invoices, expiring leases, etc. Pitch your topic with ease and precision using this Dashboard To Track Of Property Investing Management Activities Sample PDF. This layout presents information on Dashboard To Track, Property Investing, Management Activities. It is also available for immediate download and adjustment. So, changes can be made in the color, design, graphics or any other component to create a unique layout.
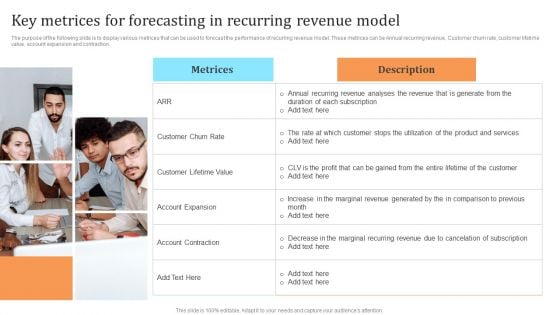
Membership Based Revenue Plan Key Metrices For Forecasting In Recurring Revenue Model Mockup PDF
The purpose of the following slide is to display various metrices that can be used to forecast the performance of recurring revenue model. These metrices can be Annual recurring revenue, Customer churn rate, customer lifetime value, account expansion and contraction. Find highly impressive Membership Based Revenue Plan Key Metrices For Forecasting In Recurring Revenue Model Mockup PDF on Slidegeeks to deliver a meaningful presentation. You can save an ample amount of time using these presentation templates. No need to worry to prepare everything from scratch because Slidegeeks experts have already done a huge research and work for you. You need to download Membership Based Revenue Plan Key Metrices For Forecasting In Recurring Revenue Model Mockup PDF for your upcoming presentation. All the presentation templates are 100 percent editable and you can change the color and personalize the content accordingly. Download now
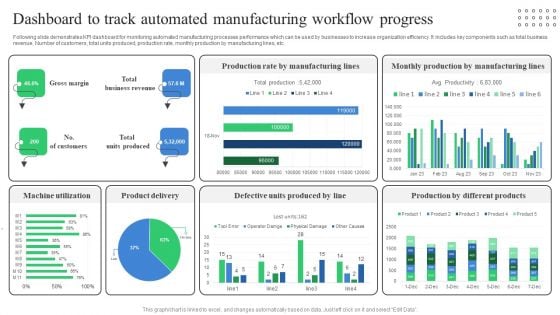
Dashboard To Track Automated Manufacturing Workflow Progress Professional PDF
Following slide demonstrates KPI dashboard for monitoring automated manufacturing processes performance which can be used by businesses to increase organization efficiency. It includes key components such as total business revenue, Number of customers, total units produced, production rate, monthly production by manufacturing lines, etc. Showcasing this set of slides titled Dashboard To Track Automated Manufacturing Workflow Progress Professional PDF. The topics addressed in these templates are Machine Utilization, Product Delivery, Defective Units Produced. All the content presented in this PPT design is completely editable. Download it and make adjustments in color, background, font etc. as per your unique business setting.
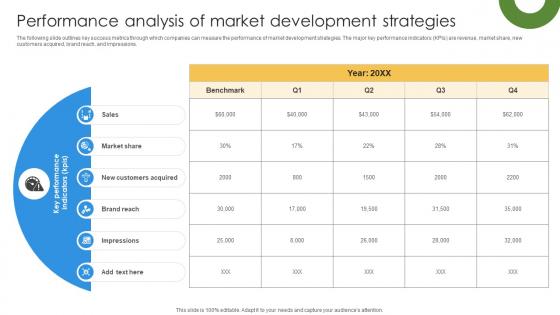
Marketing Growth Strategy Performance Analysis Of Market Development Strategy SS V
The following slide outlines key success metrics through which companies can measure the performance of market development strategies. The major key performance indicators KPIs are revenue, market share, new customers acquired, brand reach, and impressions. This Marketing Growth Strategy Performance Analysis Of Market Development Strategy SS V from Slidegeeks makes it easy to present information on your topic with precision. It provides customization options, so you can make changes to the colors, design, graphics, or any other component to create a unique layout. It is also available for immediate download, so you can begin using it right away. Slidegeeks has done good research to ensure that you have everything you need to make your presentation stand out. Make a name out there for a brilliant performance. The following slide outlines key success metrics through which companies can measure the performance of market development strategies. The major key performance indicators KPIs are revenue, market share, new customers acquired, brand reach, and impressions.
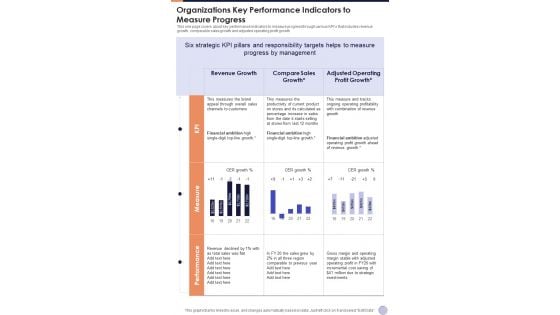
Organizations Key Performance Indicators To Measure Progress One Pager Documents
This one page covers about key performance indicators to measure progress through various KPIs that includes revenue growth, comparable sales growth and adjusted operating profit growth. Presenting you a fantastic Organizations Key Performance Indicators To Measure Progress One Pager Documents. This piece is crafted on hours of research and professional design efforts to ensure you have the best resource. It is completely editable and its design allow you to rehash its elements to suit your needs. Get this Organizations Key Performance Indicators To Measure Progress One Pager Documents A4 One-pager now.

Maintenance KPI Dashboard With Production Volume Ppt Gallery Influencers PDF
This slide presents maintenance dashboard which covers quick stats, top products, returned items, downtime causes with quantity ordered, revenues, sold items, active machines, broken machine, missing parts, price, etc. Showcasing this set of slides titled Maintenance KPI Dashboard With Production Volume Ppt Gallery Influencers PDF. The topics addressed in these templates are Top 5 Products, Downtime Causes Missing, Return Items Active. All the content presented in this PPT design is completely editable. Download it and make adjustments in color, background, font etc. as per your unique business setting.
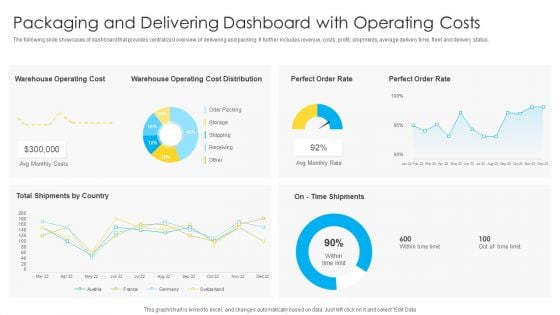
Packaging And Delivering Dashboard With Operating Costs Topics PDF
The following slide showcases of dashboard that provides centralized overview of delivering and packing. It further includes revenue, costs, profit, shipments, average delivery time, fleet and delivery status. Showcasing this set of slides titled Packaging And Delivering Dashboard With Operating Costs Topics PDF. The topics addressed in these templates are Warehouse Operating Cost, Perfect Order Rate, Avg Monthly Costs. All the content presented in this PPT design is completely editable. Download it and make adjustments in color, background, font etc. as per your unique business setting.
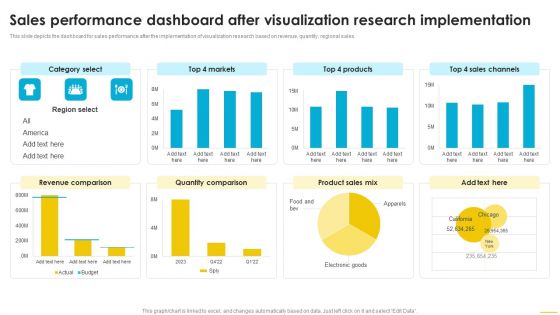
Sales Performance Dashboard After Visualization Research Implementation Introduction PDF
This slide depicts the dashboard for sales performance after the implementation of visualization research based on revenue, quantity, regional sales. Welcome to our selection of the Sales Performance Dashboard After Visualization Research Implementation Introduction PDF. These are designed to help you showcase your creativity and bring your sphere to life. Planning and Innovation are essential for any business that is just starting out. This collection contains the designs that you need for your everyday presentations. All of our PowerPoints are 100 percent editable, so you can customize them to suit your needs. This multi purpose template can be used in various situations. Grab these presentation templates today.
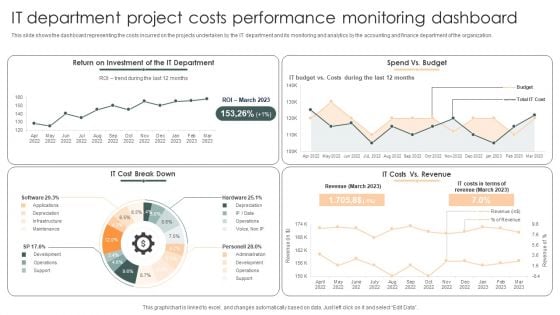
IT Department Project Costs Performance Monitoring Dashboard Demonstration PDF
This slide shows the dashboard representing the costs incurred on the projects undertaken by the IT department and its monitoring and analytics by the accounting and finance department of the organization.Showcasing this set of slides titled IT Department Project Costs Performance Monitoring Dashboard Demonstration PDF. The topics addressed in these templates are Return Investment, Cost Break, Costs Revenue. All the content presented in this PPT design is completely editable. Download it and make adjustments in color, background, font etc. as per your unique business setting.
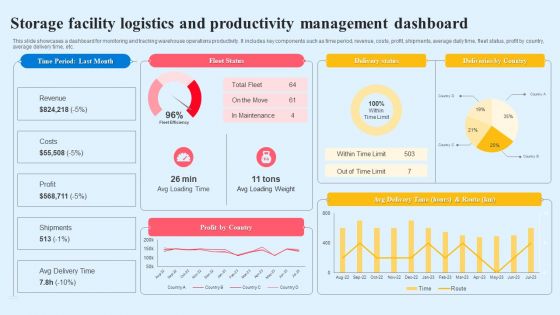
Storage Facility Logistics And Productivity Management Dashboard Summary PDF
This slide showcases a dashboard for monitoring and tracking warehouse operations productivity. It includes key components such as time period, revenue, costs, profit, shipments, average daily time, fleet status, profit by country, average delivery time, etc. Showcasing this set of slides titled Storage Facility Logistics And Productivity Management Dashboard Summary PDF. The topics addressed in these templates are Fleet Status, Delivery Status, Deliveries By Country. All the content presented in this PPT design is completely editable. Download it and make adjustments in color, background, font etc. as per your unique business setting.
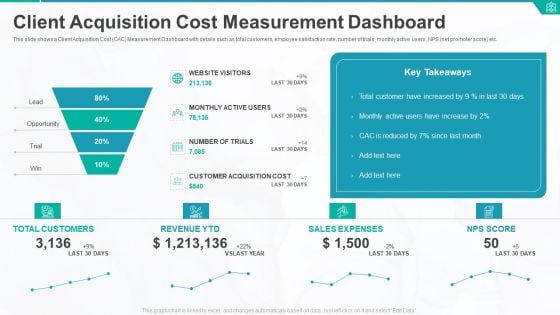
Client Acquisition Cost Measurement Dashboard Ppt Portfolio Graphic Tips PDF
This slide shows a Client Acquisition Cost CAC Measurement Dashboard with details such as total customers, employee satisfaction rate, number of trials, monthly active users, NPS net promoter score etc. Deliver and pitch your topic in the best possible manner with this client acquisition cost measurement dashboard ppt portfolio graphic tips pdf. Use them to share invaluable insights on total customers, revenue, sales expenses, nps score and impress your audience. This template can be altered and modified as per your expectations. So, grab it now.
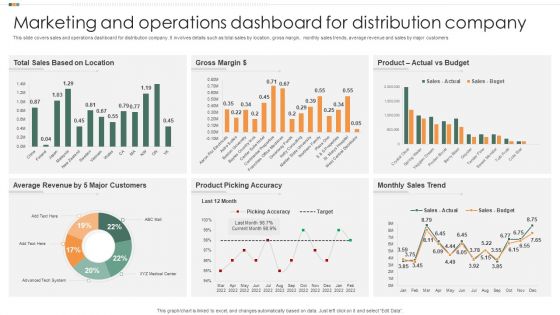
Marketing And Operations Dashboard For Distribution Company Guidelines PDF
This slide covers sales and operations dashboard for distribution company. It involves details such as total sales by location, gross margin, monthly sales trends, average revenue and sales by major customers. Pitch your topic with ease and precision using this Marketing And Operations Dashboard For Distribution Company Guidelines PDF. This layout presents information on Gross Margin, Actual Vs Budget, Product. It is also available for immediate download and adjustment. So, changes can be made in the color, design, graphics or any other component to create a unique layout.
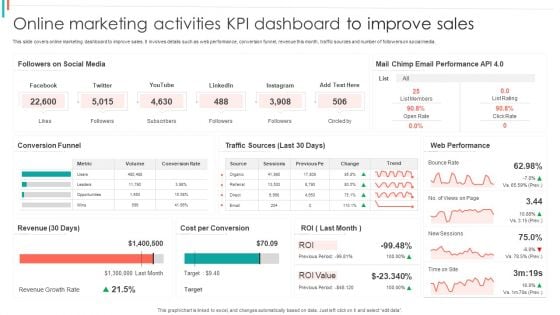
Online Marketing Activities KPI Dashboard To Improve Sales Ideas PDF
This slide covers online marketing dashboard to improve sales. It involves details such as web performance, conversion funnel, revenue this month, traffic sources and number of followers on social media.Pitch your topic with ease and precision using this Online Marketing Activities KPI Dashboard To Improve Sales Ideas PDF. This layout presents information on Email Performance, Web Performance, Cost Conversion. It is also available for immediate download and adjustment. So, changes can be made in the color, design, graphics or any other component to create a unique layout.
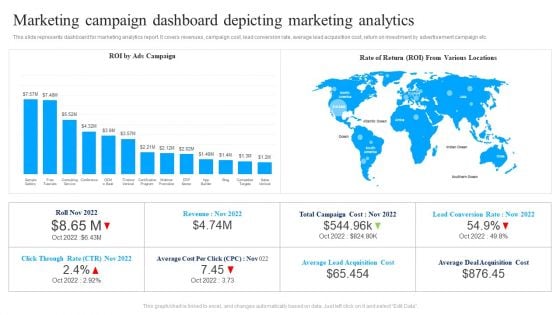
Marketing Campaign Dashboard Depicting Marketing Analytics Ppt Summary Infographics PDF
This slide represents dashboard for marketing analytics report. It covers revenues, campaign cost, lead conversion rate, average lead acquisition cost, return on investment by advertisement campaign etc. Pitch your topic with ease and precision using this Marketing Campaign Dashboard Depicting Marketing Analytics Ppt Summary Infographics PDF. This layout presents information on ROI Ads Campaign, Rate Of Return, Various Locations. It is also available for immediate download and adjustment. So, changes can be made in the color, design, graphics or any other component to create a unique layout.
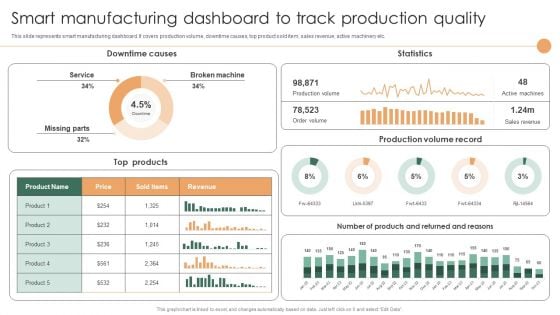
Smart Manufacturing Dashboard To Track Production Quality Rules PDF
This slide represents smart manufacturing dashboard. It covers production volume, downtime causes, top product sold item, sales revenue, active machinery etc.Boost your pitch with our creative Smart Manufacturing Dashboard To Track Production Quality Rules PDF. Deliver an awe-inspiring pitch that will mesmerize everyone. Using these presentation templates you will surely catch everyones attention. You can browse the ppts collection on our website. We have researchers who are experts at creating the right content for the templates. So you do not have to invest time in any additional work. Just grab the template now and use them.
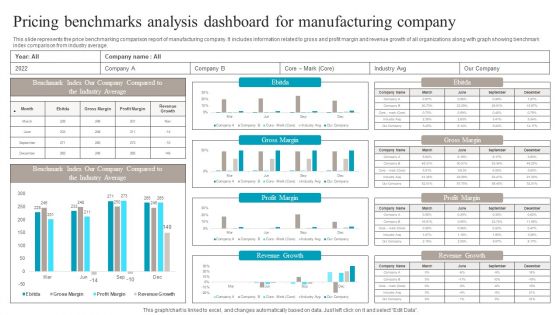
Pricing Benchmarks Analysis Dashboard For Manufacturing Company Structure PDF
This slide represents the price benchmarking comparison report of manufacturing company. It includes information related to gross and profit margin and revenue growth of all organizations along with graph showing benchmark index comparison from industry average. Pitch your topic with ease and precision using this Pricing Benchmarks Analysis Dashboard For Manufacturing Company Structure PDF. This layout presents information on Pricing Benchmarks Analysis, Dashboard For Manufacturing Company. It is also available for immediate download and adjustment. So, changes can be made in the color, design, graphics or any other component to create a unique layout.
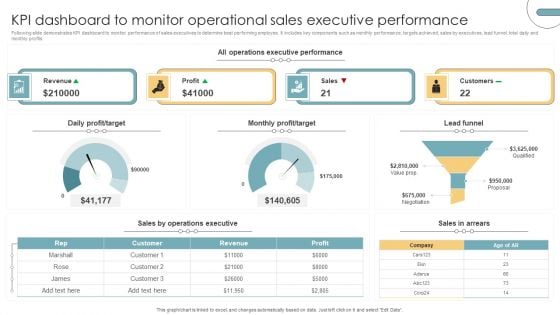
KPI Dashboard To Monitor Operational Sales Executive Performance Portrait PDF
Following slide demonstrates KPI dashboard to monitor performance of sales executives to determine best performing employee. It includes key components such as monthly performance, targets achieved, sales by executives, lead funnel, total daily and monthly profits. Pitch your topic with ease and precision using this KPI Dashboard To Monitor Operational Sales Executive Performance Portrait PDF. This layout presents information on Revenue, Profit, Sales, Customers. It is also available for immediate download and adjustment. So, changes can be made in the color, design, graphics or any other component to create a unique layout.
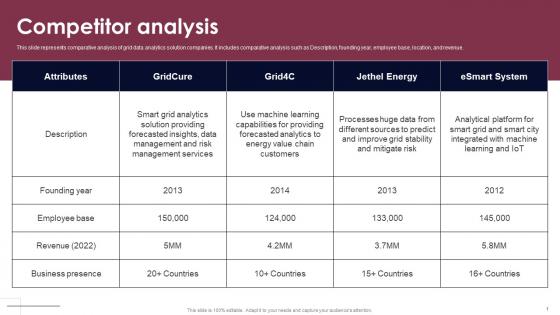
Competitor Analysis Smart Grid Analytics Investor Fund Raising Inspiration PDF
This slide represents comparative analysis of grid data analytics solution companies. It includes comparative analysis such as Description, founding year, employee base, location, and revenue. Want to ace your presentation in front of a live audience Our Competitor Analysis Smart Grid Analytics Investor Fund Raising Inspiration PDF can help you do that by engaging all the users towards you. Slidegeeks experts have put their efforts and expertise into creating these impeccable powerpoint presentations so that you can communicate your ideas clearly. Moreover, all the templates are customizable, and easy-to-edit and downloadable. Use these for both personal and commercial use. This slide represents comparative analysis of grid data analytics solution companies. It includes comparative analysis such as Description, founding year, employee base, location, and revenue.

Dashboard To Measure Workflow Performance Post RPA Implementation Demonstration PDF
This slide presents a dashboard to measure the overall operation performance after RPA implementation. It includes return on investment, bot numbers, saved hours, capital, bots runtime, time saved by bots, and workflow processes. If you are looking for a format to display your unique thoughts, then the professionally designed Dashboard To Measure Workflow Performance Post RPA Implementation Demonstration PDF is the one for you. You can use it as a Google Slides template or a PowerPoint template. Incorporate impressive visuals, symbols, images, and other charts. Modify or reorganize the text boxes as you desire. Experiment with shade schemes and font pairings. Alter, share or cooperate with other people on your work. Download Dashboard To Measure Workflow Performance Post RPA Implementation Demonstration PDF and find out how to give a successful presentation. Present a perfect display to your team and make your presentation unforgettable.
Business Tax Compliance Ppt PowerPoint Presentation Pictures Visual Aids Cpb Pdf
Presenting this set of slides with name business tax compliance ppt powerpoint presentation pictures visual aids cpb pdf. This is an editable Powerpoint three stages graphic that deals with topics like business tax compliance to help convey your message better graphically. This product is a premium product available for immediate download and is 100 percent editable in Powerpoint. Download this now and use it in your presentations to impress your audience.

Tax Deduction Interest Investment Loan Ppt PowerPoint Presentation Show Graphics Pictures Cpb Pdf
Presenting this set of slides with name tax deduction interest investment loan ppt powerpoint presentation show graphics pictures cpb pdf. This is an editable Powerpoint six stages graphic that deals with topics like tax deduction interest investment loan to help convey your message better graphically. This product is a premium product available for immediate download and is 100 percent editable in Powerpoint. Download this now and use it in your presentations to impress your audience.

Stock Photo Marketing Concepts Alarm Clock With Piggy Bank Stock Photo Business Pictures Images
Our stock photo marketing concepts alarm clock with piggy bank stock photo business pictures images Help Avoid Errors. They Wont Let You Put A Foot Wrong. Our Money Help You Find Your Feet. They Acquaint You With The Best Available.
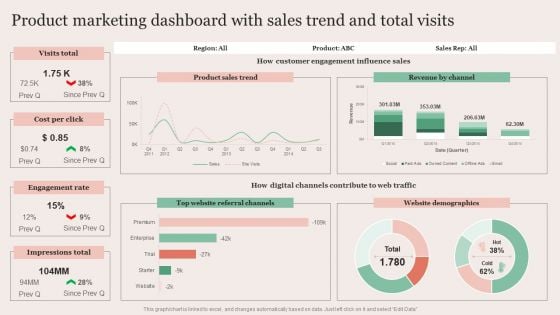
Strategic Brand Promotion For Enhanced Recognition And Revenue Growth Product Marketing Dashboard With Sales Trend Microsoft PDF
Boost your pitch with our creative Strategic Brand Promotion For Enhanced Recognition And Revenue Growth Product Marketing Dashboard With Sales Trend Microsoft PDF. Deliver an awe-inspiring pitch that will mesmerize everyone. Using these presentation templates you will surely catch everyones attention. You can browse the ppts collection on our website. We have researchers who are experts at creating the right content for the templates. So you do not have to invest time in any additional work. Just grab the template now and use them.

Enhance Profit Client Journey Analysis Cart Recovery Dashboard Value Brochure PDF
Measure which email campaigns brought the most recovery, which age group responded the best, and other KPIs via a dashboard. Deliver an awe-inspiring pitch with this creative enhance profit client journey analysis cart recovery dashboard value brochure pdf bundle. Topics like recovery revenue, recovery rate, revenue per email can be discussed with this completely editable template. It is available for immediate download depending on the needs and requirements of the user.
Brand Maintenance Toolkit Rebranding Performance Tracking Dashboard To Track Renewed Brand Designs PDF
This slide provides information regarding rebranding performance tracking dashboard that helps to monitor renewed brand. The KPIs include total spent, Ad spend, average CPM, total revenues, total link clicks, etc. Deliver an awe inspiring pitch with this creative Brand Maintenance Toolkit Rebranding Performance Tracking Dashboard To Track Renewed Brand Designs PDF bundle. Topics like Online Revenues, Offline Sales, Customer Retention can be discussed with this completely editable template. It is available for immediate download depending on the needs and requirements of the user.
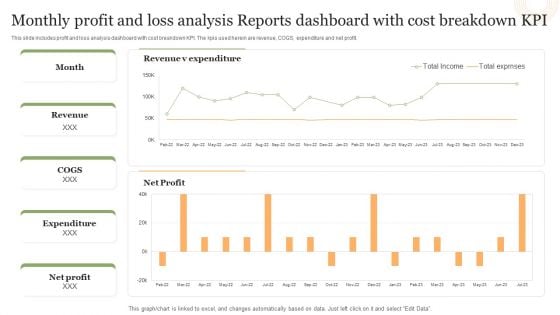
Monthly Profit And Loss Analysis Reports Dashboard With Cost Breakdown Kpi Structure PDF
This slide includes profit and loss analysis dashboard with cost breakdown KPI. The kpis used herein are revenue, COGS, expenditure and net profit.Pitch your topic with ease and precision using this Monthly Profit And Loss Analysis Reports Dashboard With Cost Breakdown Kpi Structure PDF. This layout presents information on Revenue Expenditure, Net Profit, Total Exprnses. It is also available for immediate download and adjustment. So, changes can be made in the color, design, graphics or any other component to create a unique layout.
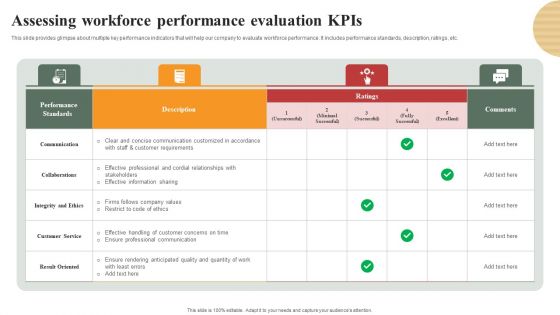
Optimizing Human Capital Alignment Assessing Workforce Performance Evaluation Kpis Download PDF
This slide provides glimpse about multiple key performance indicators that will help our company to evaluate workforce performance. It includes performance standards, description, ratings, etc. Take your projects to the next level with our ultimate collection of Optimizing Human Capital Alignment Assessing Workforce Performance Evaluation Kpis Download PDF. Slidegeeks has designed a range of layouts that are perfect for representing task or activity duration, keeping track of all your deadlines at a glance. Tailor these designs to your exact needs and give them a truly corporate look with your own brand colors theyll make your projects stand out from the rest.

Stock Photo Business Management Strategy Save Money For Education Images Photos
Establish The Correct Conditions With Our stock photo business management strategy save money for education images photos. They Will Create Food For Thought. Our finance Are Almost Foolproof. They Have Been Double Checked For Any Flaws.
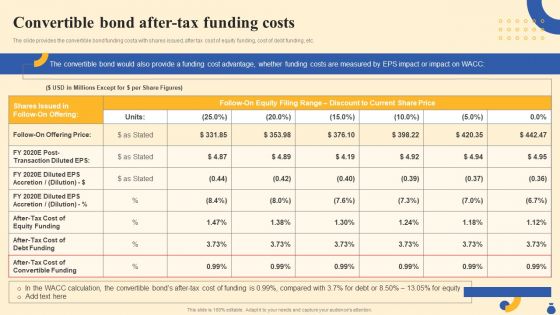
Equity Funding And Debt Financing Pitchbook Convertible Bond After Tax Funding Costs Pictures PDF
The slide provides the convertible bond funding costa with shares issued, after tax cost of equity funding, cost of debt funding, etc. Do you have to make sure that everyone on your team knows about any specific topic I yes, then you should give Equity Funding And Debt Financing Pitchbook Convertible Bond After Tax Funding Costs Pictures PDF a try. Our experts have put a lot of knowledge and effort into creating this impeccable Equity Funding And Debt Financing Pitchbook Convertible Bond After Tax Funding Costs Pictures PDF. You can use this template for your upcoming presentations, as the slides are perfect to represent even the tiniest detail. You can download these templates from the Slidegeeks website and these are easy to edit. So grab these today.
business intelligence and analytics dashboard ppt powerpoint presentation icon example topics pdf
Presenting this set of slides with name business intelligence and analytics dashboard ppt powerpoint presentation icon example topics pdf. The topics discussed in these slides are geographic distribution of total revenue, top 5 product by total revenue, measuring running by total revenue, how close are we to tour planned total revenue. This is a completely editable PowerPoint presentation and is available for immediate download. Download now and impress your audience.
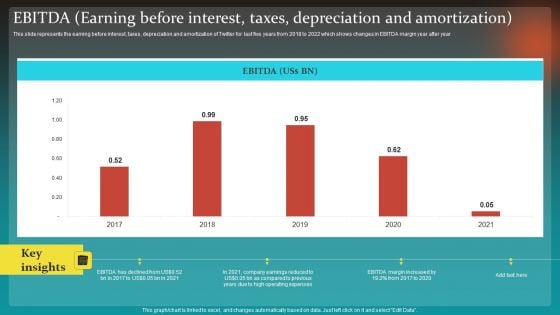
Social Network Business Summary EBITDA Earning Before Interest Taxes Depreciation Pictures PDF
This slide represents the earning before interest, taxes, depreciation and amortization of Twitter for last five years from 2018 to 2022 which shows changes in EBITDA margin year after year Take your projects to the next level with our ultimate collection of Social Network Business Summary EBITDA Earning Before Interest Taxes Depreciation Pictures PDF. Slidegeeks has designed a range of layouts that are perfect for representing task or activity duration, keeping track of all your deadlines at a glance. Tailor these designs to your exact needs and give them a truly corporate look with your own brand colors they will make your projects stand out from the rest.
Business To Business Account B2B Sales Representatives Performance Tracking Dashboard Demonstration PDF
This slide provides information regarding B2B sales representatives performance tracking dashboard to measure leads by region, revenue breakdown, top performers by leads, revenues, etc. Deliver and pitch your topic in the best possible manner with this Business To Business Account B2B Sales Representatives Performance Tracking Dashboard Demonstration PDF. Use them to share invaluable insights on Top 5 Sales Reps By Revenue Pace, Top 5 Sales Reps By Revenue, Top 5 Sales Reps By Leads and impress your audience. This template can be altered and modified as per your expectations. So, grab it now.
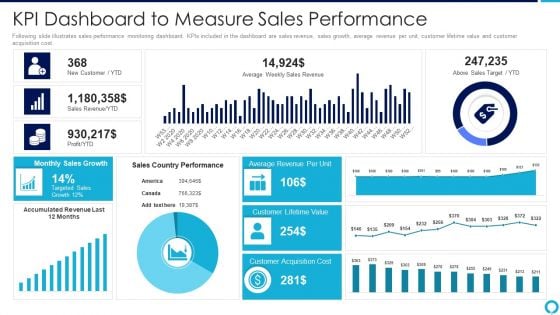
Partnership Management Strategies Kpi Dashboard To Measure Sales Performance Introduction PDF
Following slide illustrates sales performance monitoring dashboard. KPIs included in the dashboard are sales revenue, sales growth, average revenue per unit, customer lifetime value and customer acquisition cost.Deliver and pitch your topic in the best possible manner with this partnership management strategies kpi dashboard to measure sales performance introduction pdf Use them to share invaluable insights on average revenue, monthly sales growth, customer acquisition cost and impress your audience. This template can be altered and modified as per your expectations. So, grab it now.
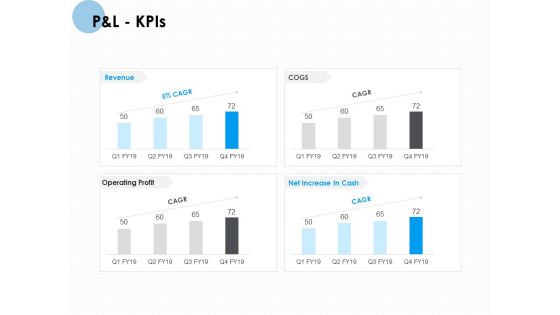
P And L Kpis Ppt PowerPoint Presentation Pictures Visual Aids
Presenting this set of slides with name p and l kpis ppt powerpoint presentation pictures visual aids. The topics discussed in these slides are net sales, total income, expenses, financing cost, profit before tax, profit after tax. This is a completely editable PowerPoint presentation and is available for immediate download. Download now and impress your audience.
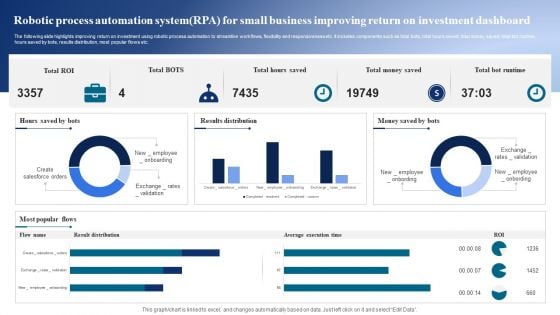
Robotic Process Automation Systemrpa For Small Business Improving Return On Investment Dashboard Ideas PDF
The following slide highlights improving return on investment using robotic process automation to streamline workflows, flexibility and responsiveness etc. It includes components such as total bots, total hours saved, total money saved, total bot runtime, hours saved by bots, results distribution, most popular flows etc. Showcasing this set of slides titled Robotic Process Automation Systemrpa For Small Business Improving Return On Investment Dashboard Ideas PDF. The topics addressed in these templates are Results Distribution, Popular Flows, Runtime. All the content presented in this PPT design is completely editable. Download it and make adjustments in color, background, font etc. as per your unique business setting.
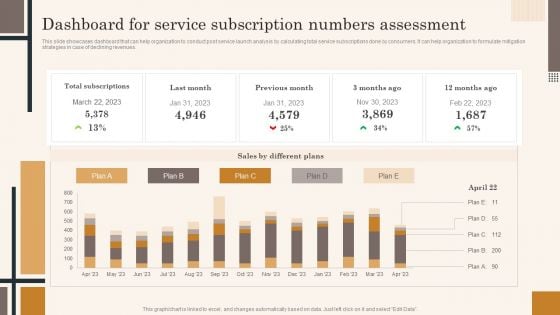
Dashboard For Service Subscription Numbers Assessment Professional PDF
This slide showcases dashboard that can help organization to conduct post service launch analysis by calculating total service subscriptions done by consumers. It can help organization to formulate mitigation strategies in case of declining revenues. Presenting this PowerPoint presentation, titled Dashboard For Service Subscription Numbers Assessment Professional PDF, with topics curated by our researchers after extensive research. This editable presentation is available for immediate download and provides attractive features when used. Download now and captivate your audience. Presenting this Dashboard For Service Subscription Numbers Assessment Professional PDF. Our researchers have carefully researched and created these slides with all aspects taken into consideration. This is a completely customizable Dashboard For Service Subscription Numbers Assessment Professional PDF that is available for immediate downloading. Download now and make an impact on your audience. Highlight the attractive features available with our PPTs.
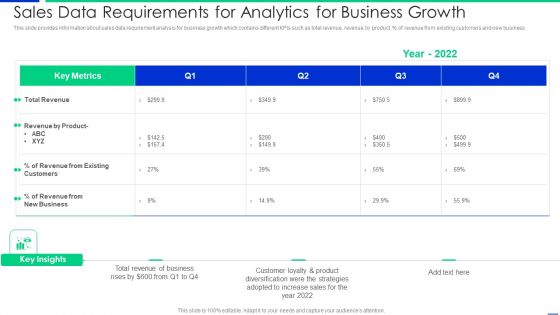
Sales Data Requirements For Analytics For Business Growth Information PDF
This slide provides information about sales data requirement analysis for business growth which contains different KPIs such as total revenue, revenue by product, percentage of revenue from existing customers and new business. Pitch your topic with ease and precision using this sales data requirements for analytics for business growth information pdf. This layout presents information on customers, revenue, business. It is also available for immediate download and adjustment. So, changes can be made in the color, design, graphics or any other component to create a unique layout.
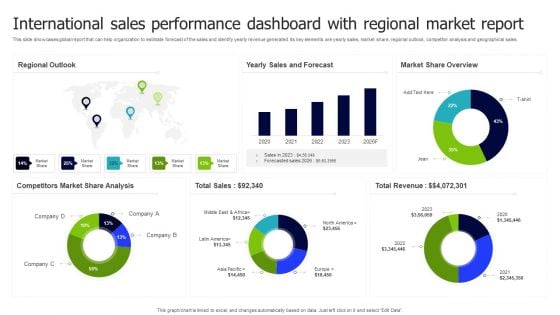
International Sales Performance Dashboard With Regional Market Report Inspiration PDF
This slide showcases global report that can help organization to estimate forecast of the sales and identify yearly revenue generated. Its key elements are yearly sales, market share, regional outlook, competitor analysis and geographical sales. Pitch your topic with ease and precision using this International Sales Performance Dashboard With Regional Market Report Inspiration PDF. This layout presents information on Regional Outlook, Sales And Forecast, Market Share Overview. It is also available for immediate download and adjustment. So, changes can be made in the color, design, graphics or any other component to create a unique layout.
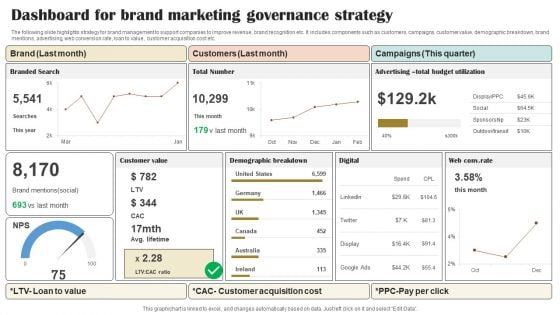
Dashboard For Brand Marketing Governance Strategy Portrait PDF
The following slide highlights strategy for brand management to support companies to improve revenue, brand recognition etc. It includes components such as customers, campaigns, customer value, demographic breakdown, brand mentions, advertising, web conversion rate, loan to value, customer acquisition cost etc. Pitch your topic with ease and precision using this Dashboard For Brand Marketing Governance Strategy Portrait PDF. This layout presents information on Brand, Customers, Campaigns. It is also available for immediate download and adjustment. So, changes can be made in the color, design, graphics or any other component to create a unique layout.
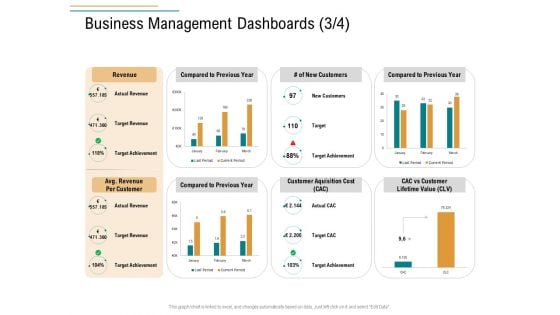
Business Operations Assessment Business Management Dashboards Customers Ppt Outline Designs Download PDF
Deliver and pitch your topic in the best possible manner with this business operations assessment business management dashboards customers ppt outline designs download pdf. Use them to share invaluable insights on actual revenue, target revenue, revenue, compared to previous year, new customers, compared to previous year, compared to previous year your audience. This template can be altered and modified as per your expectations. So, grab it now.
Product Branding To Enhance Product Sales Performance Tracking Dashboard Infographics PDF
This slide provides information regarding product branding performance tracking dashboard in terms of revenues, new customers, customer satisfaction rate. Make sure to capture your audiences attention in your business displays with our gratis customizable Product Branding To Enhance Product Sales Performance Tracking Dashboard Infographics PDF. These are great for business strategies, office conferences, capital raising or task suggestions. If you desire to acquire more customers for your tech business and ensure they stay satisfied, create your own sales presentation with these plain slides.
Tax Debt Equity Rules Ppt PowerPoint Presentation Pictures Outfit Cpb Pdf
Presenting this set of slides with name tax debt equity rules ppt powerpoint presentation pictures outfit cpb pdf. This is an editable Powerpoint four stages graphic that deals with topics like supporting staff finance skills to help convey your message better graphically. This product is a premium product available for immediate download and is 100 percent editable in Powerpoint. Download this now and use it in your presentations to impress your audience.
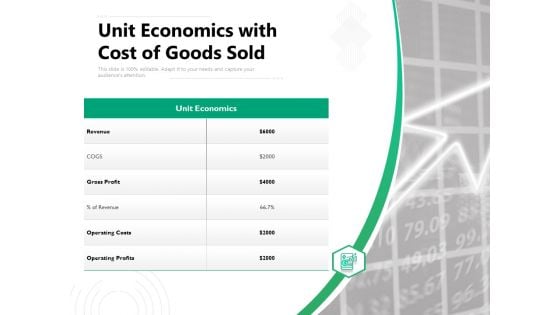
Unit Economics With Cost Of Goods Sold Ppt PowerPoint Presentation Pictures Portfolio PDF
Presenting this set of slides with name unit economics with cost of goods sold ppt powerpoint presentation pictures portfolio pdf. The topics discussed in these slides are revenue, gross profit, operating costs, operating profits. This is a completely editable PowerPoint presentation and is available for immediate download. Download now and impress your audience.
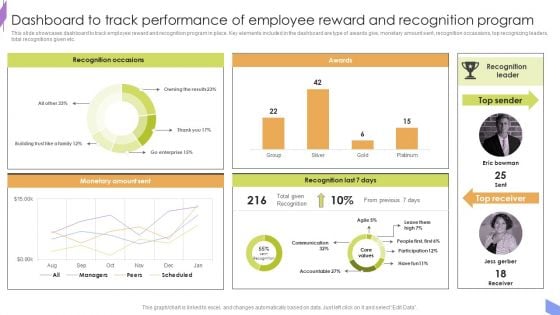
Dashboard To Track Performance Of Employee Reward And Recognition Program Professional PDF
This slide showcases dashboard to track employee reward and recognition program in place. Key elements included in the dashboard are type of awards give, monetary amount sent, recognition occassions, top recognizing leaders, total recognitions given etc. Create an editable Dashboard To Track Performance Of Employee Reward And Recognition Program Professional PDF that communicates your idea and engages your audience. Whether you are presenting a business or an educational presentation, pre-designed presentation templates help save time. Dashboard To Track Performance Of Employee Reward And Recognition Program Professional PDF is highly customizable and very easy to edit, covering many different styles from creative to business presentations. Slidegeeks has creative team members who have crafted amazing templates. So, go and get them without any delay.
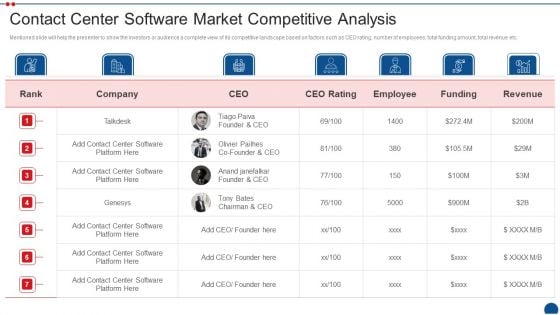
Call Center Application Market Industry Contact Center Software Market Competitive Analysis Introduction PDF
Mentioned slide will help the presenter to show the investors or audience a complete view of its competitive landscape based on factors such as CEO rating, number of employees, total funding amount, total revenue etc. Deliver an awe inspiring pitch with this creative call center application market industry contact center software market competitive analysis introduction pdf bundle. Topics like employee, revenue, company can be discussed with this completely editable template. It is available for immediate download depending on the needs and requirements of the user.
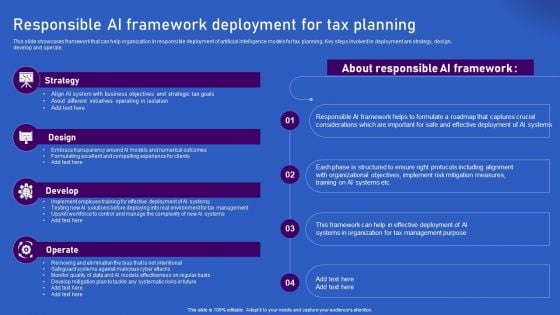
Ways Artificial Intelligence Is Transforming Finance Sector Responsible AI Framework Deployment For Tax Pictures PDF
This slide showcases framework that can help organization in responsible deployment of artificial intelligence models for tax planning. Key steps involved in deployment are strategy, design, develop and operate. Present like a pro with Ways Artificial Intelligence Is Transforming Finance Sector Responsible AI Framework Deployment For Tax Pictures PDF Create beautiful presentations together with your team, using our easy to use presentation slides. Share your ideas in real time and make changes on the fly by downloading our templates. So whether you are in the office, on the go, or in a remote location, you can stay in sync with your team and present your ideas with confidence. With Slidegeeks presentation got a whole lot easier. Grab these presentations today.
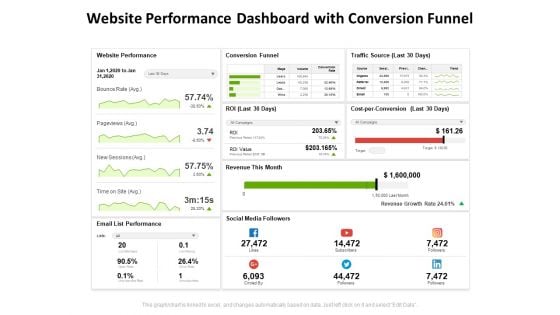
Website Performance Dashboard With Conversion Funnel Ppt PowerPoint Presentation Slides Pictures PDF
Presenting this set of slides with name website performance dashboard with conversion funnel ppt powerpoint presentation slides pictures pdf. The topics discussed in these slides are website performance, conversion funnel, traffic source, revenue this month, social media followers, email list performance. This is a completely editable PowerPoint presentation and is available for immediate download. Download now and impress your audience.
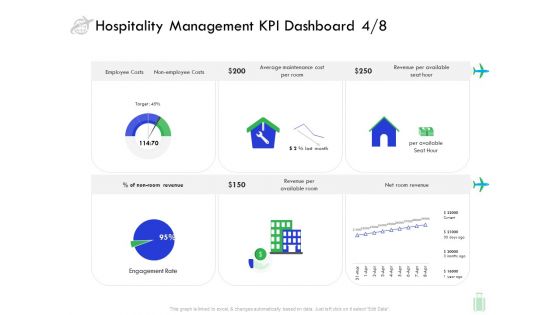
Travel And Leisure Industry Analysis Hospitality Management KPI Dashboard Employee Pictures PDF
Presenting this set of slides with name travel and leisure industry analysis hospitality management kpi dashboard employee pictures pdf. The topics discussed in these slides are costs, maintenance, revenue, average. This is a completely editable PowerPoint presentation and is available for immediate download. Download now and impress your audience.
Efficient Administration Of Product Business And Umbrella Branding Product Branding Performance Tracking Dashboard Background PDF
This slide provides information regarding product branding performance tracking dashboard in terms of revenues, new customers, customer satisfaction rate. Make sure to capture your audiences attention in your business displays with our gratis customizable Efficient Administration Of Product Business And Umbrella Branding Product Branding Performance Tracking Dashboard Background PDF. These are great for business strategies, office conferences, capital raising or task suggestions. If you desire to acquire more customers for your tech business and ensure they stay satisfied, create your own sales presentation with these plain slides.
Human Capital Data Analytics Ppt PowerPoint Presentation File Model Cpb
Presenting this set of slides with name human capital data analytics ppt powerpoint presentation file model cpb. This is an editable Powerpoint four stages graphic that deals with topics like human capital data analytics to help convey your message better graphically. This product is a premium product available for immediate download and is 100 percent editable in Powerpoint. Download this now and use it in your presentations to impress your audience.
Automating Supply Chain Dashboard For Tracking Impact Of Transport Automation Themes PDF
This slide covers the dashboard for tracking vehicle efficiency after transport automation. It include KPIs such as truck turnaround time, average revenue per hour, truckload capacity, transit time, on-time pickup, and average revenue per mile. Deliver an awe inspiring pitch with this creative Automating Supply Chain Dashboard For Tracking Impact Of Transport Automation Themes PDF bundle. Topics like Average Revenue, Per Mile, Truck Turnaround can be discussed with this completely editable template. It is available for immediate download depending on the needs and requirements of the user.
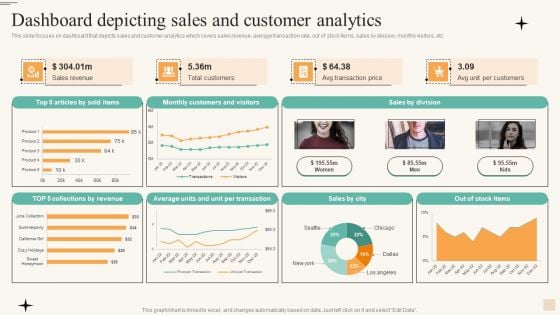
Dashboard Depicting Sales And Customer Analytics Infographics PDF
This slide focuses on dashboard that depicts sales and customer analytics which covers sales revenue, average transaction rate, out of stock items, sales by division, monthly visitors, etc. If you are looking for a format to display your unique thoughts, then the professionally designed Dashboard Depicting Sales And Customer Analytics Infographics PDF is the one for you. You can use it as a Google Slides template or a PowerPoint template. Incorporate impressive visuals, symbols, images, and other charts. Modify or reorganize the text boxes as you desire. Experiment with shade schemes and font pairings. Alter, share or cooperate with other people on your work. Download Dashboard Depicting Sales And Customer Analytics Infographics PDF and find out how to give a successful presentation. Present a perfect display to your team and make your presentation unforgettable.
Dashboard For Tracking Brand Awareness Advertisement Campaign Results Download PDF
This slide showcases dashboard that can help organization to track results of online advertisement campaigns. Its key components ad impressions, click through rate, cost per conversion, revenue per click, impressions, new users and sessions. Here you can discover an assortment of the finest PowerPoint and Google Slides templates. With these templates, you can create presentations for a variety of purposes while simultaneously providing your audience with an eye catching visual experience. Download Dashboard For Tracking Brand Awareness Advertisement Campaign Results Download PDF to deliver an impeccable presentation. These templates will make your job of preparing presentations much quicker, yet still, maintain a high level of quality. Slidegeeks has experienced researchers who prepare these templates and write high quality content for you. Later on, you can personalize the content by editing the Dashboard For Tracking Brand Awareness Advertisement Campaign Results Download PDF.
Product And Customer Performance Tracking Dashboard Portrait PDF
This slide provides information regarding dashboard utilized by firm to monitor performance of products offered and customer associated. The performance is tracked through revenues generated, new customer acquired, customer satisfaction, sales comparison, etc. Do you have an important presentation coming up Are you looking for something that will make your presentation stand out from the rest Look no further than Product And Customer Performance Tracking Dashboard Portrait PDF. With our professional designs, you can trust that your presentation will pop and make delivering it a smooth process. And with Slidegeeks, you can trust that your presentation will be unique and memorable. So why wait Grab Product And Customer Performance Tracking Dashboard Portrait PDF today and make your presentation stand out from the rest.
Marketing Activities Tracking Dashboard For Insurance Agency Infographics PDF
This slide provides glimpse about essential marketing activities tracking dashboard for insurance agency in terms of campaign spend by product line, marketing calendar, campaign revenue analysis, etc. Find highly impressive Marketing Activities Tracking Dashboard For Insurance Agency Infographics PDF on Slidegeeks to deliver a meaningful presentation. You can save an ample amount of time using these presentation templates. No need to worry to prepare everything from scratch because Slidegeeks experts have already done a huge research and work for you. You need to download Marketing Activities Tracking Dashboard For Insurance Agency Infographics PDF for your upcoming presentation. All the presentation templates are 100 percent editable and you can change the color and personalize the content accordingly. Download now


 Continue with Email

 Home
Home


