Financial Summary
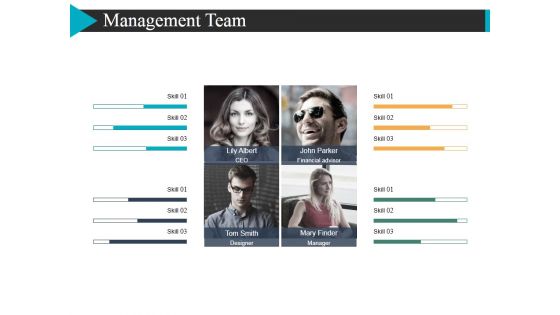
Management Team Template 1 Ppt Powerpoint Presentation Icon Clipart Images
This is a management team template 1 ppt powerpoint presentation icon clipart images. This is a four stage process. The stages in this process are john parker ceo, mary finder designer, tom smith financial advisor.
Management Team Template 2 Ppt Powerpoint Presentation Infographics Demonstration
This is a management team template 2 ppt powerpoint presentation infographics demonstration. This is a four stage process. The stages in this process are lily albert ceo, john parker financial advisor, tom smith designer.

Management Team Template 1 Ppt PowerPoint Presentation Infographics Design Inspiration
This is a management team template 1 ppt powerpoint presentation infographics design inspiration. This is a four stage process. The stages in this process are ceo, editor, financial advisor, designer.
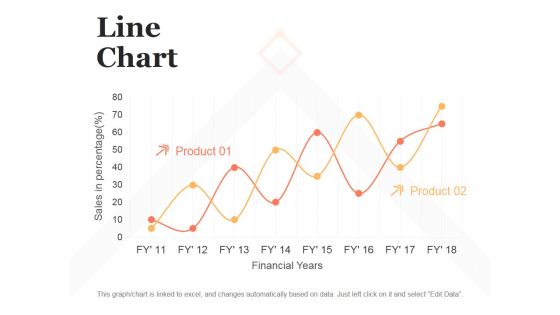
Line Chart Ppt PowerPoint Presentation Model Design Templates
This is a line chart ppt powerpoint presentation model design templates. This is a two stage process. The stages in this process are sales in percentage, financial years, product.
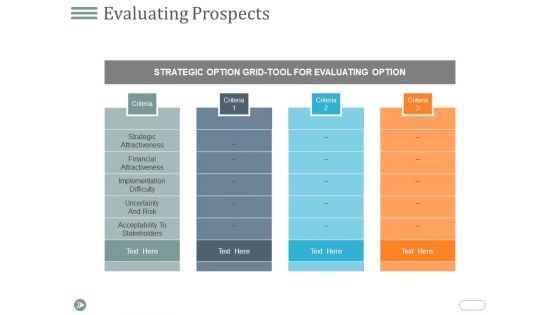
Evaluating Prospects Ppt PowerPoint Presentation Infographic Template Format
This is a evaluating prospects ppt powerpoint presentation infographic template format. This is a three stage process. The stages in this process are strategic attractiveness, financial attractiveness, implementation difficulty, uncertainty and risk, acceptability to stakeholders.
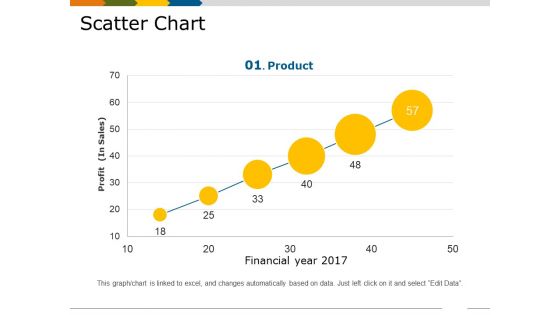
Scatter Chart Template 1 Ppt PowerPoint Presentation Show Slides
This is a scatter chart template 1 ppt powerpoint presentation show slides. This is a six stage process. The stages in this process are financial year, profit in sales, growth, business, marketing, product.

Meet Our Awesome Team Ppt PowerPoint Presentation Show Template
This is a meet our awesome team ppt powerpoint presentation show template. This is a two stage process. The stages in this process are marketing manager, financial manager, communication, business.
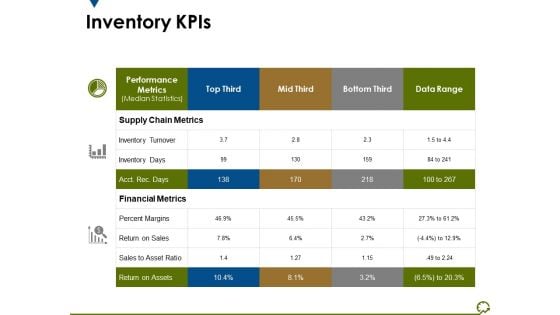
Inventory Kpis Ppt PowerPoint Presentation Infographic Template Display
This is a inventory kpis ppt powerpoint presentation infographic template display. This is a three stage process. The stages in this process are supply chain metrics, financial metrics, percent margins, return on assets, inventory turnover.
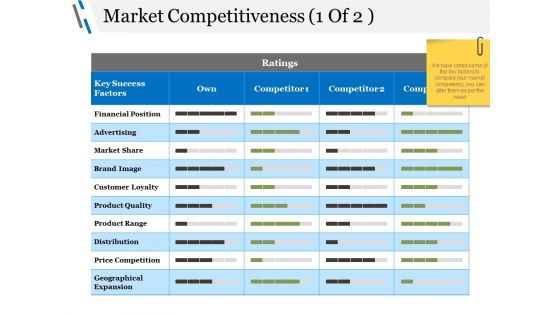
Market Competitiveness Template 1 Ppt PowerPoint Presentation Inspiration Deck
This is a market competitiveness template 1 ppt powerpoint presentation inspiration deck. This is a three stage process. The stages in this process are financial position, advertising, market share, brand image, customer loyalty.
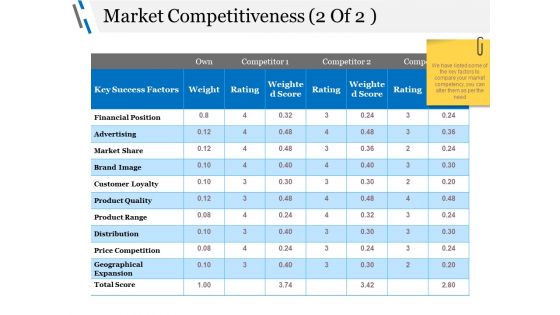
Market Competitiveness Template 2 Ppt PowerPoint Presentation Pictures Elements
This is a market competitiveness template 2 ppt powerpoint presentation pictures elements. This is a three stage process. The stages in this process are financial position, advertising, market share, brand image, customer loyalty.
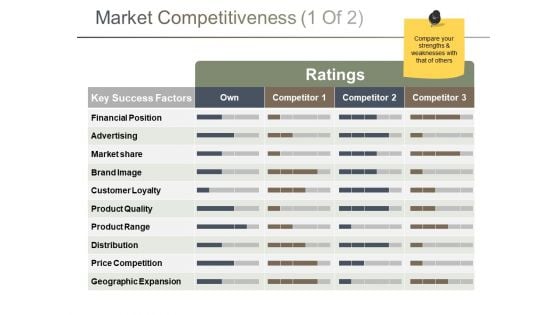
Market Competitiveness Template 1 Ppt PowerPoint Presentation Pictures Vector
This is a market competitiveness template 1 ppt powerpoint presentation pictures vector. This is a three stage process. The stages in this process are financial position, advertising, market share, brand image, customer loyalty.
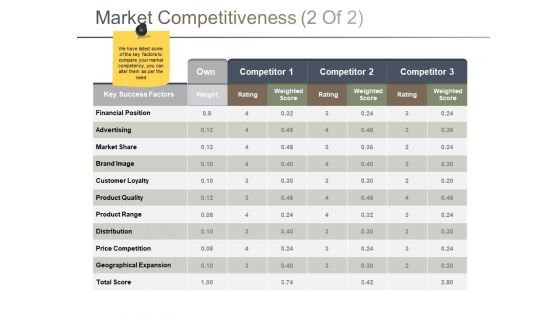
Market Competitiveness Template 2 Ppt PowerPoint Presentation Infographics Influencers
This is a market competitiveness template 2 ppt powerpoint presentation infographics influencers. This is a three stage process. The stages in this process are financial position, advertising, market share, brand image, customer loyalty.
Market Competitiveness Template 2 Ppt PowerPoint Presentation Icon Master Slide
This is a market competitiveness template 2 ppt powerpoint presentation icon master slide. This is a three stage process. The stages in this process are financial position, advertising, market share, brand image, customer loyalty.
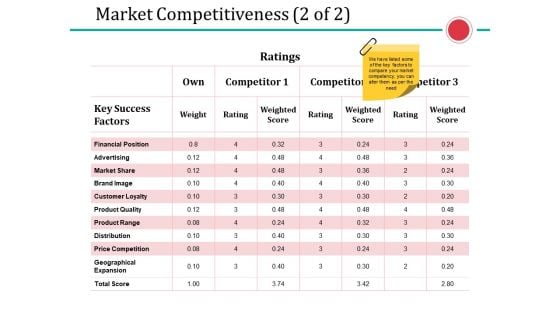
Market Competitiveness Template 2 Ppt PowerPoint Presentation Portfolio Graphic Tips
This is a market competitiveness template 2 ppt powerpoint presentation portfolio graphic tips. This is a three stage process. The stages in this process are financial position, advertising, market share, brand image, customer loyalty.
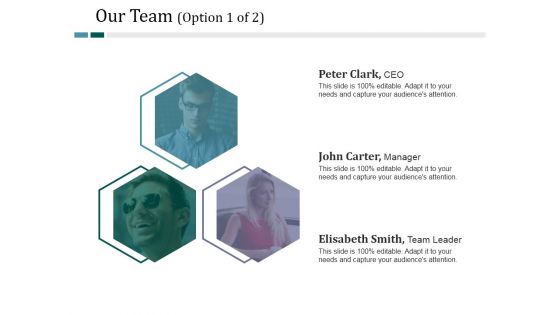
Our Team Template 1 Ppt PowerPoint Presentation Pictures Example File
This is a our team template 1 ppt powerpoint presentation pictures example file. This is a four stage process. The stages in this process are ceo, financial advisor, designer, manager.
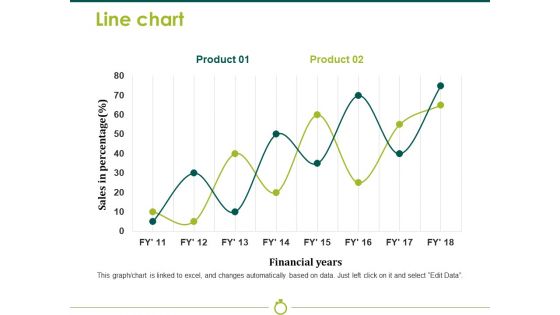
Line Chart Template 2 Ppt PowerPoint Presentation Model Background Image
This is a line chart template 2 ppt powerpoint presentation model background image. This is a two stage process. The stages in this process are sales in percentage, financial years, business, marketing, strategy, graph.
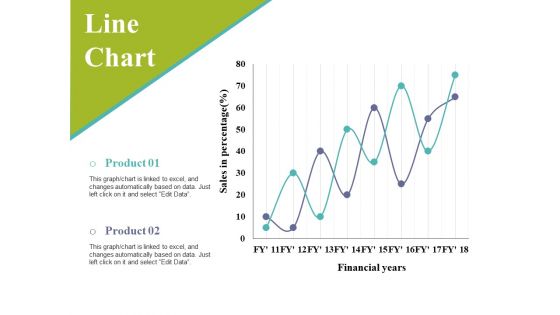
Line Chart Ppt PowerPoint Presentation Infographic Template Slides
This is a line chart ppt powerpoint presentation infographic template slides. This is a two stage process. The stages in this process are sales in percentage, financial years, business, marketing, graph.
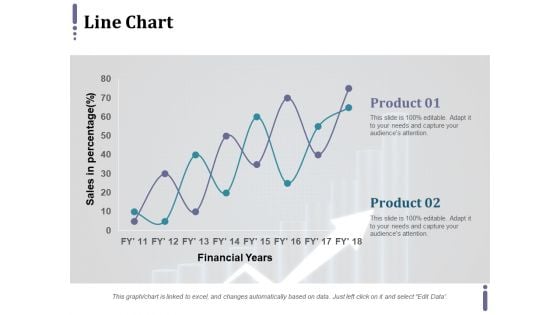
Line Chart Ppt PowerPoint Presentation Infographic Template Master Slide
This is a line chart ppt powerpoint presentation infographic template master slide. This is a two stage process. The stages in this process are product, financial years, sales in percentage.
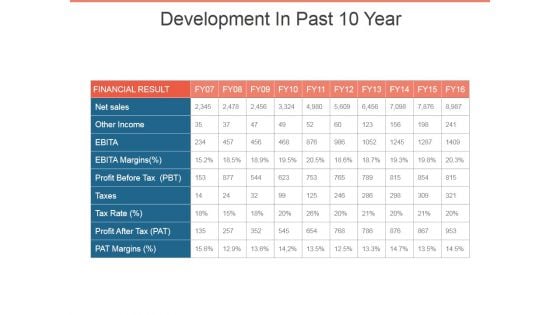
Development In Past 10 Year Template 2 Ppt PowerPoint Presentation Infographic Template Example
This is a development in past 10 year template 2 ppt powerpoint presentation infographic template example. This is a ten stage process. The stages in this process are other income, net sales, ebita margins, taxes, financial result.
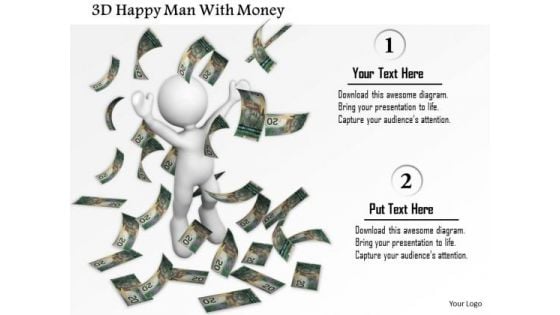
3d Happy Man With Money PowerPoint Templates
Explain the concept of financial growth strategy and its requirement for success with this unique image. This contains the graphic of 3d man with money. This diagram slide is well designed for finance presentations to give better explanation of growth.

Evaluating Scores Ppt PowerPoint Presentationpictures Outline
This is a evaluating scores ppt powerpoint presentationpictures outline. This is a seven stage process. The stages in this process are strategic, product advantage, market attractiveness, leverage competencies, financial feasibility, operational feasibility.
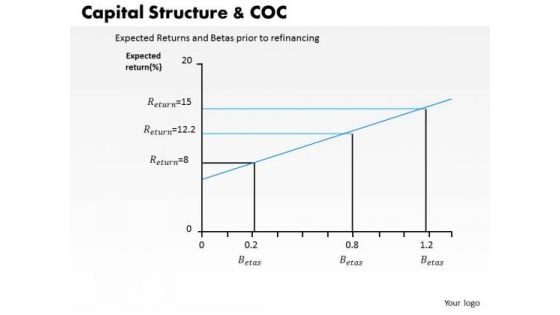
Business Framework Capital Structure And Coc PowerPoint Presentation
This PPT slide contains the concept of capital structure and cost of capital. To display both these concept we have used graphic of chart for analyzing capital structure versus COC. Use this PPT slide in your financial presentations.
Money Chart Ppt Icon For Ppt Templates And Slides R
Microsoft PowerPoint Template and Background with financial diagram consisting of golden Gain approval with our Money Chart Ppt Icon For Ppt Templates And Slides R. Just download, type and present.
Money Chart Ppt Icon For Ppt Templates And Slides S
Microsoft PowerPoint Template and Background with financial diagram consisting of golden Make sensational presentations with our Money Chart Ppt Icon For Ppt Templates And Slides S. You'll always stay ahead of the game.
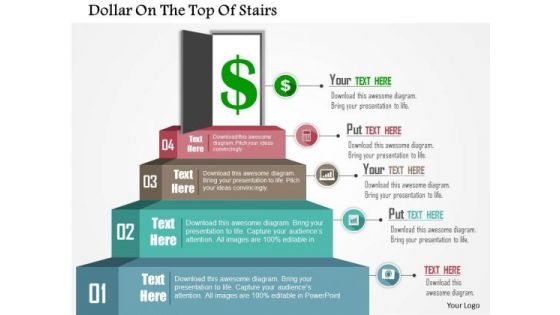
Business Diagram Dollar On The Top Of Stairs Presentation Template
Graphic of dollar on the top of the stairs has been used to craft this power point template. This PPT diagram contains the concept of financial growth. Use this PPT for business and finance related presentations.
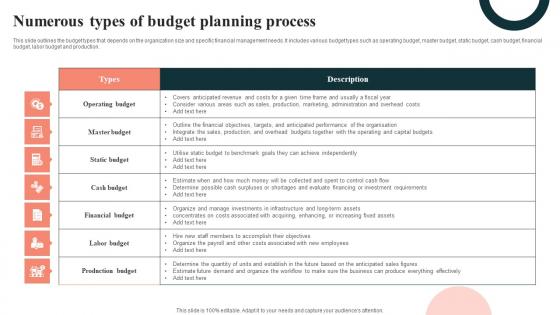
Numerous Types Of Budget Planning Process Slides Pdf
This slide outlines the budget types that depends on the organization size and specific financial management needs. It includes various budget types such as operating budget, master budget, static budget, cash budget, financial budget, labor budget and production. Pitch your topic with ease and precision using this Numerous Types Of Budget Planning Process Slides Pdf. This layout presents information on Operating Budget, Master Budget, Static Budget. It is also available for immediate download and adjustment. So, changes can be made in the color, design, graphics or any other component to create a unique layout. This slide outlines the budget types that depends on the organization size and specific financial management needs. It includes various budget types such as operating budget, master budget, static budget, cash budget, financial budget, labor budget and production.
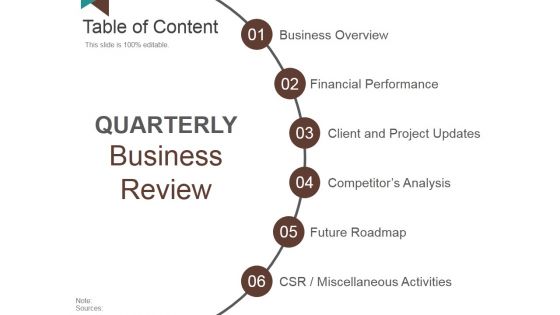
Table Of Content Template 7 Ppt PowerPoint Presentation Infographic Template Gridlines
This is a table of content template 7 ppt powerpoint presentation infographic template gridlines. This is a six stage process. The stages in this process are financial performance, client and project updates, competitors analysis, future roadmap, csr miscellaneous activities.
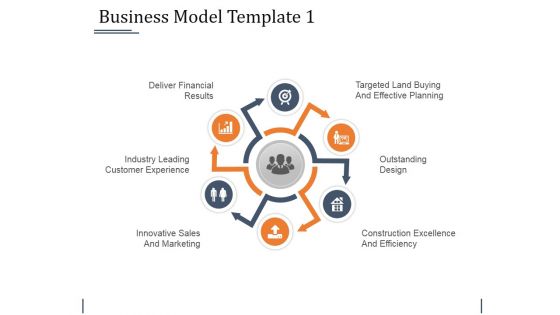
Business Model Template 1 Ppt PowerPoint Presentation Infographic Template File Formats
This is a business model template 1 ppt powerpoint presentation infographic template file formats. This is a six stage process. The stages in this process are outstanding design, deliver financial results, industry leading customer experience, innovative sales and marketing.

Client Customer Testimonials Template 1 Ppt PowerPoint Presentation Show Graphics Template
This is a client customer testimonials template 1 ppt powerpoint presentation show graphics template. This is a two stage process. The stages in this process are ceo, financial advisor, client customer testimonials, communication.
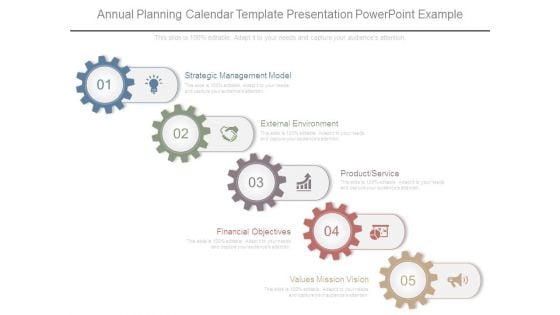
Annual Planning Calendar Template Presentation Powerpoint Example
This is a annual planning calendar template presentation powerpoint example. This is a five stage process. The stages in this process are strategic management model, external environment, product service, financial objectives, values mission vision.

Land Development Process Diagram Powerpoint Presentation Templates
This is a land development process diagram powerpoint presentation templates. This is a five stage process. The stages in this process are design and entitlements, construction management, financial management, marketing, lot sales.
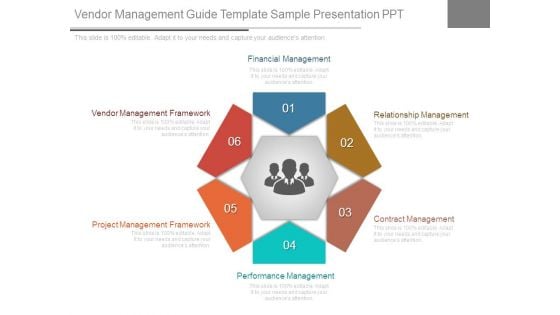
Vendor Management Guide Template Sample Presentation Ppt
This is a vendor management guide template sample presentation ppt. This is a six stage process. The stages in this process are financial management, relationship management, contract management, performance management, project management framework, vendor management framework.

Development In Past 10 Years Template 2 Ppt PowerPoint Presentation Files
This is a development in past 10 years template 2 ppt powerpoint presentation files. This is a three stage process. The stages in this process are financial position, share capital, equity share data, earnings per share, reserves and surplus.

Gold Nest Egg Money PowerPoint Backgrounds And Templates 1210
Microsoft PowerPoint Template and Background with gold nest egg - financial concept '' Present like a pro with our Gold Nest Egg Money PowerPoint Backgrounds And Templates 1210. You will come out on top.
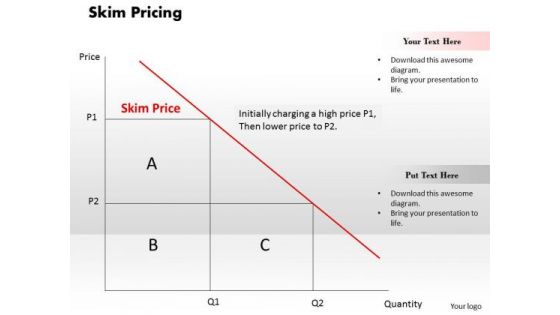
Business Framework Skim Pricing PowerPoint Presentation
This business framework power point template contains the graphic of graph. This PPT has been created with concept of skim pricing. Explain the skim pricing in your business and financial presentations by using this unique PPT.
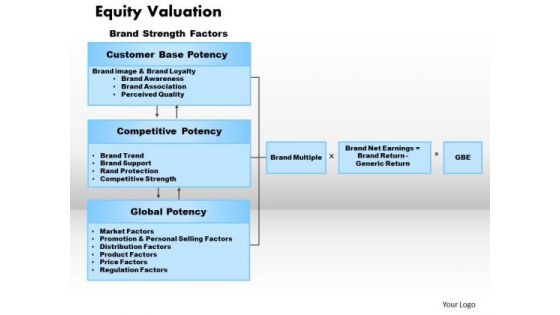
Business Framework Equity Valuation PowerPoint Presentation
This business framework Power Point template diagram has been crafted with graphic of three stage diagram. This PPT diagram contains the concept of equity valuation. Use this PPT diagram for your financial system related presentations.
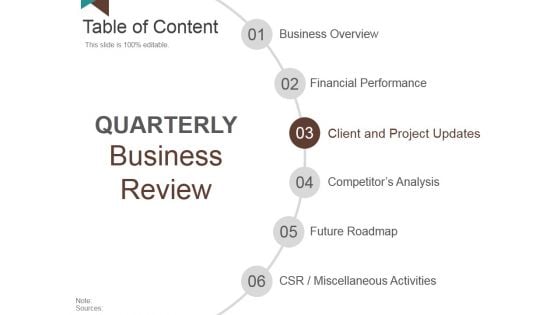
Table Of Content Template 3 Ppt PowerPoint Presentation Slides Example Introduction
This is a table of content template 3 ppt powerpoint presentation slides example introduction. This is a six stage process. The stages in this process are financial performance, client and project updates, competitors analysis, future roadmap, csr miscellaneous activities.

Business Risk Associated With Strategic Alliances Ppt PowerPoint Presentation Model Infographic Template
This is a business risk associated with strategic alliances ppt powerpoint presentation model infographic template. This is a eight stage process. The stages in this process are coordination risk, financial viability risk, input supply risk.

Machine Learning Use Cases Ppt PowerPoint Presentation Infographic Template Clipart Images
This is a machine learning use cases ppt powerpoint presentation infographic template clipart images. This is a six stages process. The stages in this process are energy, feedstock, utilities, financial services, travel, hospitality, healthcare, life sciences, retail, manufacturing.
Growth Arrow On Bar Graph Icon Ppt Powerpoint Presentation Infographic Template Clipart
This is a growth arrow on bar graph icon ppt powerpoint presentation infographic template clipart. This is a three stage process. The stages in this process are financial statements icon, accounting ratio icon, balance sheet icon.
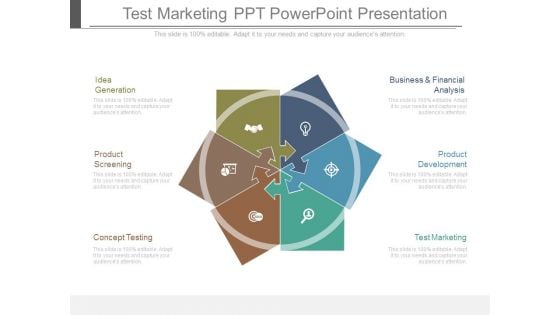
Test Marketing Ppt Powerpoint Presentation
This is a test marketing ppt powerpoint presentation. This is a six stage process. The stages in this process are idea generation, product screening, concept testing, business and financial analysis, product development, test marketing.
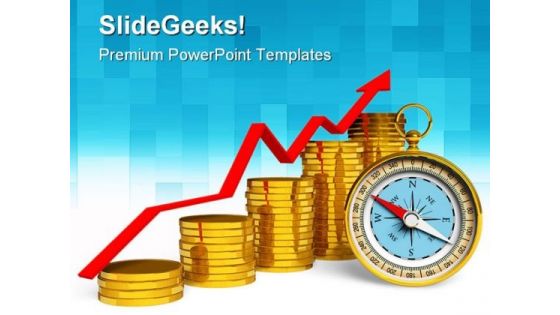
Graph Finance PowerPoint Templates And PowerPoint Backgrounds 0511
Microsoft PowerPoint Template and Background with financial success concept golden compass with growing bar chart from golden coins Instruct your team with our Graph Finance PowerPoint Templates And PowerPoint Backgrounds 0511. Make sure your presentation gets the attention it deserves.

Businessman Under Bills Finance PowerPoint Templates And PowerPoint Backgrounds 0611
Microsoft PowerPoint Template and Background with businessman buried in sphere of financial invoicess Educate an audience with our Businessman Under Bills Finance PowerPoint Templates And PowerPoint Backgrounds 0611. Just download, type and present.
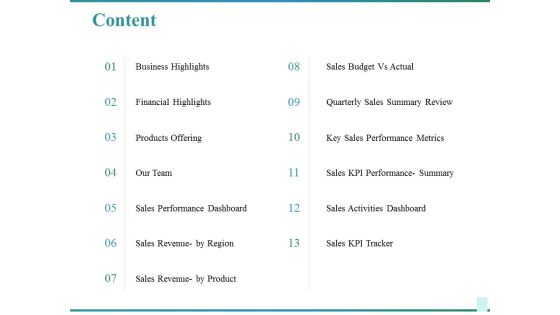
Content Ppt PowerPoint Presentation Infographics Diagrams
This is a content ppt powerpoint presentation infographics diagrams. This is a thirteen stage process. The stages in this process are business highlights, financial highlights, products offering, sales performance dashboard, sales revenue by region.

3d Happy Person With Dollars PowerPoint Templates
Concept of financial growth analysis with happiness has been defined in this PowerPoint template. This diagram slide contains the graphic of 3d man standing over the currency. Use this image for business and finance related topics in any presentation.
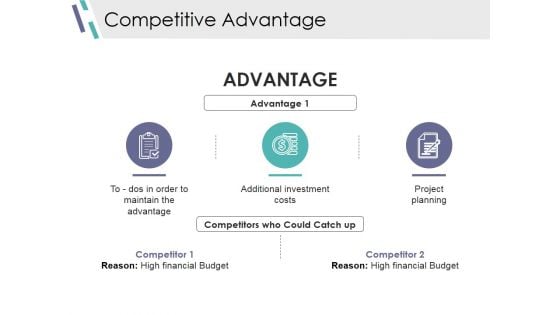
Competitive Advantage Ppt PowerPoint Presentation Infographics Deck
This is a competitive advantage ppt powerpoint presentation infographics deck. This is a three stage process. The stages in this process are maintain the advantage, additional investment costs, project planning, high financial budget.
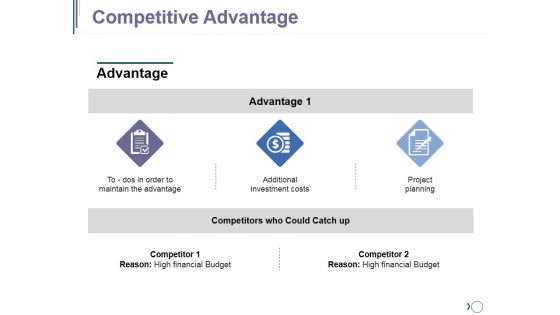
Competitive Advantage Ppt PowerPoint Presentation Inspiration Portfolio
This is a competitive advantage ppt powerpoint presentation inspiration portfolio. This is a three stage process. The stages in this process are advantage, additional investment costs, project planning, high financial budget, competitors who could catch up.
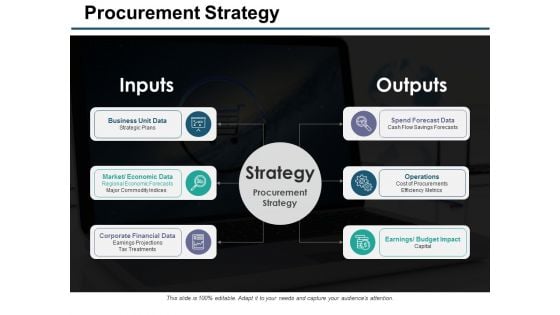
Procurement Strategy Ppt PowerPoint Presentation Ideas Guidelines
This is a procurement strategy ppt powerpoint presentation ideas guidelines. This is a six stage process. The stages in this process are business unit data, corporate financial data, operations, spend forecast data, earnings budget impact.
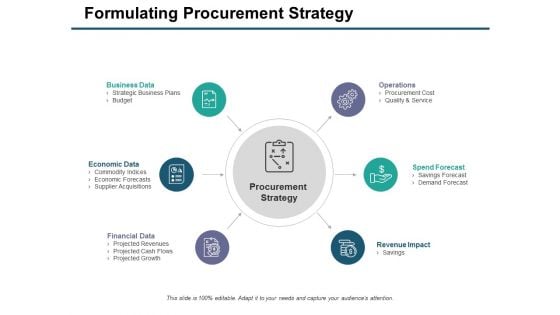
Formulating Procurement Strategy Ppt PowerPoint Presentation Model Visual Aids
This is a formulating procurement strategy ppt powerpoint presentation model visual aids. This is a six stage process. The stages in this process are business data, operations, revenue impact, financial data, economic data.
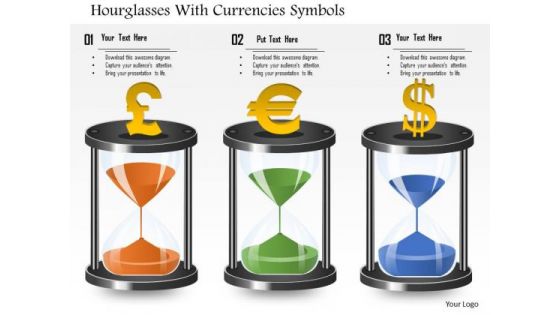
Business Diagram Hourglasses With Currencies Symbols Presentation Template
Download this diagram to display time management tips for financial professionals. This business diagram contains the graphic of hourglasses with currency symbols. Use this template to highlight the key issues of your presentation.
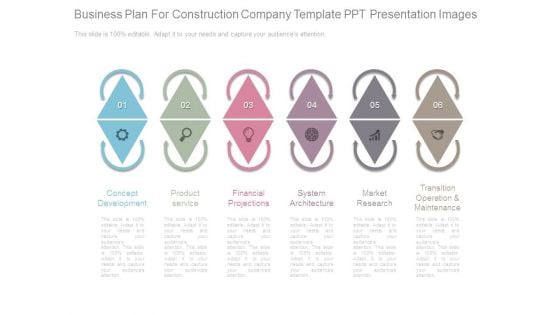
Business Plan For Construction Company Template Ppt Presentation Images
This is a business plan for construction company template ppt presentation images. This is a six stage process. The stages in this process are concept development, product service, financial projections, system architecture, market research, transition operation and maintenance.
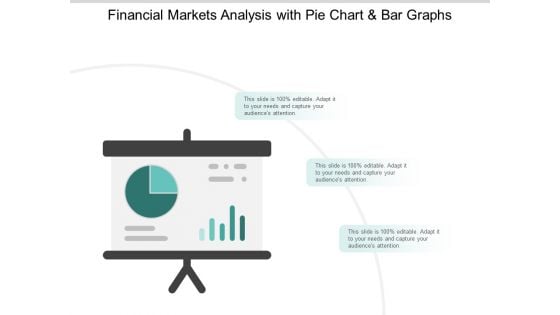
Stock Market Survey Reporting With Pie Chat And Bar Graph Ppt PowerPoint Presentation Infographic Template Example 2015
This is a stock market survey reporting with pie chat and bar graph ppt powerpoint presentation infographic template example 2015. This is a three stage process. The stages in this process are stock market, financial markets, bull market.

Sharing Annual Report For Shareholder Communication Comprehensive Strategic Plan Template Pdf
This slide showcases overview annual report that can be uploaded by organization to engage shareholders. It also showcases key components of annual report which are notes to financial statements, financial highlights, cash flow and income statement. The Sharing Annual Report For Shareholder Communication Comprehensive Strategic Plan Template Pdf is a compilation of the most recent design trends as a series of slides. It is suitable for any subject or industry presentation, containing attractive visuals and photo spots for businesses to clearly express their messages. This template contains a variety of slides for the user to input data, such as structures to contrast two elements, bullet points, and slides for written information. Slidegeeks is prepared to create an impression. This slide showcases overview annual report that can be uploaded by organization to engage shareholders. It also showcases key components of annual report which are notes to financial statements, financial highlights, cash flow and income statement.
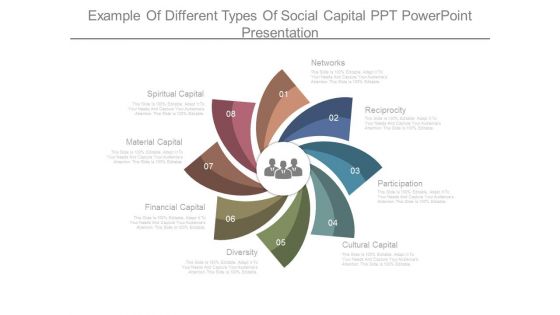
Example Of Different Types Of Social Capital Ppt Powerpoint Presentation
This is a example of different types of social capital ppt powerpoint presentation. This is a eight stage process. The stages in this process are networks, reciprocity, participation, cultural capital, diversity, financial capital, material capital, spiritual capital.
Classification Of Working Capital Ppt PowerPoint Presentation Pictures Icons
This is a classification of working capital ppt powerpoint presentation pictures icons. This is a seven stage process. The stages in this process are financial capital, working capital management, companys managerial accounting.

Working Capital Analysis Supplier Management Ppt PowerPoint Presentation Model Grid
This is a working capital analysis supplier management ppt powerpoint presentation model grid. This is a nine stage process. The stages in this process are financial capital, working capital management, companys managerial accounting.
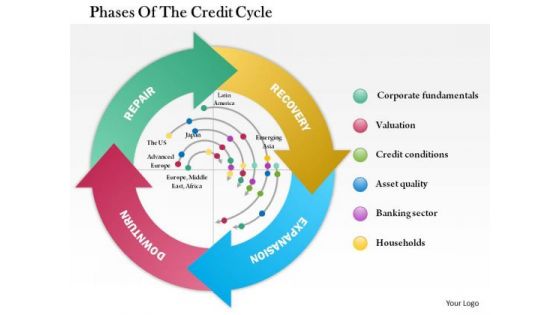
Business Framework Phases Of The Credit Cycle PowerPoint Presentation
Four arrows with interconnection in circular design has been used to design this power Point template slide. This diagram slide contains the concept of credit phases. This PPT slide can be used for financial presentations.
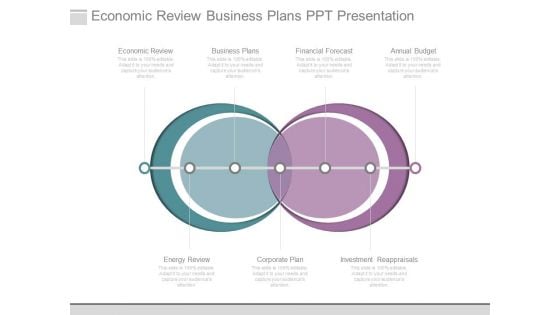
Economic Review Business Plans Ppt Presentation
This is a economic review business plans ppt presentation. This is a two stage process. The stages in this process are economic review, business plans, financial forecast, annual budget, energy review, corporate plan, investment reappraisals.
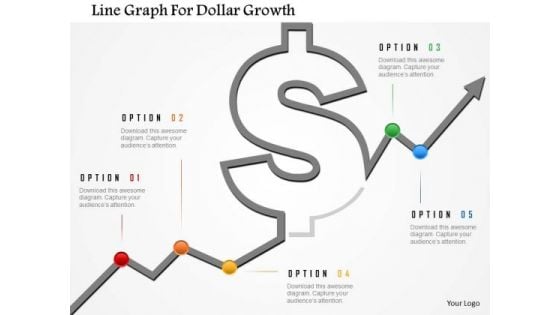
Business Diagram Line Graph For Dollar Growth Presentation Template
Graphic of dollar symbol and growth arrow has been used to design this power point template. This diagram contains the concept of financial result analysis. Use this business diagram for finance related presentations

Business Person With Big Dollar Sign Powerpoint Templates
Adjust the above diagram into your presentations to visually support your content. This slide has been professionally designed with graphics of business man with big dollar sign. This template offers an excellent background to display corporate financial management.


 Continue with Email

 Home
Home


