Financial Summary
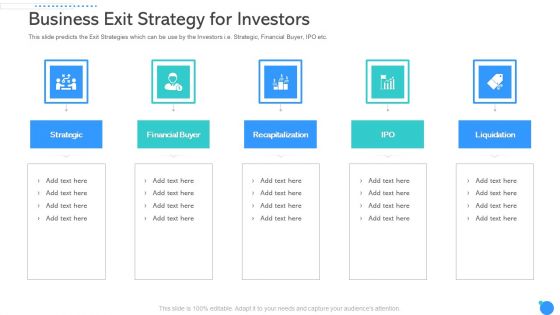
Business Exit Strategy For Investors Ppt Slides Outline PDF
This slide predicts the Exit Strategies which can be use by the Investors i.e. Strategic, Financial Buyer, IPO etc. Presenting business exit strategy for investors ppt slides outline pdf to provide visual cues and insights. Share and navigate important information on five stages that need your due attention. This template can be used to pitch topics like strategic, financial buyer, recapitalization, liquidation. In addtion, this PPT design contains high resolution images, graphics, etc, that are easily editable and available for immediate download.
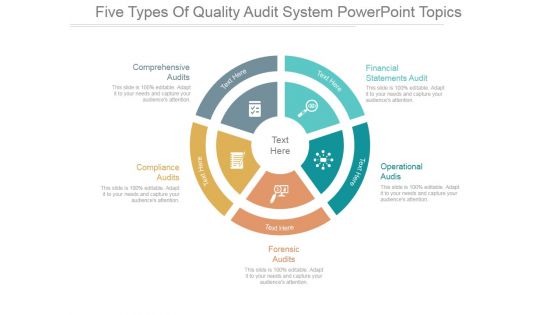
Five Types Of Quality Audit System Ppt PowerPoint Presentation Example 2015
This is a five types of quality audit system ppt powerpoint presentation example 2015. This is a five stage process. The stages in this process are financial statements audit, operational audis, forensic audits, compliance audits.
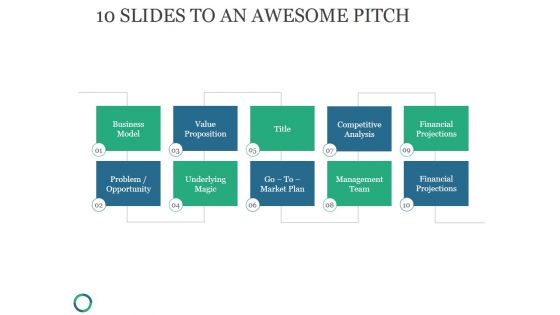
10 Slides To An Awesome Pitch Ppt PowerPoint Presentation Background Images
This is a 10 slides to an awesome pitch ppt powerpoint presentation background images. This is a ten stage process. The stages in this process are business model, value proposition, title, competitive analysis, financial projections.

Short Term Vs Long Term Objectives Ppt PowerPoint Presentation Background Image
This is a short term vs long term objectives ppt powerpoint presentation background image. This is a two stage process. The stages in this process are long term objectives, financial plan.

Slides You Need For Your Pitch Deck Ppt PowerPoint Presentation Gallery Sample
This is a slides you need for your pitch deck ppt powerpoint presentation gallery sample. This is a ten stage process. The stages in this process are value proposition, underlying magic, business model, financial projections, management team.
Emphasis On Geographic And Product Expansion Ppt PowerPoint Presentation Icon Mockup
This is a emphasis on geographic and product expansion ppt powerpoint presentation icon mockup. This is a seven stage process. The stages in this process are investment benefits, better logistics, diversification, stable infrastructure, location benefits, financial benefits, cultural benefits.
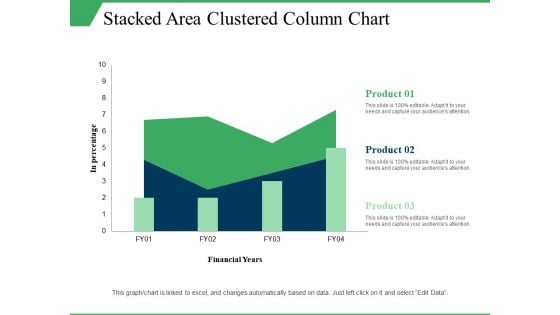
Stacked Area Clustered Column Chart Ppt PowerPoint Presentation Visual Aids Model
This is a stacked area clustered column chart ppt powerpoint presentation visual aids model. This is a three stage process. The stages in this process are in percentage, product, financial years, growth, column chart.

Investment Planning Factors Economy Trade Profit Ppt PowerPoint Presentation Ideas Slide
This is a investment planning factors economy trade profit ppt powerpoint presentation ideas slide. This is a eight stage process. The stages in this process are financial management, wealth management, investment management.
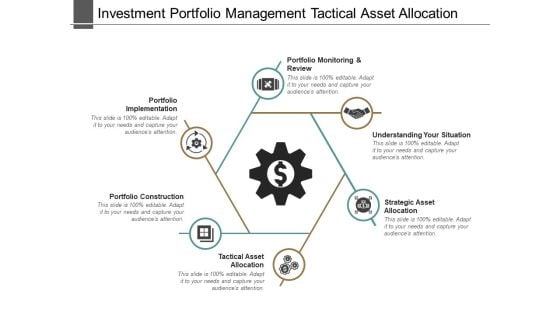
Investment Portfolio Management Tactical Asset Allocation Ppt PowerPoint Presentation Inspiration Influencers
This is a investment portfolio management tactical asset allocation ppt powerpoint presentation inspiration influencers. This is a six stage process. The stages in this process are financial management, wealth management, investment management.
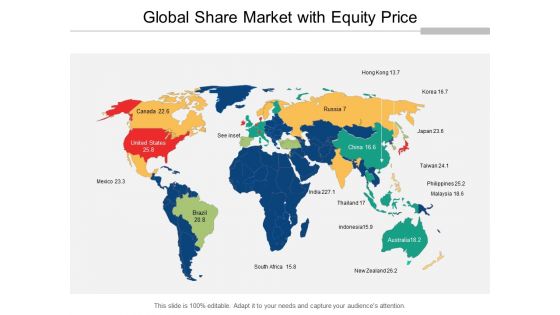
Global Share Market With Equity Price Ppt Powerpoint Presentation Inspiration Mockup
This is a global share market with equity price ppt powerpoint presentation inspiration mockup. This is a five stage process. The stages in this process are stock market, financial market, bull market.

Stock Market Trend Dollar Sign On Bar Graph Ppt Powerpoint Presentation Show Deck
This is a stock market trend dollar sign on bar graph ppt powerpoint presentation show deck. This is a four stage process. The stages in this process are stock market, financial market, bull market.

Stock Market Trends Of Five Countries Ppt Powerpoint Presentation Model Guidelines
This is a stock market trends of five countries ppt powerpoint presentation model guidelines. This is a four stage process. The stages in this process are stock market, financial market, bull market.
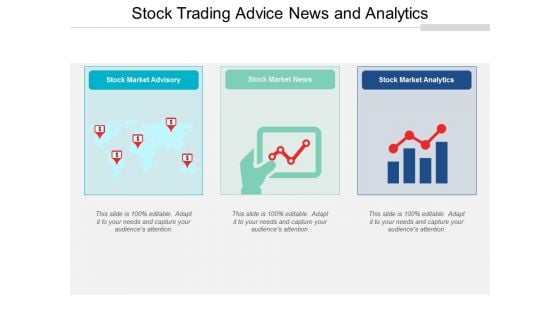
Stock Trading Advice News And Analytics Ppt Powerpoint Presentation Show Design Inspiration
This is a stock trading advice news and analytics ppt powerpoint presentation show design inspiration. This is a three stage process. The stages in this process are stock market, financial market, bull market.
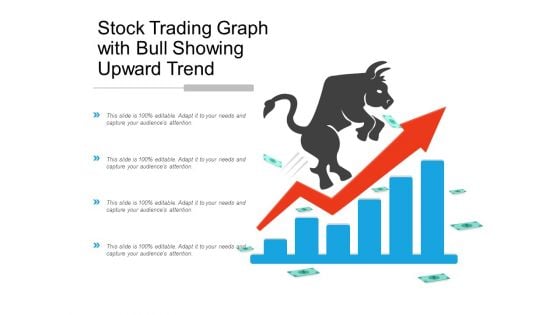
Stock Trading Graph With Bull Showing Upward Trend Ppt Powerpoint Presentation Pictures Outfit
This is a stock trading graph with bull showing upward trend ppt powerpoint presentation pictures outfit. This is a four stage process. The stages in this process are stock market, financial market, bull market.
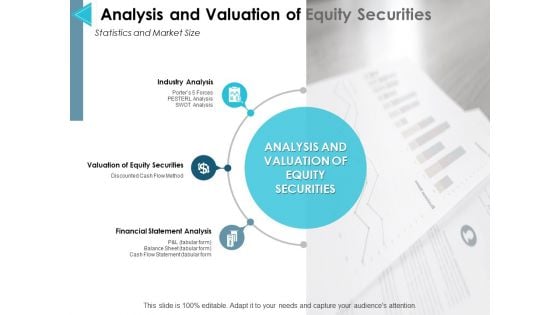
Analysis And Valuation Of Equity Securities Ppt PowerPoint Presentation Show Infographics
This is a analysis and valuation of equity securities ppt powerpoint presentation show infographics. This is a three stage process. The stages in this process are industry analysis, financial statement analysis, management, marketing, business, strategy.
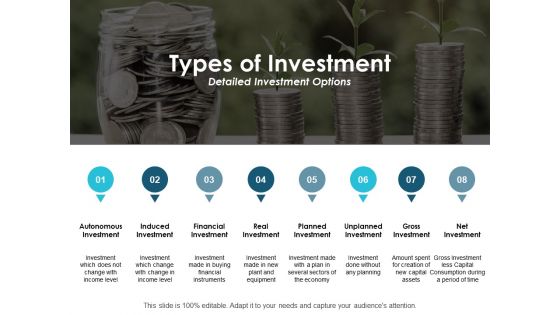
Types Of Investment Detailed Investment Options Ppt PowerPoint Presentation Pictures Graphics Tutorials
This is a types of investment detailed investment options ppt powerpoint presentation pictures graphics tutorials. This is a eight stage process. The stages in this process are financial investment, planned investment, gross investment, induced investment, process.

Three Human Faces In Question Mark Shape Powerpoint Templates
Adjust the above image into your Presentations to visually support your content. This slide has been professionally designed to financial targets. This template offers an excellent background to build impressive presentation.
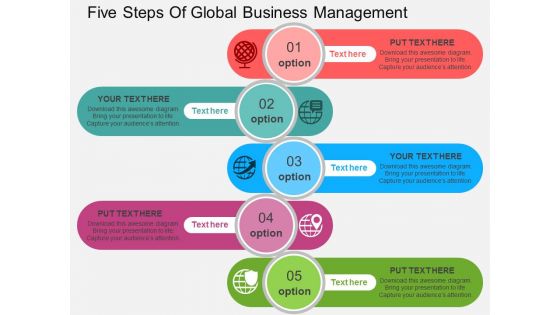
Five Steps Of Global Business Management Powerpoint Templates
Our above business diagram has been designed with graphics of six tags with icons. This slide is suitable to present financial planning. Use this business diagram to present your work in a more smart and precise manner.
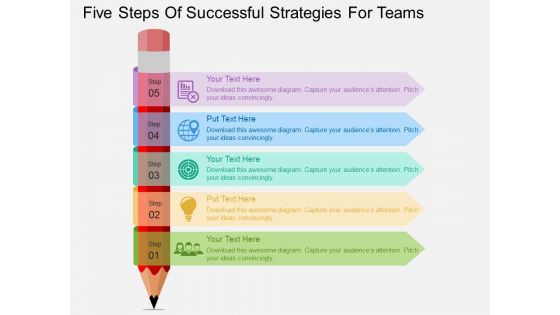
Five Steps Of Successful Strategies For Teams Powerpoint Templates
Our above business diagram has been designed with graphics of six tags with icons. This slide is suitable to present financial management. Use this business diagram to present your work in a more smart and precise manner.
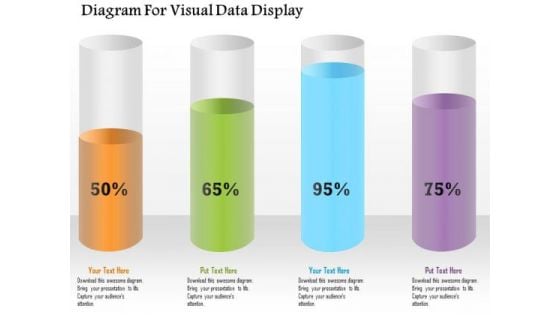
Business Diagram Diagram For Visual Data Display Presentation Template
Four colored cylindrical bars with percentage values are used to design this power point template. This diagram slide helps to display financial data analysis. Use this diagram for your business and finance related presentations.
Four Twisted Arrows With Creative Icons Powerpoint Template
This PowerPoint template has been designed with four twisted arrows and creative icons. This business diagram helps to exhibit financial accounting systems. Use this diagram to build an exclusive presentation.
Four Tags With Finance And Growth Icons Powerpoint Template
Our above business diagram has been designed with graphics of four text tags with icons. This business may be used to display financial strategy. Use this PowerPoint template to present your work in a more smart and precise manner.
Four Staged Colored Tags And Finance Icons Powerpoint Template
Our above business diagram has been designed with graphics of four text tags with icons. This business may be used to display financial strategy. Use this PowerPoint template to present your work in a more smart and precise manner.
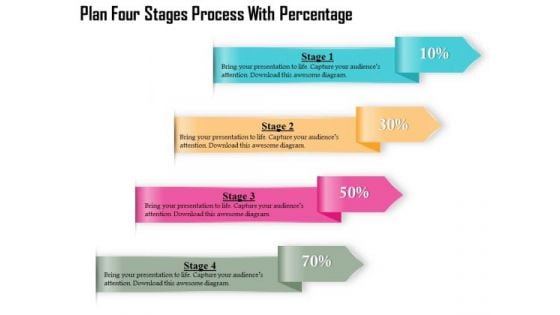
Business Diagram Four Stages Process With Percentage Presentation Template
Four multicolored tags in vertical order has been used to decorate this business diagram. This diagram contains the concept of financial data display with percent values. This diagram can be used for management and finance related presentations.

Business Diagram Three Stages Process Percentage Presentation Template
Three multicolored tags in vertical order has been used to decorate this business diagram. This diagram contains the concept of financial data display with percent values. This diagram can be used for management and finance related presentations.
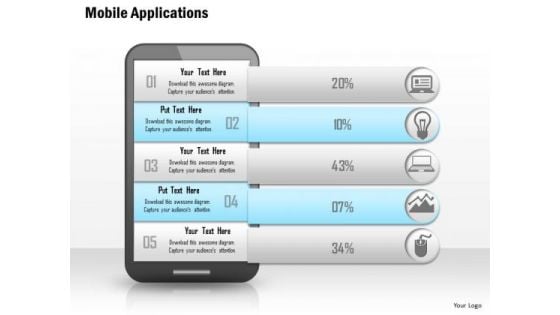
Business Diagram Mobile Applications Vector Illustration Concept Presentation Template
As mobile have become an indispensible part of our daily lives. This amazing mobile application icons will also add great value to your ideas and presentations in the fields of telecommunications, travelling, banks and financial institutions, e-Learning etc.
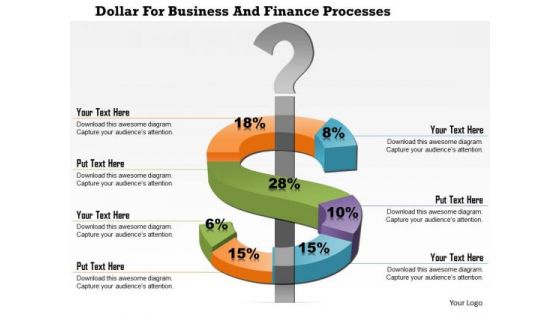
Business Diagram Dollar For Business And Finance Processes Presentation Template
This business diagram displays dollar symbol around a question mark. This diagram depicts change in dollar currency value. Use this slide to make financial and business reports and presentations.
Pie Chart With Seven Business Icons Powerpoint Templates
Our compelling template consists with a design of pie chart with seven business icons. This slide has been professionally designed to exhibit financial ratio analysis. This template offers an excellent background to build impressive presentation.
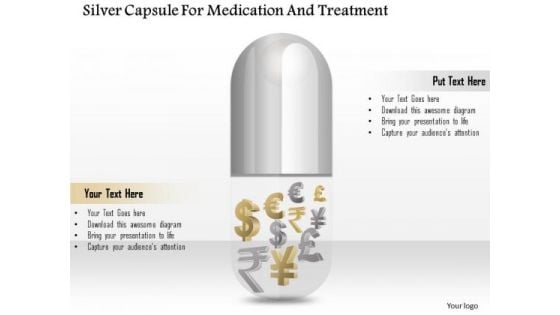
Business Diagram Silver Capsule For Medication And Treatment Presentation Template
This business diagram displays graphics of capsule with currency symbol. It contains silver capsule with different currency signs inside it. Use this slide for health care and financial topics. Get professional with this exclusive business slide.
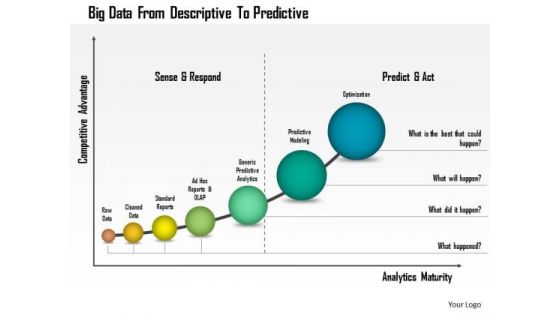
Business Diagram Big Data From Descriptive To Predictive Presentation Template
This business diagram has been designed with graphic of linear bar graph. This growing bar graph depicts the concept of big data analysis. Use this professional diagram for your financial and business analysis.
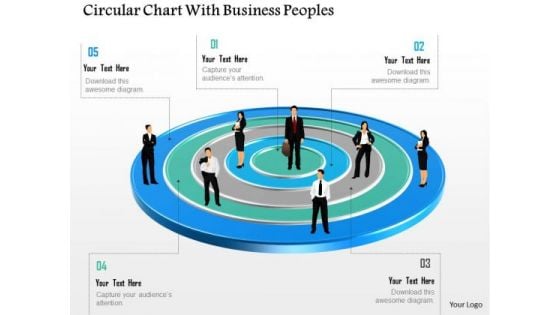
Business Diagram Circular Chart With Business Peoples Presentation Template
This business diagram has been designed with graphic of business people on circular chart. This diagram is designed to depict team meeting on financial matter. This diagram offers a way for your audience to visually conceptualize the process.
Colorful Cards With Icons For Technology Powerpoint Templates
This slide has been designed with graphics of colorful cards with icons of bulb, dollar, gear and magnifier. You may download this slide for financial analysis. Deliver amazing presentations to mesmerize your audience.
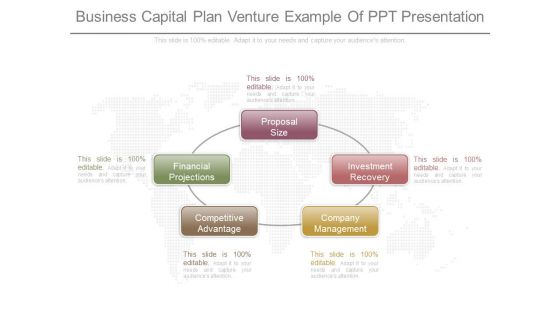
Business Capital Plan Venture Example Of Ppt Presentation
This is a business capital plan venture example of ppt presentation. This is a five stage process. The stages in this process are proposal size, financial projections, competitive advantage, company management, investment recovery.
Stock Market Analysis Magnifying Glass Over Bar Graph And Dollar Sign Ppt PowerPoint Presentation Icon Visual Aids
This is a stock market analysis magnifying glass over bar graph and dollar sign ppt powerpoint presentation icon visual aids. This is a four stage process. The stages in this process are stock market, financial markets, bull market.
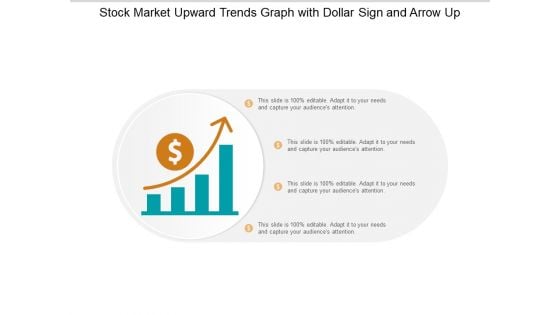
Stock Market Upward Trends Graph With Dollar Sign And Arrow Up Ppt PowerPoint Presentation Professional Graphics Download
This is a stock market upward trends graph with dollar sign and arrow up ppt powerpoint presentation professional graphics download. This is a four stage process. The stages in this process are stock market, financial markets, bull market.

Benefits Of Internet Ppt Example Ppt Presentation
This is a benefits of internet ppt example ppt presentation. This is a five stage process. The stages in this process are financial transaction, for updates, education, research, communication.
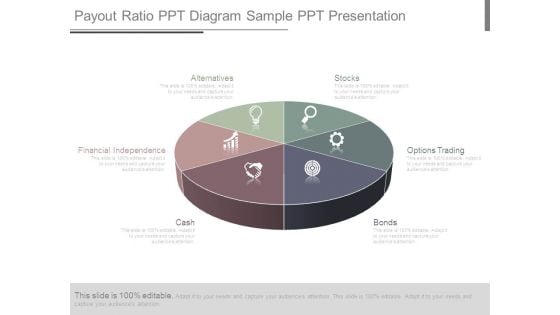
Payout Ratio Ppt Diagram Sample Ppt Presentation
This is a payout ratio ppt diagram sample ppt presentation. This is a six stage process. The stages in this process are stocks, options trading, bonds, cash, financial independence, alternatives.
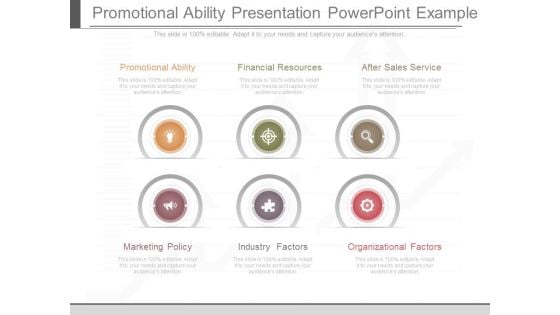
Promotional Ability Presentation Powerpoint Example
This is a promotional ability presentation powerpoint example. This is a six stage process. The stages in this process are promotional ability, financial resources, after sales service, marketing policy, industry factors, organizational factors.
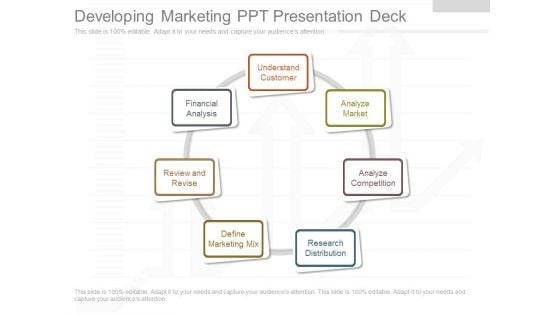
Developing Marketing Ppt Presentation Deck
This is a developing marketing ppt presentation deck. This is a seven stage process. The stages in this process are understand customer, analyze market, analyze competition, research distribution, define marketing mix, review and revise, financial analysis.
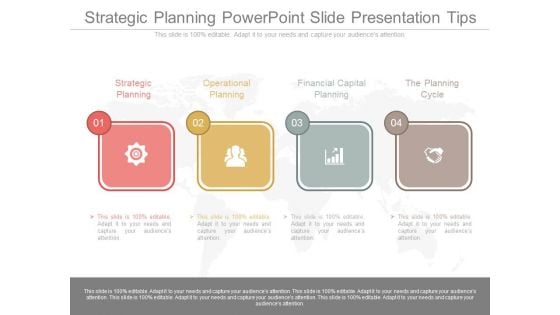
Strategic Planning Powerpoint Slide Presentation Tips
This is a strategic planning powerpoint slide presentation tips. This is a four stage process. The stages in this process are strategic planning, operational planning, financial capital planning, the planning cycle.

Stock Photo Pile Of Dollars Chained And Locked PowerPoint Slide
This image displays dollar bundles locked in chains. Use this image slide, in your PowerPoint presentations to express views on financial security and monetary savings. This image will enhance the quality of your presentations.
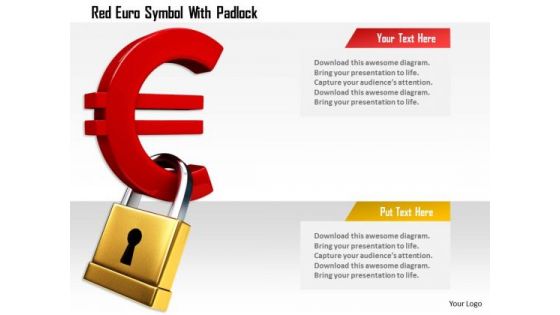
Stock Photo Red Euro Symbol With Padlock PowerPoint Slide
This image slide displays red color Euro symbol with padlock. Use this image, in your PowerPoint presentations to express views on financial security and monetary savings. This image slide will enhance the quality of your presentations.
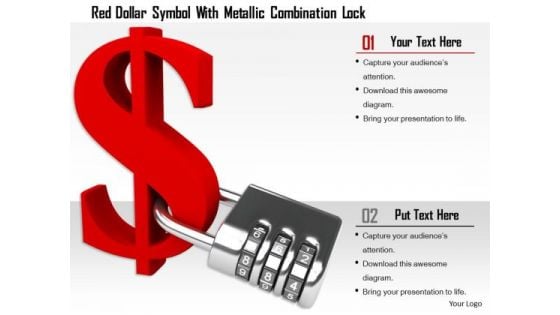
Stock Photo Red Dollar Symbol With Metallic Combination Lock PowerPoint Slide
This image slide displays red color dollar symbol with combination lock. Use this image, in your PowerPoint presentations to express views on financial security and monetary savings. This image slide will enhance the quality of your presentations.
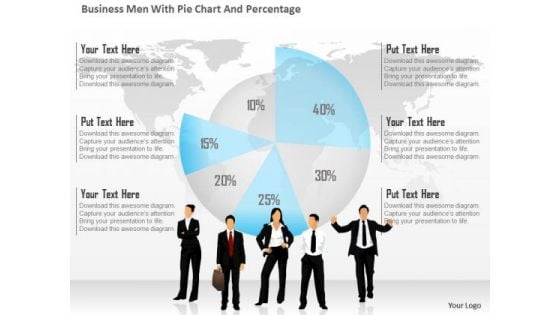
Business Diagram Business Men With Pie Chart And Percentage Presentation Template
This business diagram has been designed with graphic of business people and pie chart with percentage. This diagram is designed to depict team meeting on financial matter. This diagram offers a way for your audience to visually conceptualize the process.
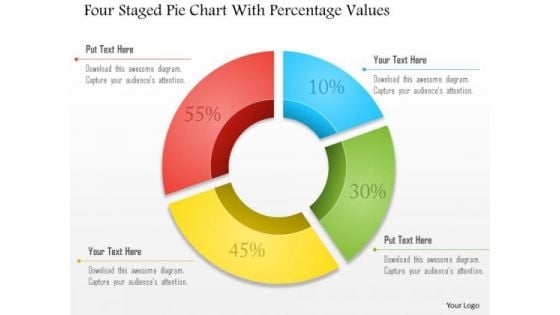
Business Diagram Four Staged Pie Chart With Percentage Values Presentation Template
Four staged pie chart and percentage values are used to design this business slide. Download this diagram to make business and financial reports. Use our above diagram to express information in a visual way.

Competitive Advantage In Marketing Powerpoint Presentation
This is a competitive advantage in marketing powerpoint presentation. This is a six stage process. The stages in this process are sustainable competitive advantage, marketing strategy, operations strategy, innovation strategy, human resource strategy, financial strategy.
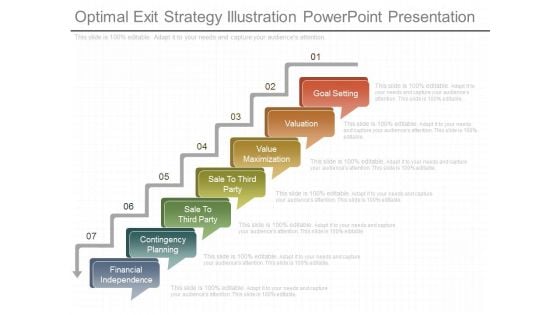
Optimal Exit Strategy Illustration Powerpoint Presentation
This is a optimal exit strategy illustration powerpoint presentation. This is a seven stage process. The stages in this process are goal setting, valuation, value maximization, sale to third party, sale to third party, contingency planning, financial independence.
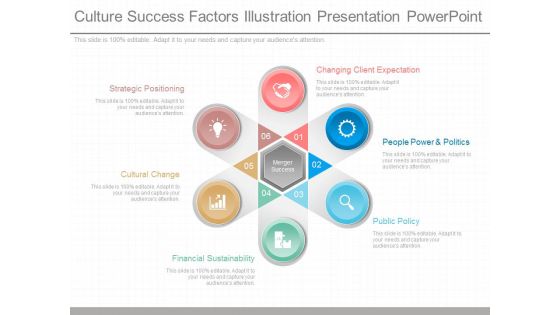
Culture Success Factors Illustration Presentation Powerpoint
This is a culture success factors illustration presentation powerpoint. This is a six stage process. The stages in this process are merger success, changing client expectation, people power and politics, public policy, financial sustainability, cultural change, strategic positioning.
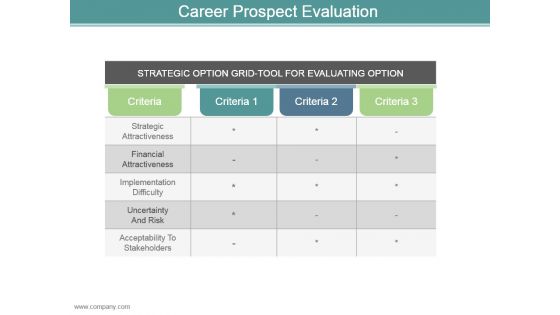
Career Prospect Evaluation Powerpoint Presentation Examples
This is a career prospect evaluation powerpoint presentation examples. This is a three stage process. The stages in this process are financial attractiveness, strategic attractiveness, implementation difficulty, uncertainty and risk, acceptability to stakeholders.
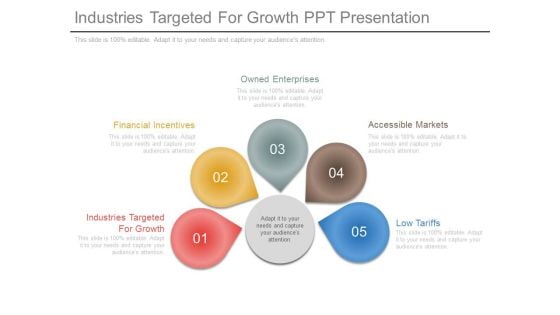
Industries Targeted For Growth Ppt Presentation
This is an industries targeted for growth ppt presentation. This is a five stage process. The stages in this process are owned enterprises, accessible markets, financial incentives, industries targeted for growth, low tariffs, accessible markets.\n\n
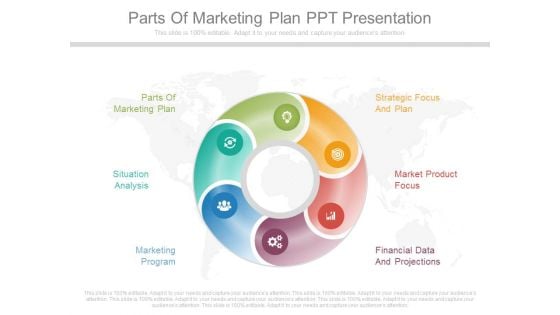
Parts Of Marketing Plan Ppt Presentation
This is a parts of marketing plan ppt presentation. This is a six stage process. The stages in this process are parts of marketing plan, strategic focus and plan, situation analysis, market product focus, marketing program, financial data and projections.
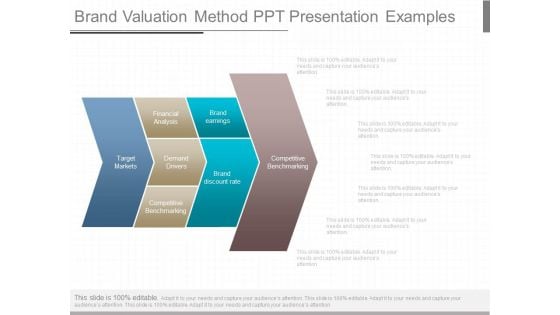
Brand Valuation Method Ppt Presentation Examples
This is a brand valuation method ppt presentation examples. This is a four stage process. The stages in this process are target markets, financial analysis, demand drivers, competitive benchmarking, brand earnings, brand discount rate, competitive benchmarking.
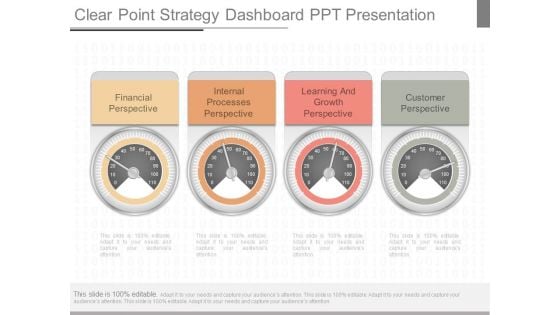
Clear Point Strategy Dashboard Ppt Presentation
This is a clear point strategy dashboard ppt presentation. This is a four stage process. The stages in this process are financial perspective, internal processes perspective, learning and growth perspective, customer perspective.

Rural Marketing Example Of Ppt Presentation
This is a rural marketing example of ppt presentation. This is a six stage process. The stages in this process are urban market competition, improved infrastructure, saturated urban market, new employment opportunities, financial institutions, large population.
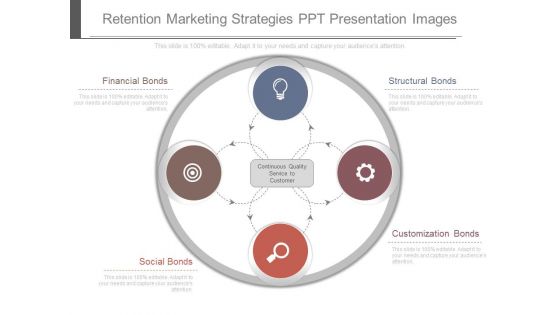
Retention Marketing Strategies Ppt Presentation Images
This is a retention marketing strategies ppt presentation images. This is a four stage process. The stages in this process are financial bonds, social bonds, continuous quality service to customer, structural bonds, customization bonds.
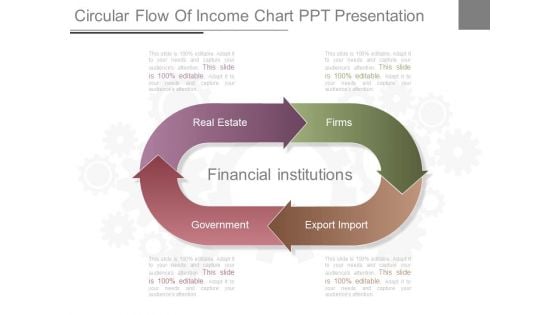
Circular Flow Of Income Chart Ppt Presentation
This is a circular flow of income chart ppt presentation. This is a four stage process. The stages in this process are real estate, government, financial institutions, export import, firms.
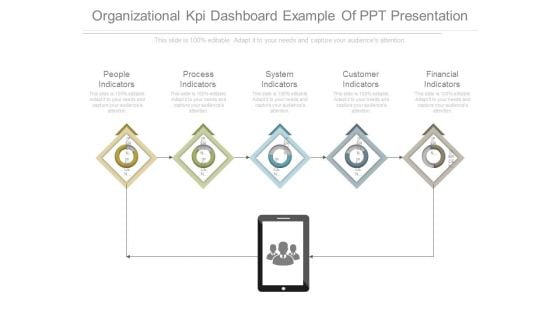
Organizational Kpi Dashboard Example Of Ppt Presentation
This is a organizational kpi dashboard example of ppt presentation. This is a five stage process. The stages in this process are people indicators, process indicators, system indicators, customer indicators, financial indicators.
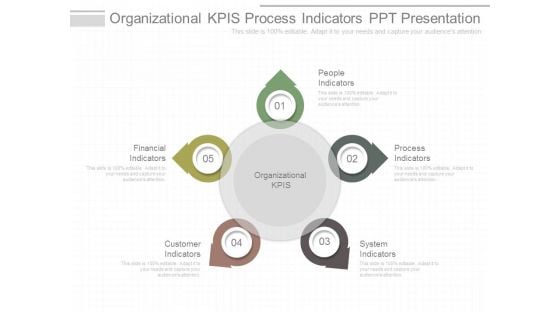
Organizational Kpis Process Indicators Ppt Presentation
This is a organizational kpis process indicators ppt presentation. This is a five stage process. The stages in this process are people indicators, process indicators, system indicators, customer indicators, financial indicators, organizational kpis.
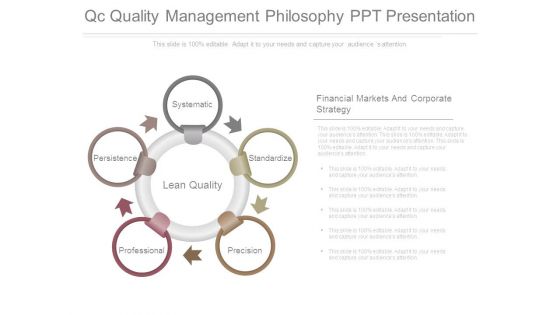
Qc Quality Management Philosophy Ppt Presentation
This is a qc quality management philosophy ppt presentation. This is a five stage process. The stages in this process are systematic, standardize, precision, professional, persistence, lean quality, financial markets and corporate strategy.
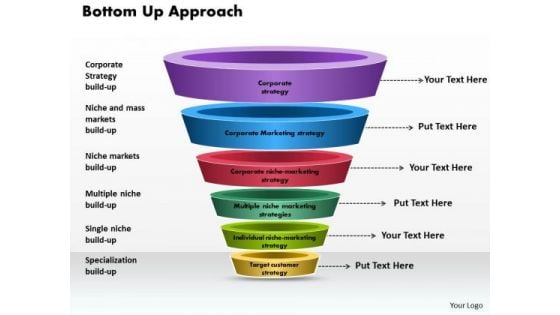
Business Framework Bottom Up Approach PowerPoint Presentation
This power point diagram slide has been crafted with bottom up approach. In this diagram, we have used multilevel funnel diagram with individual state. Use this diagram for your financial presentations and display bottom up approach in an graphical manner.


 Continue with Email

 Home
Home


