Financial Summary
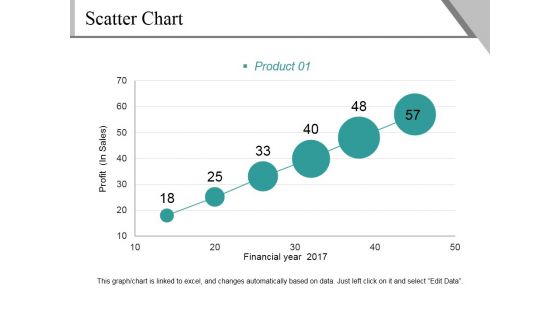
Scatter Chart Ppt PowerPoint Presentation File Background Image
This is a scatter chart ppt powerpoint presentation file background image. This is a six stage process. The stages in this process are profit, financial year, product, growth, success.
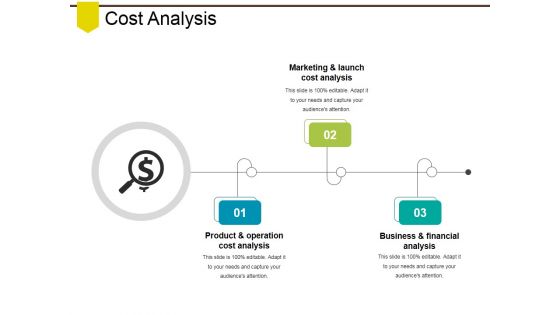
Cost Analysis Ppt PowerPoint Presentation Infographics Visual Aids
This is a cost analysis ppt powerpoint presentation infographics visual aids. This is a three stage process. The stages in this process are product and operation cost analysis, marketing and launch cost analysis, business and financial analysis.
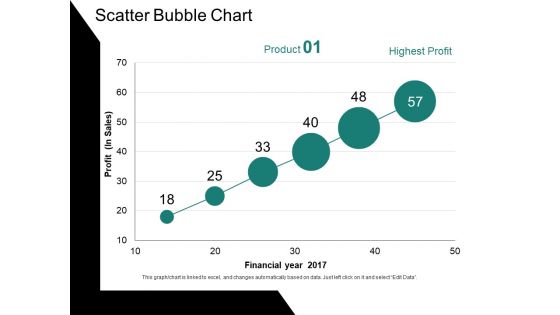
Scatter Bubble Chart Ppt PowerPoint Presentation Ideas Gallery
This is a scatter bubble chart ppt powerpoint presentation ideas gallery. This is a six stage process. The stages in this process are profit, financial year, chart, business, growth.
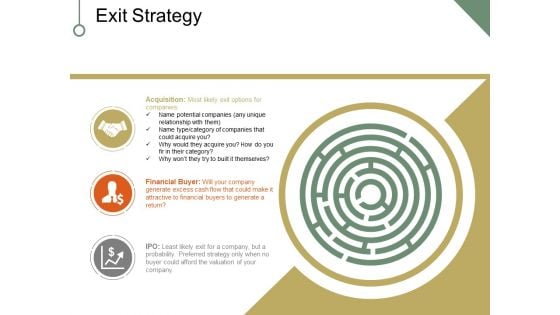
Exit Strategy Ppt PowerPoint Presentation Infographics Graphic Tips
This is a exit strategy ppt powerpoint presentation infographics graphic tips. This is a three stage process. The stages in this process are acquisition, financial buyer, ipo, maze, business.

Line Chart Ppt PowerPoint Presentation Infographics Graphic Images
This is a line chart ppt powerpoint presentation infographics graphic images. This is a two stage process. The stages in this process are sales in percentage, financial years, growth, business, marketing.
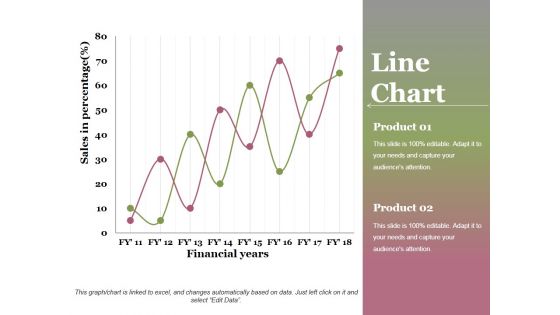
Line Chart Ppt PowerPoint Presentation Professional Graphics Design
This is a line chart ppt powerpoint presentation professional graphics design. This is a two stage process. The stages in this process are financial years, sales in percentage, product, growth, success.
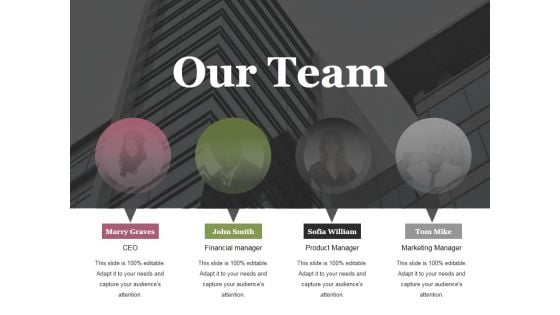
Our Team Ppt PowerPoint Presentation Portfolio Example Introduction
This is a our team ppt powerpoint presentation portfolio example introduction. This is a four stage process. The stages in this process are ceo, financial manager, product manager, marketing manager.
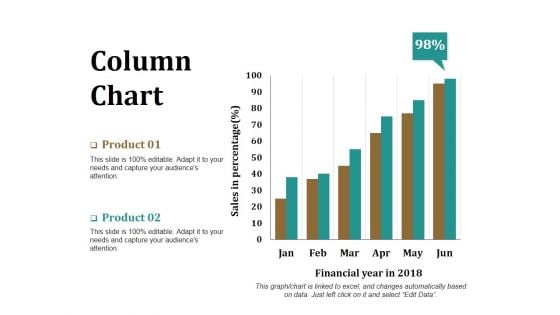
Column Chart Ppt PowerPoint Presentation Model Graphics Download
This is a column chart ppt powerpoint presentation model graphics download. This is a two stage process. The stages in this process are product, financial year, sales in percentage, bar graph, success.
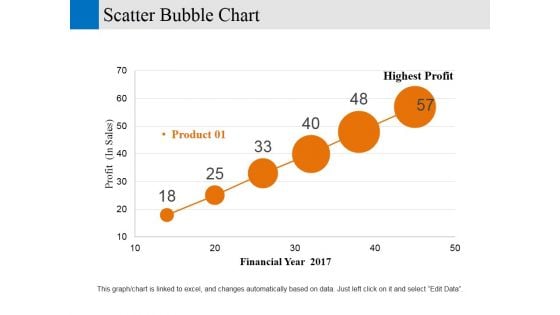
Scatter Bubble Chart Ppt PowerPoint Presentation Gallery Designs Download
This is a scatter bubble chart ppt powerpoint presentation gallery designs download. This is a six stage process. The stages in this process are financial year, profit, business, marketing, strategy.
Clustered Column Line Ppt PowerPoint Presentation Icon Good
This is a clustered column line ppt powerpoint presentation icon good. This is a three stage process. The stages in this process are product, financial year, bar graph, business, growth.
Our Team Ppt PowerPoint Presentation Icon Graphic Images
This is a our team ppt powerpoint presentation icon graphic images. This is a four stage process. The stages in this process are our team, ceo, marketing manager, product manager, financial manager.
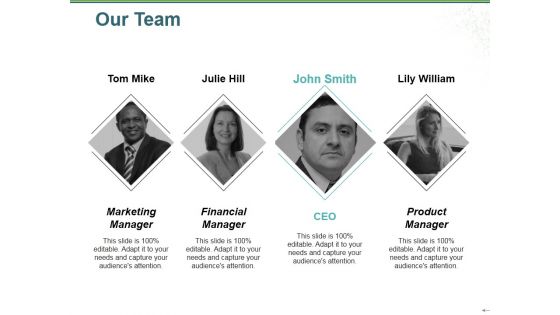
Our Team Ppt PowerPoint Presentation Ideas Design Ideas
This is a our team ppt powerpoint presentation ideas design ideas. This is a four stage process. The stages in this process are marketing manager, financial manager, ceo, product manager, teamwork.

Our Team Ppt PowerPoint Presentation Ideas Background Designs
This is a our team ppt powerpoint presentation ideas background designs. This is a four stage process. The stages in this process are financial advisor, manager, web designer, ceo.
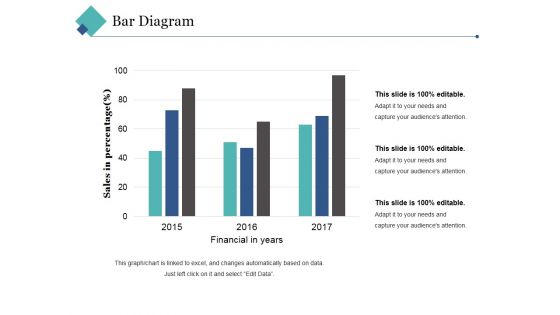
Bar Diagram Ppt PowerPoint Presentation Pictures Background Image
This is a bar diagram ppt powerpoint presentation pictures background image. This is a three stage process. The stages in this process are financial in years, sales in percentage, bar graph, growth, success.
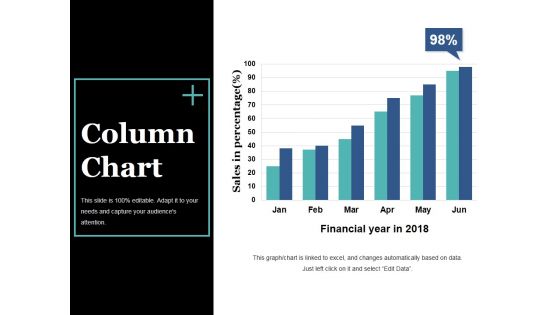
Column Chart Ppt PowerPoint Presentation Slides Visual Aids
This is a column chart ppt powerpoint presentation slides visual aids. This is a six stage process. The stages in this process are bar graph, growth, success, sales in percentage, financial year.
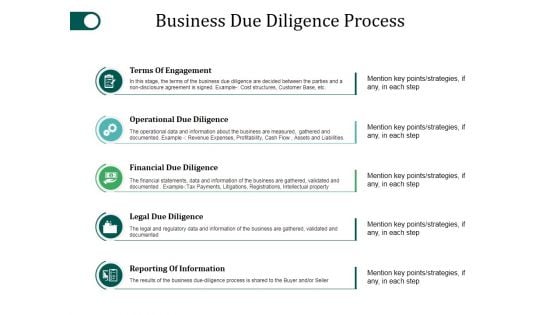
Business Due Diligence Process Ppt PowerPoint Presentation Slides File Formats
This is a business due diligence process ppt powerpoint presentation slides file formats. This is a five stage process. The stages in this process are terms of engagement, operational due diligence, financial due diligence, legal due diligence.
Business Due Diligence Process Ppt PowerPoint Presentation Icon Elements
This is a business due diligence process ppt powerpoint presentation icon elements. This is a five stage process. The stages in this process are terms of engagement, operational due diligence, financial due diligence, legal due diligence, reporting of information.

Meet Our Team Ppt PowerPoint Presentation Portfolio Example
This is a meet our team ppt powerpoint presentation portfolio example. This is a four stage process. The stages in this process are financial advisor, web designer, manager, ceo.
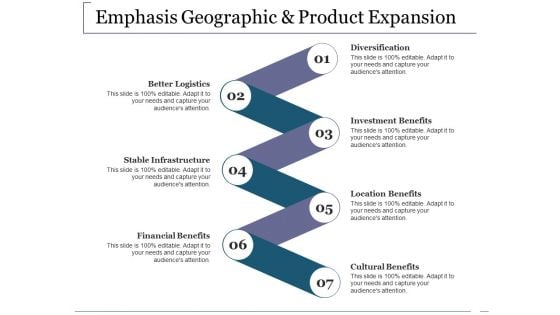
Emphasis Geographic And Product Expansion Ppt PowerPoint Presentation Inspiration Good
This is a emphasis geographic and product expansion ppt powerpoint presentation inspiration good. This is a seven stage process. The stages in this process are better logistics, stable infrastructure, financial benefits, diversification, investment benefits.
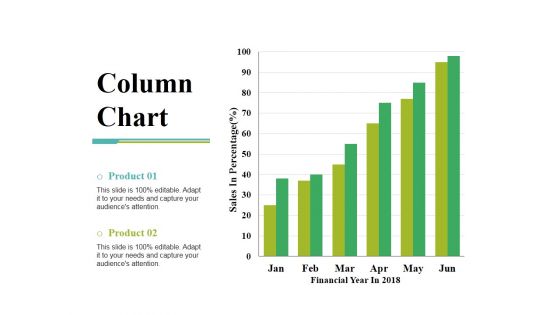
Column Chart Ppt PowerPoint Presentation Gallery Slide Portrait
This is a column chart ppt powerpoint presentation gallery slide portrait. This is a two stage process. The stages in this process are sales in percentage, financial year, product, bar graph, growth.
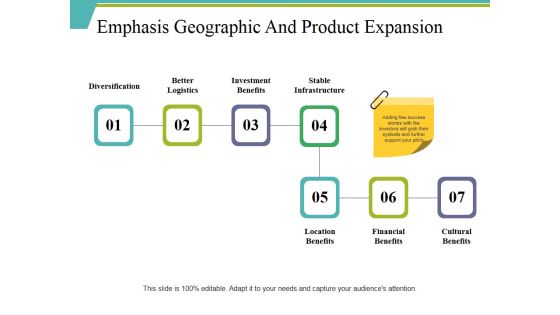
Emphasis Geographic And Product Expansion Ppt PowerPoint Presentation Gallery Rules
This is a emphasis geographic and product expansion ppt powerpoint presentation gallery rules. This is a seven stage process. The stages in this process are diversification, investment benefits, stable infrastructure, financial benefits, cultural benefits.
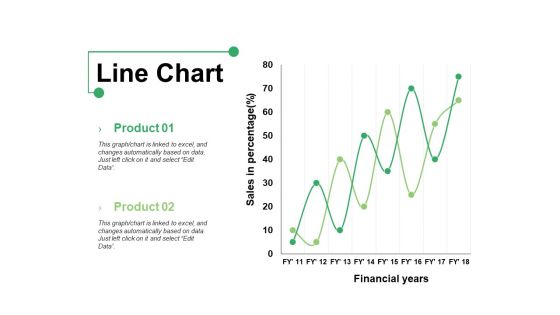
Line Chart Ppt PowerPoint Presentation Show Graphics Example
This is a line chart ppt powerpoint presentation show graphics example. This is a two stage process. The stages in this process are product, line chart, financial years, sales in percentage.
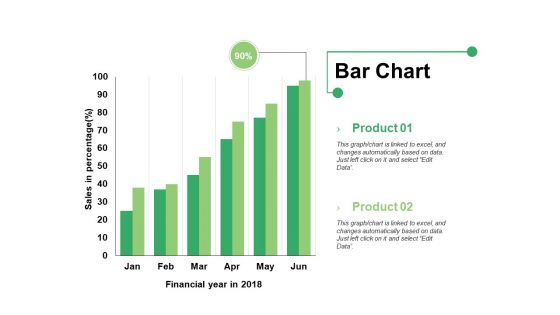
Bar Chart Ppt PowerPoint Presentation Infographics Format Ideas
This is a bar chart ppt powerpoint presentation infographics format ideas. This is a two stage process. The stages in this process are bar graph, product, financial year, sales in percentage.

Our Team Ppt PowerPoint Presentation Inspiration Graphics Download
This is a our team ppt powerpoint presentation inspiration graphics download. This is a three stage process. The stages in this process are marketing manager, financial manager, product manager.
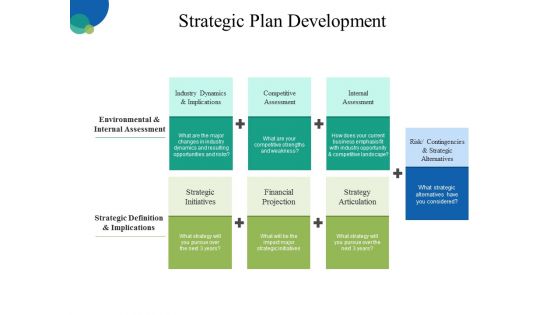
Strategic Plan Development Ppt PowerPoint Presentation Show Ideas
This is a strategic plan development ppt powerpoint presentation show ideas. This is a seven stage process. The stages in this process are competitive assessment, internal assessment, competitive assessment, strategic initiatives, financial projection.
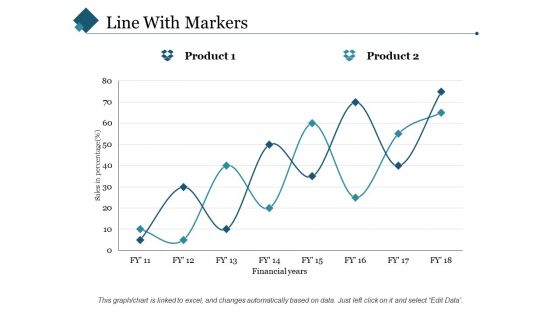
Line With Markers Ppt PowerPoint Presentation Styles Slide Portrait
This is a line with markers ppt powerpoint presentation styles slide portrait. This is a two stage process. The stages in this process are sales in percentage, financial years, product.
Strategic Plan Development Ppt PowerPoint Presentation Gallery Icons
This is a strategic plan development ppt powerpoint presentation gallery icons. This is a six stage process. The stages in this process are competitive assessment, internal assessment, financial projection, strategic initiatives, strategy articulation.
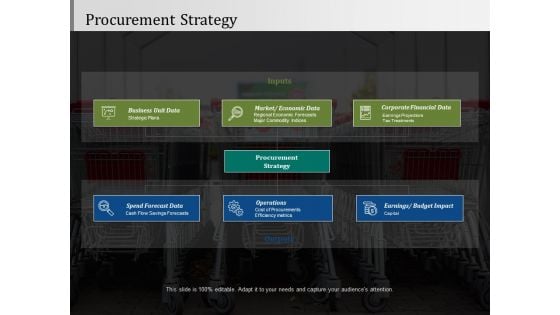
Procurement Strategy Ppt PowerPoint Presentation Slides Graphic Images
This is a procurement strategy ppt powerpoint presentation slides graphic images. This is a seven stage process. The stages in this process are operations, business unit data, spend forecast data, corporate financial data.

Our Team Ppt PowerPoint Presentation Show Example Topics
This is a our team ppt powerpoint presentation show example topics. This is a three stage process. The stages in this process are marketing manager, financial manager, product manager, our team, communication.
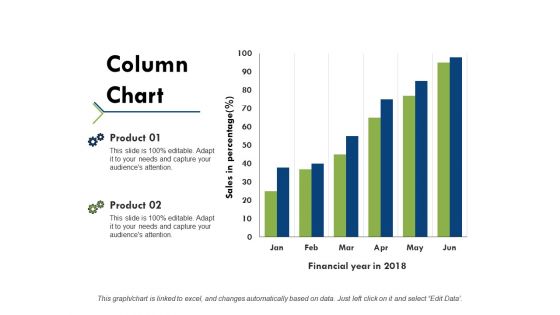
Column Chart Ppt PowerPoint Presentation Portfolio Example Topics
This is a column chart ppt powerpoint presentation portfolio example topics. This is a two stage process. The stages in this process are product, financial year, sales in percentage, column chart.
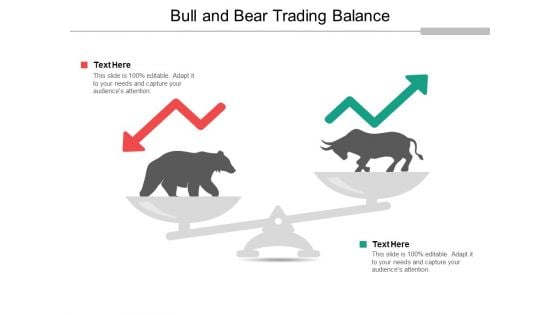
Bull And Bear Trading Balance Ppt Powerpoint Presentation Infographics Designs
This is a bull and bear trading balance ppt powerpoint presentation infographics designs. This is a two stage process. The stages in this process are stock market, financial market, bull market.
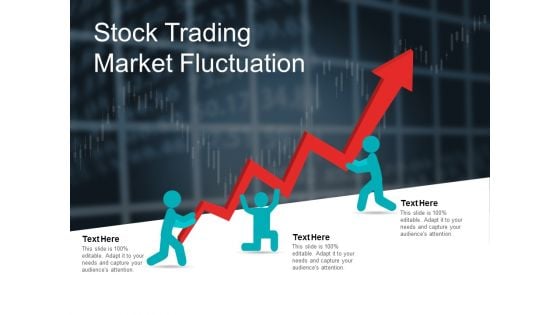
Stock Trading Market Fluctuation Ppt Powerpoint Presentation Professional Visuals
This is a stock trading market fluctuation ppt powerpoint presentation professional visuals. This is a three stage process. The stages in this process are stock market, financial market, bull market.
Stock Trading Market Risk Assessment Ppt Powerpoint Presentation Portfolio Icons
This is a stock trading market risk assessment ppt powerpoint presentation portfolio icons. This is a four stage process. The stages in this process are stock market, financial market, bull market.
Annual Report Vector Icon Ppt Powerpoint Presentation File Gridlines
This is a annual report vector icon ppt powerpoint presentation file gridlines. This is a three stage process. The stages in this process are financial statements icon, accounting ratio icon, balance sheet icon.
Balance Sheet Vector Icon Ppt Powerpoint Presentation Designs Download
This is a balance sheet vector icon ppt powerpoint presentation designs download. This is a three stage process. The stages in this process are financial statements icon, accounting ratio icon, balance sheet icon.
Income Statement And Auditing Vector Icon Ppt Powerpoint Presentation Clipart
This is a income statement and auditing vector icon ppt powerpoint presentation clipart. This is a three stage process. The stages in this process are financial statements icon, accounting ratio icon, balance sheet icon.
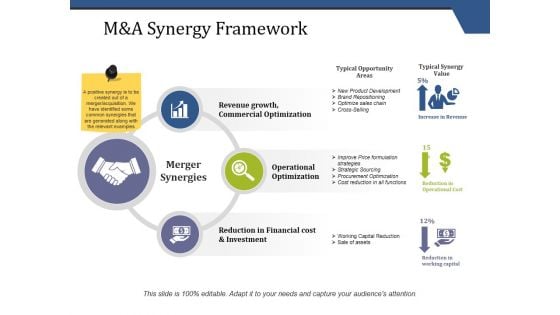
M And A Synergy Framework Ppt PowerPoint Presentation Gallery Graphics Tutorials
This is a m and a synergy framework ppt powerpoint presentation gallery graphics tutorials. This is a three stage process. The stages in this process are merger synergies, revenue growth, commercial optimization, operational optimization, reduction in financial cost and investment.
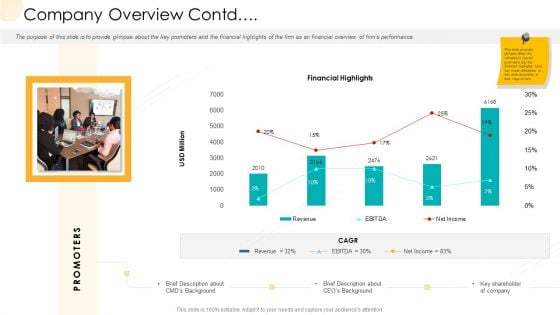
Company Process Handbook Company Overview Contd Ppt Slides Elements PDF
The purpose of this slide is to provide glimpse about the key promoters and the financial highlights of the firm as an financial overview of firms performance. Deliver an awe inspiring pitch with this creative company process handbook company overview contd ppt slides elements pdf bundle. Topics like company overview contd can be discussed with this completely editable template. It is available for immediate download depending on the needs and requirements of the user.
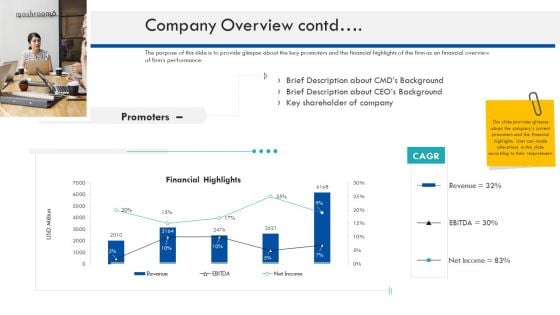
Enterprise Handbook Company Overview Contd Ppt Styles Themes PDF
The purpose of this slide is to provide glimpse about the key promoters and the financial highlights of the firm as an financial overview of firms performance. Deliver an awe inspiring pitch with this creative enterprise handbook company overview contd ppt styles themes pdf bundle. Topics like company overview contd can be discussed with this completely editable template. It is available for immediate download depending on the needs and requirements of the user.
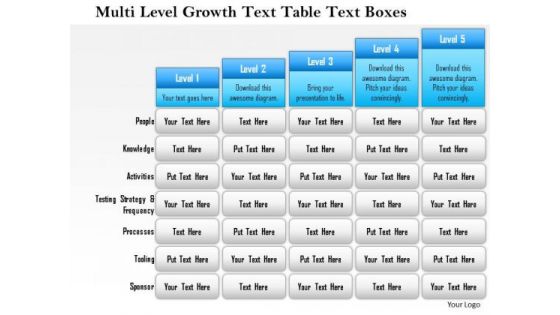
Business Framework Multi Level Growth Text Table Text Boxes 2 PowerPoint Presentation
Five staged text box style chart in bar graph design has been used to decorate this power point template slide. This diagram slide contains the multilevel growth concept. Use this PPT slide for financial growth and result analysis related topics.
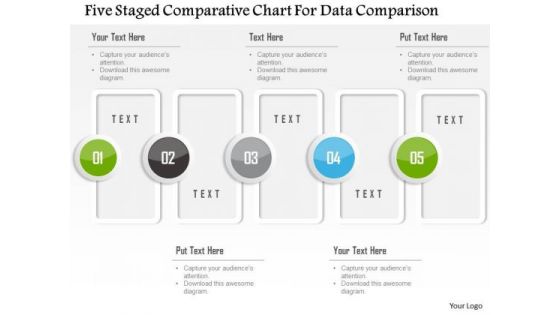
Business Diagram Five Staged Comparative Chart For Data Comparison Presentation Template
Five staged comparative chart has been used to design this power point template. This PPT contains the concept of data comparison. Use this PPT for your business and finance based data comparison in any financial presentation.
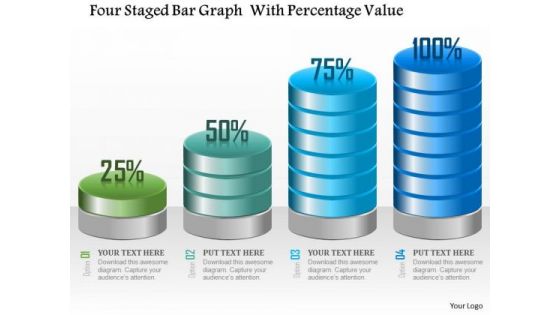
Business Diagram Four Staged Bar Graph With Percentage Value Presentation Template
Four staged bar graph with percentage value has been used to craft this power point template. This PPT contains the concept of making financial timeline and result analysis. This PPT can be used for business and finance related presentations.
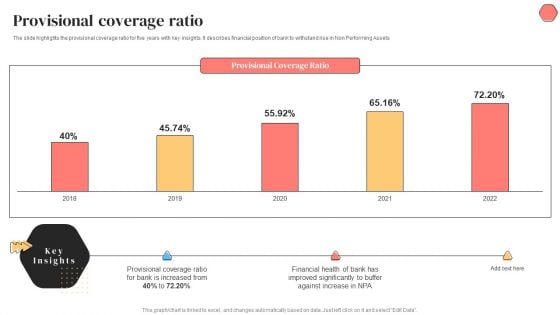
Banking Solutions Company Overview Provisional Coverage Ratio Guidelines PDF
The slide highlights the provisional coverage ratio for five years with key insights. It describes financial position of bank to withstand rise in Non Performing Assets. Deliver an awe inspiring pitch with this creative Banking Solutions Company Overview Provisional Coverage Ratio Guidelines PDF bundle. Topics like Provisional Coverage Ratio, Financial Health can be discussed with this completely editable template. It is available for immediate download depending on the needs and requirements of the user.
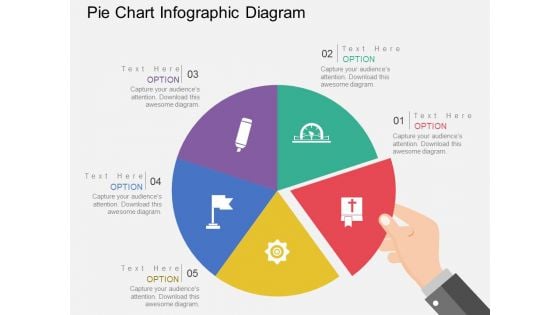
Pie Chart Infographic Diagram Powerpoint Templates
This Power Point template has been designed with pie chart infographic. This business slide is useful to present financial ratio analysis. Use this diagram to make business presentation. Illustrate these thoughts with this slide.
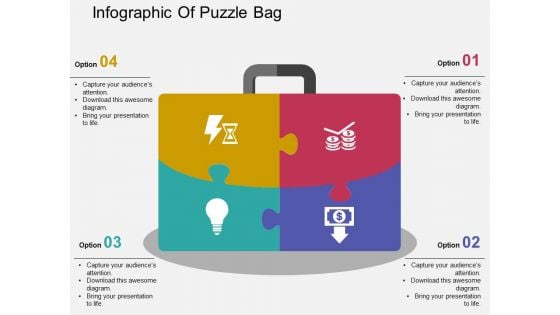
Infographic Of Puzzle Bag Powerpoint Templates
Adjust the above image into your presentations to visually support your content. This slide has been professionally designed with puzzle bag infographic. This template offers an excellent background to build financial target related presentation.
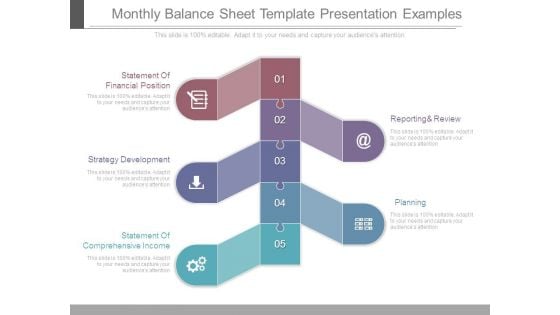
Monthly Balance Sheet Template Presentation Examples
This is a monthly balance sheet template presentation examples. This is a five stage process. The stages in this process are statement of financial position, strategy development, statement of comprehensive income, reporting and review, planning.
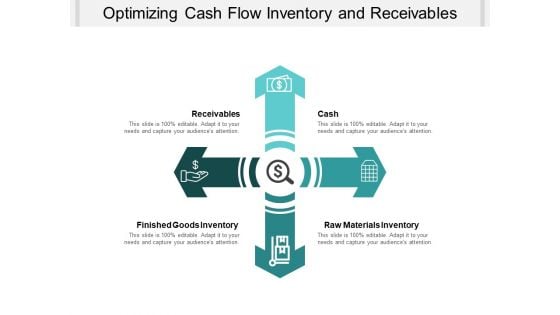
Optimizing Cash Flow Inventory And Receivables Ppt PowerPoint Presentation Portfolio Ideas
This is a optimizing cash flow inventory and receivables ppt powerpoint presentation portfolio ideas. This is a four stage process. The stages in this process are financial capital, working capital management, companys managerial accounting.
Six Stages Business Process With Icons Ppt PowerPoint Presentation Icon Format
This is a six stages business process with icons ppt powerpoint presentation icon format. This is a six stage process. The stages in this process are financial capital, working capital management, companys managerial accounting.
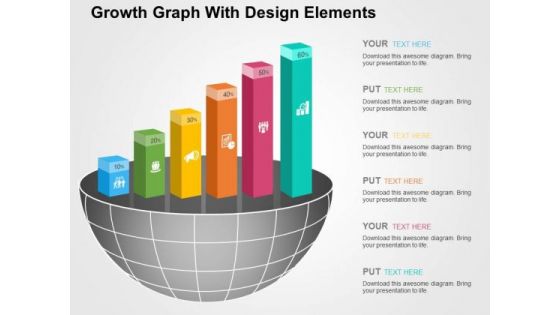
Growth Graph With Design Elements PowerPoint Templates
The above template displays growth bar graph. This PowerPoint template signifies the concept of business and financial planning. Adjust the above diagram in your business presentations to visually support your content.
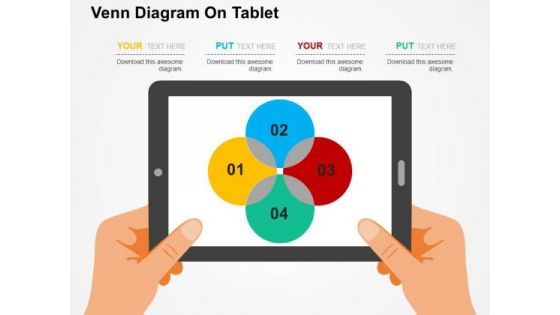
Venn Diagram On Tablet PowerPoint Template
Adjust the above image into your Presentations to visually support your content. This slide has been professionally designed with Venn diagram. This template offers an excellent background to display financial analysis.
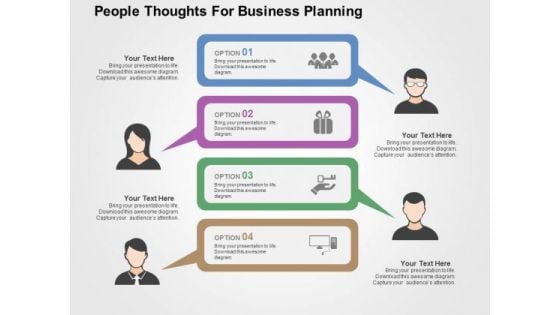
People Thoughts For Business Planning PowerPoint Templates
This creative slide has been designed with graphics of team icons. Use this unique slide in presentations related to business and financial planning. This template adds value to your idea.
Four Icons In Vertical Order PowerPoint Template
Concept of financial planning can be explained with this diagram. It contains graphics of four icons in vertical order. You can use this design to complement your business presentation.

Illustration Of Dollar Growth Graph PowerPoint Template
This business slide contains graphics of dollar symbols on graph. This diagram helps to portray concept of financial planning. Present your views using this innovative slide and be assured of leaving a lasting impression.
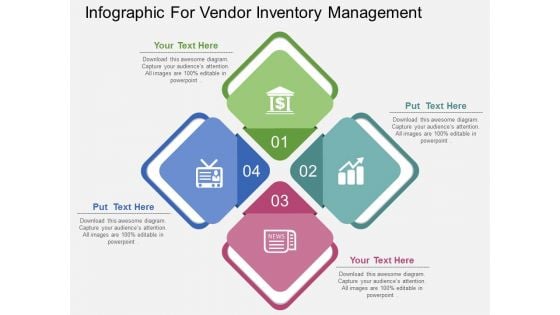
Infographic For Vendor Inventory Management Powerpoint Template
Our above slide display graphics of four connected steps with icons. Download this diagram slide to display financial management process. Adjust the above diagram in your business presentations to visually support your content.
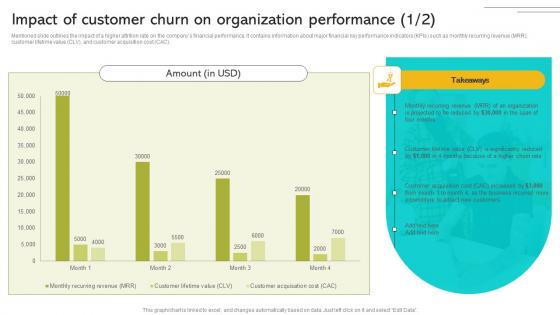
Implementing Strategies To Enhance Impact Of Customer Churn On Organization Performance Infographics PDF
Mentioned slide outlines the impact of a higher attrition rate on the companys financial performance. It contains information about major financial key performance indicators KPIs such as monthly recurring revenue MRR, customer lifetime value CLV, and customer acquisition cost CAC. Make sure to capture your audiences attention in your business displays with our gratis customizable Implementing Strategies To Enhance Impact Of Customer Churn On Organization Performance Infographics PDF These are great for business strategies, office conferences, capital raising or task suggestions. If you desire to acquire more customers for your tech business and ensure they stay satisfied, create your own sales presentation with these plain slides. Mentioned slide outlines the impact of a higher attrition rate on the companys financial performance. It contains information about major financial key performance indicators KPIs such as monthly recurring revenue MRR, customer lifetime value CLV, and customer acquisition cost CAC.
Target Dart On Laptop With Gold Coins Powerpoint Template
This business PowerPoint slide displays target dart on laptop with gold coins. This diagram is suitable for financial planning and target related topics. Download this PPT slide to make impressive presentations.
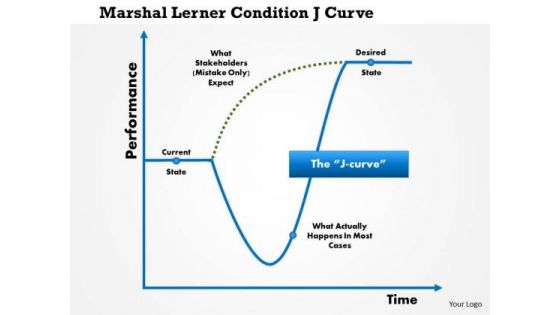
Business Framework Marshall Lerner Condition Ju Curve PowerPoint Presentation
Explain the Marshall Lerner condition and J-curve with suitable graphics. This business framework has been crafted with j-curve graphics. Use this PPT in your financial presentation to explain the depreciation and devaluation of currency for any country.
Business Results Abstract PowerPoint Templates And PowerPoint Backgrounds 0511
Microsoft PowerPoint Template and Background with business abstract design showing market figures and financial results Become popular for your presentation skills with our Business Results Abstract PowerPoint Templates And PowerPoint Backgrounds 0511. You'll always stay ahead of the game.

Stock Quotes Finance PowerPoint Templates And PowerPoint Backgrounds 0711
Microsoft PowerPoint Template and Background with eyeglasses and financial papers Present like a wizard with our Stock Quotes Finance PowerPoint Templates And PowerPoint Backgrounds 0711. You will come out on top.
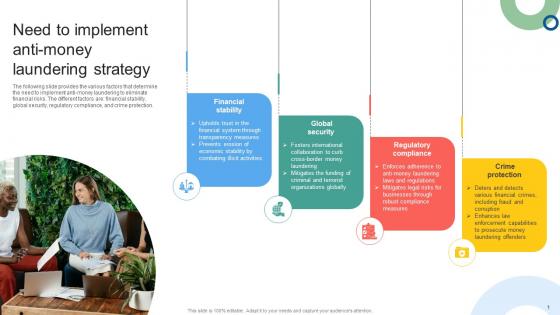
Need To Implement Anti Money Laundering Mapping Out The Anti Money Fin SS V
The following slide provides the various factors that determine the need to implement anti-money laundering to eliminate financial risks. The different factors are financial stability, global security, regulatory compliance, and crime protection. Find a pre-designed and impeccable Need To Implement Anti Money Laundering Mapping Out The Anti Money Fin SS V. The templates can ace your presentation without additional effort. You can download these easy-to-edit presentation templates to make your presentation stand out from others. So, what are you waiting for Download the template from Slidegeeks today and give a unique touch to your presentation. The following slide provides the various factors that determine the need to implement anti-money laundering to eliminate financial risks. The different factors are financial stability, global security, regulatory compliance, and crime protection.


 Continue with Email

 Home
Home


