Goal Chart

Financial Information Systems Chart Example Of Ppt Presentation
This is a financial information systems chart example of ppt presentation. This is a three stage process. The stages in this process are process, people, value, technology.
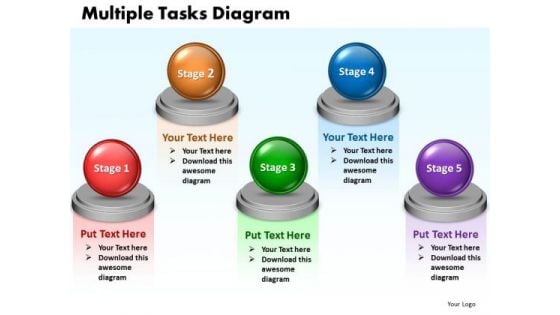
Ppt Multiple Tasks Chart 5 Stages PowerPoint Templates 2003
PPT multiple tasks chart 5 stages powerpoint templates 2003 0812-This diagram will help you to organize information, organize and run effective meetings, and generate useful member contributions.-PPT multiple tasks chart 5 stages powerpoint templates 2003 0812-3d, Abstract, Backgrounds, Ball, Business, Choice, Comparison, Concept, Descriptive, Equilibrium, Grow, Illustrations, Instrument, Measurement, Metallic, Part, Partnership, Pattern, Progress, Reflections, Scales, Several, Sphere, Strategy, Success Start driving productivity gains with our Ppt Multiple Tasks Chart 5 Stages PowerPoint Templates 2003. They will make you look good.
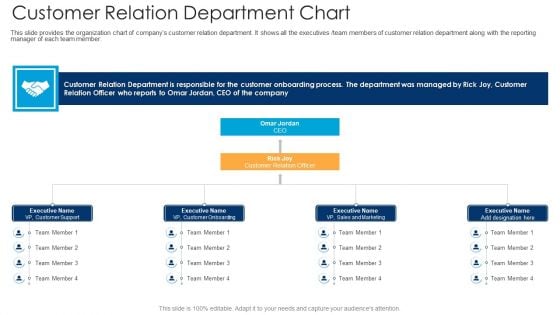
Customer Relation Department Chart Ppt Infographics Influencers PDF
This slide provides the organization chart of companys customer relation department. It shows all the executives or team members of customer relation department along with the reporting manager of each team member. Deliver an awe-inspiring pitch with this creative customer relation department chart ppt infographics influencers pdf. bundle. Topics like customer relation department chart can be discussed with this completely editable template. It is available for immediate download depending on the needs and requirements of the user.
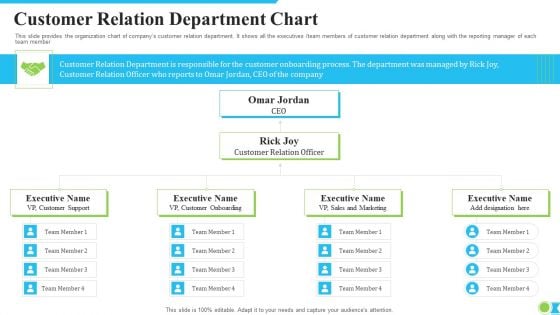
Customer Relation Department Chart Ppt Infographic Template Example File
This slide provides the organization chart of companys customer relation department. It shows all the executives or team members of customer relation department along with the reporting manager of each team member. Deliver an awe-inspiring pitch with this creative customer relation department chart ppt infographic template example file. bundle. Topics like customer relation department chart can be discussed with this completely editable template. It is available for immediate download depending on the needs and requirements of the user.
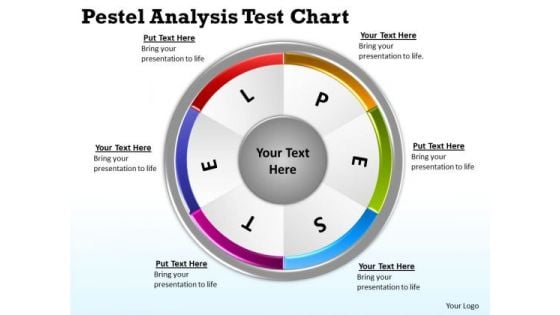
Mba Models And Frameworks Pestel Analysis Test Chart Business Diagram
Double Your Chances With Our Mba Models And Frameworks Pestel Analysis Test Chart Business Diagram Powerpoint Templates. The Value Of Your Thoughts Will Increase Two-Fold.
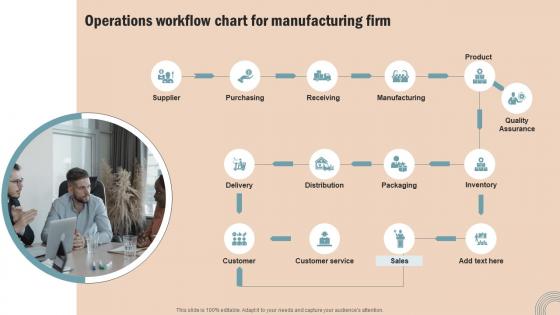
Operations Workflow Chart Operations Strategy Improve Business Productivity Slides Pdf
Presenting this PowerPoint presentation, titled Operations Workflow Chart Operations Strategy Improve Business Productivity Slides Pdf, with topics curated by our researchers after extensive research. This editable presentation is available for immediate download and provides attractive features when used. Download now and captivate your audience. Presenting this Operations Workflow Chart Operations Strategy Improve Business Productivity Slides Pdf. Our researchers have carefully researched and created these slides with all aspects taken into consideration. This is a completely customizable Operations Workflow Chart Operations Strategy Improve Business Productivity Slides Pdf that is available for immediate downloading. Download now and make an impact on your audience. Highlight the attractive features available with our PPTs. Our Operations Workflow Chart Operations Strategy Improve Business Productivity Slides Pdf are topically designed to provide an attractive backdrop to any subject. Use them to look like a presentation pro.
Corporate Over View Three Steps Chart Ppt Icon
This is a corporate over view three steps chart ppt icon. This is a three stage process. The stages in this process are value, vision, mission.
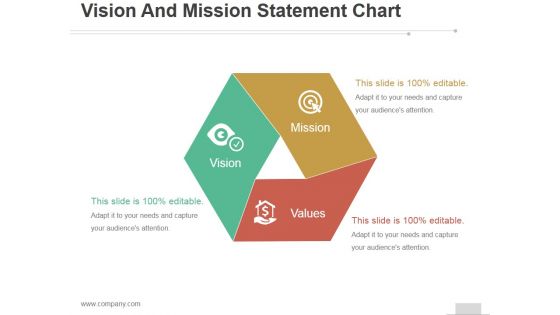
Vision And Mission Statement Chart Ppt PowerPoint Presentation Background Images
This is a vision and mission statement chart ppt powerpoint presentation background images. This is a three stage process. The stages in this process are mission, vision, values.
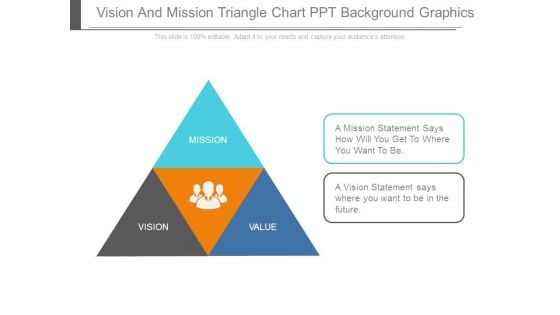
Vision And Mission Triangle Chart Ppt Background Graphics
This is a vision and mission triangle chart ppt background graphics. This is a three stage process. The stages in this process are mission, value, vision.
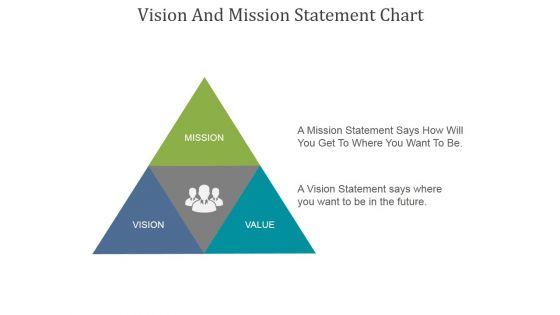
Vision And Mission Statement Chart Ppt PowerPoint Presentation Deck
This is a vision and mission statement chart ppt powerpoint presentation deck. This is a three stage process. The stages in this process are mission, vision, value.
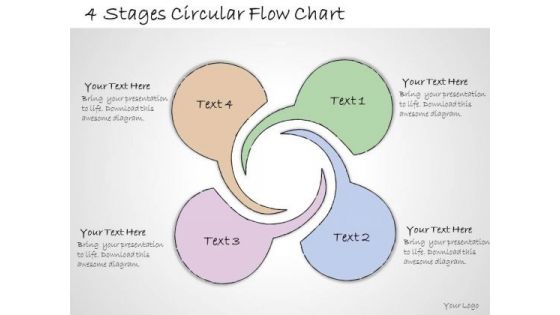
Ppt Slide 4 Stages Circular Flow Chart Marketing Plan
Deliver The Right Dose With Our PPT Slide 4 stages circular flow chart marketing plan Powerpoint Templates. Your Ideas Will Get The Correct Illumination.
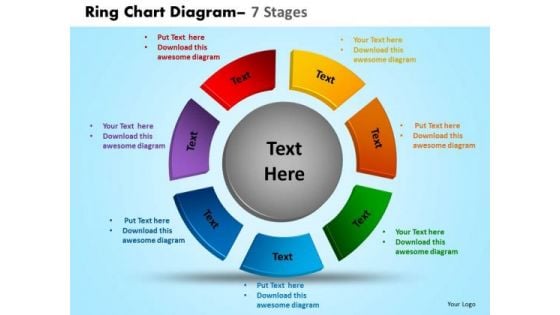
Sales Diagram Ring Chart Diagram 7 Stages Marketing Diagram
Deliver The Right Dose With Our Sales Diagram Ring Chart Diagram 7 Stages Marketing Diagram Powerpoint Templates. Your Ideas Will Get The Correct Illumination.
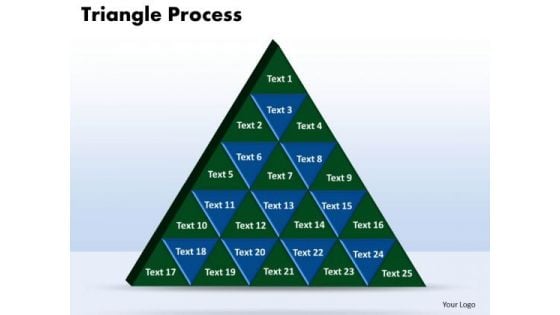
PowerPoint Slide Designs Triangle Process Chart Ppt Template
PowerPoint Slide Designs triangle process Chart PPT Template-Use this diagram to show containment, proportional, or interconnected relationships. You can add text in the triangular shapes-Business, chart, color, concept, conceptual, construction, corporate, creating, data, design, diagram, direction, focus, graph, group, growth, hierarchy, illustration, information, isolated, layer, layered, level, manage, management, model, object, organization, performance, population, presentation, principal, process, progress, pyramid, rank, resource, shape, stage, structure, support, symbol, top, triangle, vector-PowerPoint Slide Designs triangle process Chart PPT Template Experience the striking graphics of our PowerPoint Slide Designs Triangle Process Chart Ppt Template. They bring good quality to the table.
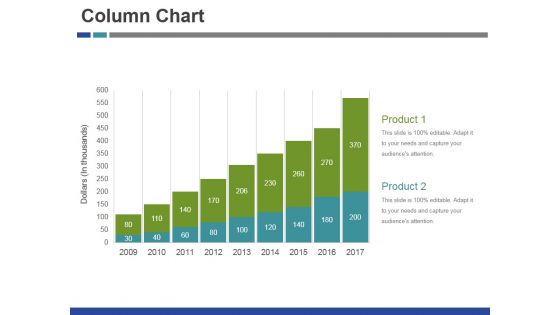
Column Chart Ppt PowerPoint Presentation Infographic Template Layouts
This is a column chart ppt powerpoint presentation infographic template layouts. This is a nine stage process. The stages in this process are product, growth, success, business, graph.
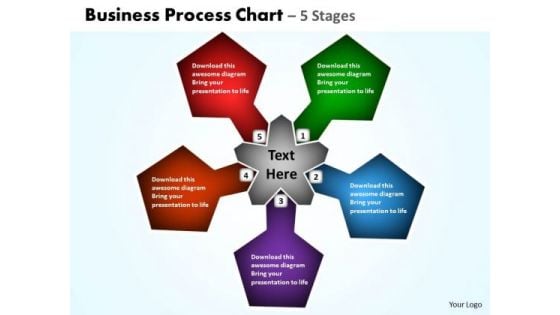
Strategy Diagram Business Process Chart 5 Stages 8 Sales Diagram
Our Strategy Diagram Business Process Chart 5 Stages 8 Sales Diagram Powerpoint Templates Deliver At Your Doorstep. Let Them In For A Wonderful Experience.
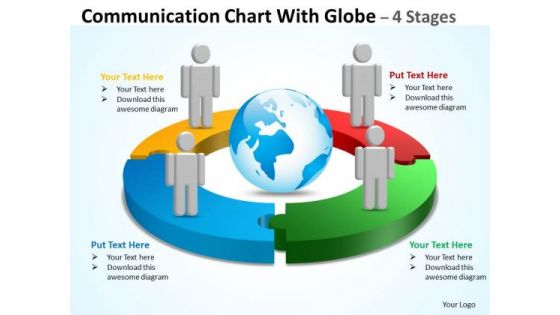
Strategic Management Communication Diagram Chart With Globe Stages Consulting Diagram
Our Strategic Management Communication diagram Chart With Globe Stages Consulting Diagram Powerpoint Templates Deliver At Your Doorstep. Let Them In For A Wonderful Experience.
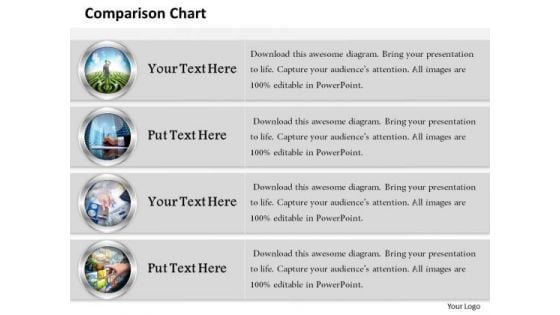
Strategic Management Comparison Chart With Pictures Business Diagram
Deliver The Right Dose With Our Strategic Management Comparison Chart With Pictures Business Diagram Powerpoint Templates. Your Ideas Will Get The Correct Illumination.
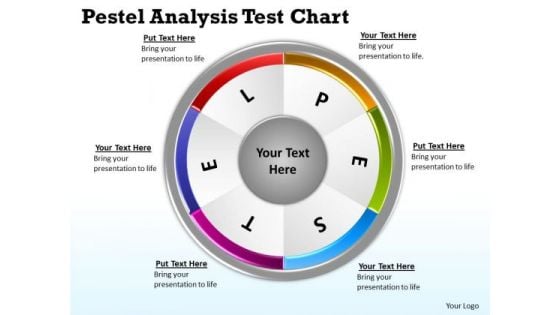
Marketing Diagram Pestel Analysis Test Chart Strategic Management
Deliver The Right Dose With Our Marketing Diagram Pestel Analysis Test Chart Strategic Management Powerpoint Templates. Your Ideas Will Get The Correct Illumination.
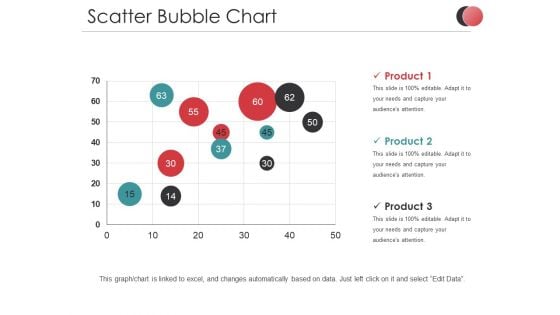
Scatter Bubble Chart Ppt PowerPoint Presentation Infographic Template Diagrams
This is a scatter bubble chart ppt powerpoint presentation infographic template diagrams. This is a three stage process. The stages in this process are product, business, marketing, finance.
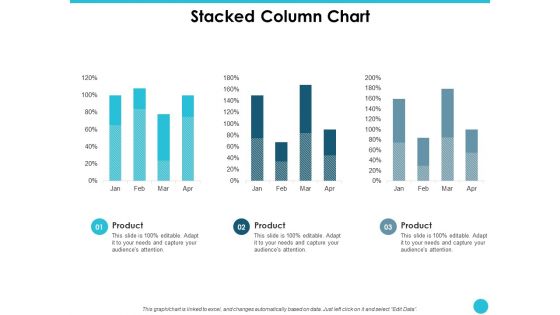
Stacked Column Chart Ppt PowerPoint Presentation Professional Diagrams
This is a stacked column chart ppt powerpoint presentation professional diagrams. This is a three stage process. The stages in this process are percentage, product, management, marketing.
Bar Chart Ppt PowerPoint Presentation Icon Infographic Template
This is a bar chart ppt powerpoint presentation icon infographic template. This is a nine stage process. The stages in this process are product, marketing, management, business, success.
Scatter Chart Ppt PowerPoint Presentation Icon Background Images
This is a scatter chart ppt powerpoint presentation icon background images. This is a one stage process. The stages in this process are percentage, product, business, marketing, management.
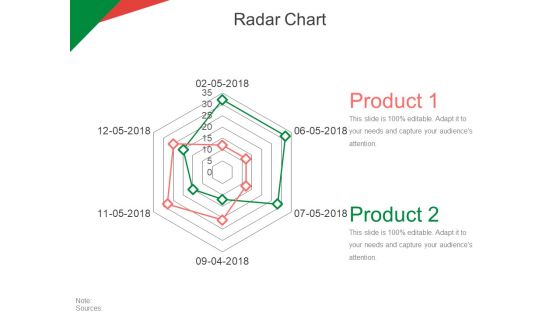
Radar Chart Ppt PowerPoint Presentation Infographic Template Slides
This is a radar chart ppt powerpoint presentation infographic template slides. This is a two stage process. The stages in this process are product, business, marketing, management, planning.
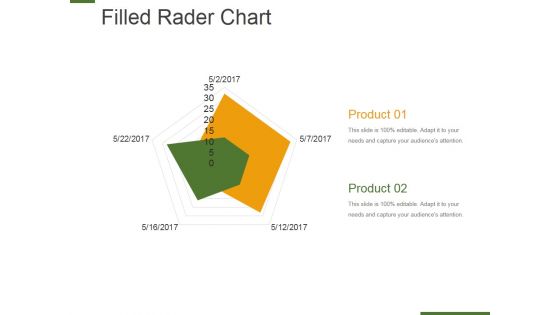
Filled Rader Chart Ppt PowerPoint Presentation Outline Inspiration
This is a filled rader chart ppt powerpoint presentation outline inspiration. This is a two stage process. The stages in this process are product, business, marketing, process, success.
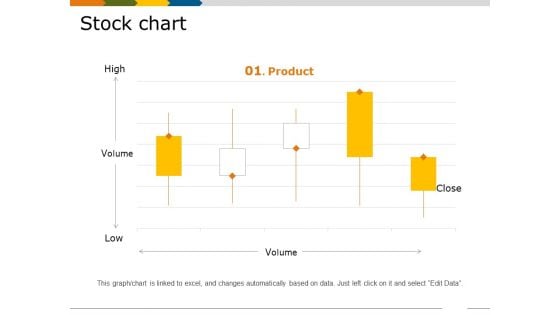
Stock Chart Ppt PowerPoint Presentation Pictures Graphics Tutorials
This is a stock chart ppt powerpoint presentation pictures graphics tutorials. This is a five stage process. The stages in this process are high, volume, low, product, business.
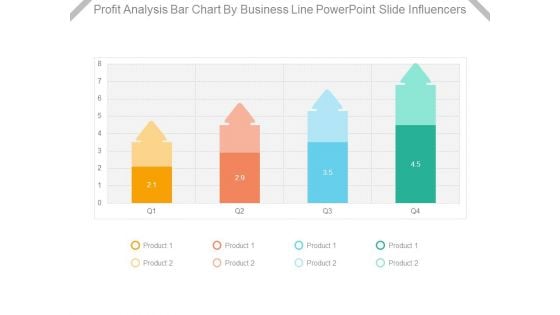
Profit Analysis Bar Chart By Business Line Powerpoint Slide Influencers
This is a profit analysis bar chart by business line powerpoint slide influencers. This is a four stage process. The stages in this process are product.
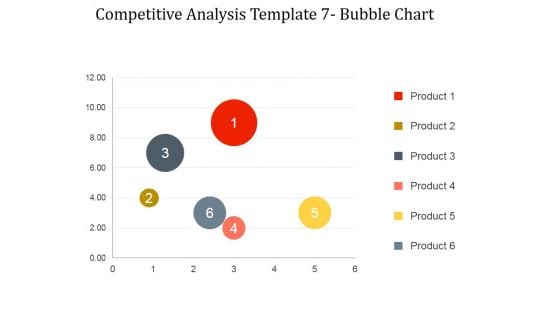
Competitive Analysis Bubble Chart Ppt PowerPoint Presentation Templates
This is a competitive analysis bubble chart ppt powerpoint presentation templates. This is a six stage process. The stages in this process are product, business, management, marketing, strategy.
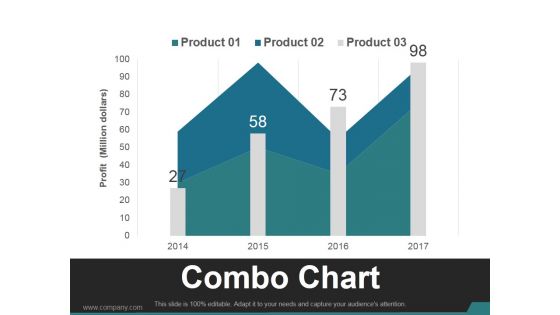
Combo Chart Template 2 Ppt PowerPoint Presentation Guidelines
This is a combo chart template 2 ppt powerpoint presentation guidelines. This is a four stage process. The stages in this process are business, marketing, growth, product, timeline.
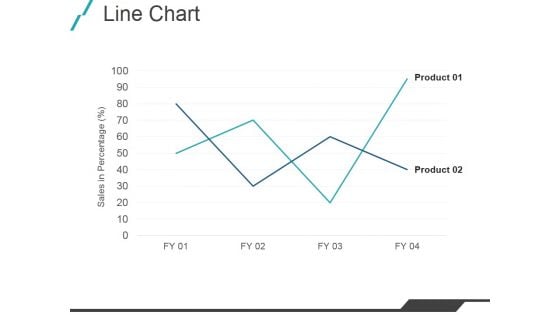
Line Chart Ppt PowerPoint Presentation Model Example File
This is a line chart ppt powerpoint presentation model example file. This is a two stage process. The stages in this process are product, graph, growth, management.
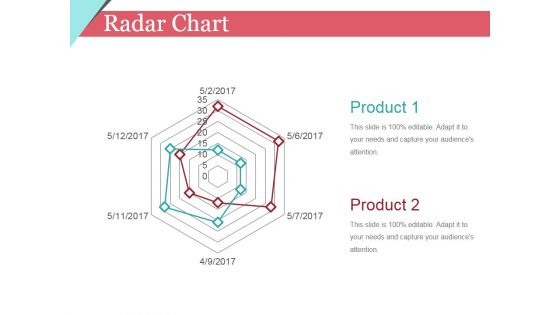
Radar Chart Ppt PowerPoint Presentation Infographic Template Design Templates
This is a radar chart ppt powerpoint presentation infographic template design templates. This is a seven stage process. The stages in this process are business, shapes, product, marketing.
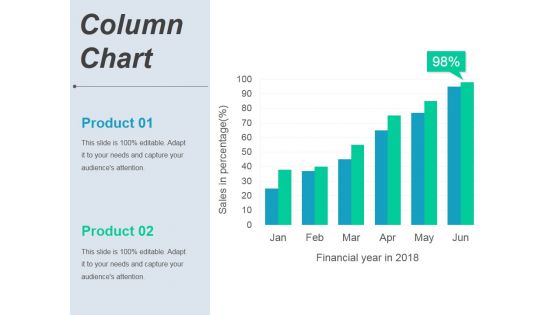
Column Chart Ppt PowerPoint Presentation Portfolio Graphics Template
This is a column chart ppt powerpoint presentation portfolio graphics template. This is a six stage process. The stages in this process are product, finance, growth, success, business.

Combo Chart Ppt PowerPoint Presentation Professional Graphics Example
This is a combo chart ppt powerpoint presentation professional graphics example. This is a eight stage process. The stages in this process are product, finance, growth, success, business.
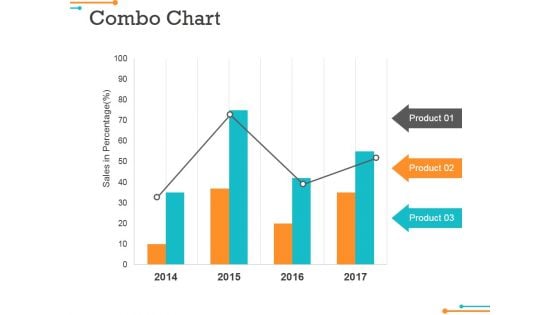
Combo Chart Ppt Powerpoint Presentation Infographic Template File Formats
This is a combo chart ppt powerpoint presentation infographic template file formats. This is a four stage process. The stages in this process are product, growth, management, business.
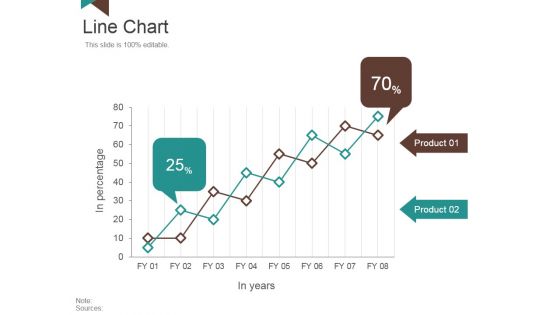
Line Chart Ppt PowerPoint Presentation Layouts Background Image
This is a line chart ppt powerpoint presentation layouts background image. This is a two stage process. The stages in this process are in percentage, in years, product.
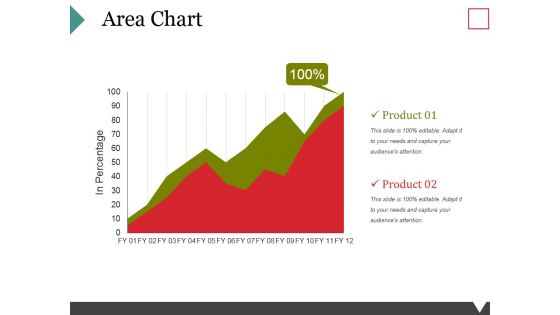
Area Chart Ppt PowerPoint Presentation Gallery Example Topics
This is a area chart ppt powerpoint presentation gallery example topics. This is a two stage process. The stages in this process are product, growth, finance, management, business.
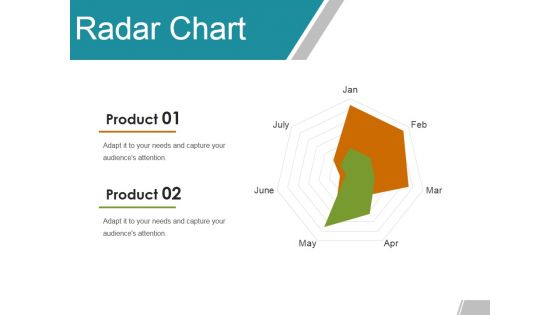
Radar Chart Ppt PowerPoint Presentation Gallery Example Topics
This is a radar chart ppt powerpoint presentation gallery example topics. This is a seven stage process. The stages in this process are product, business, marketing, shapes.
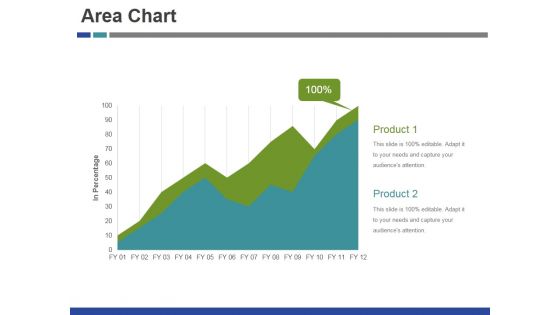
Area Chart Ppt PowerPoint Presentation Infographic Template Show
This is a area chart ppt powerpoint presentation infographic template show. This is a two stage process. The stages in this process are product, marketing, management, business, success.

Donut Pie Chart Ppt PowerPoint Presentation Infographics Images
This is a donut pie chart ppt powerpoint presentation infographics images. This is a seven stage process. The stages in this process are product, year, pie, process, business.
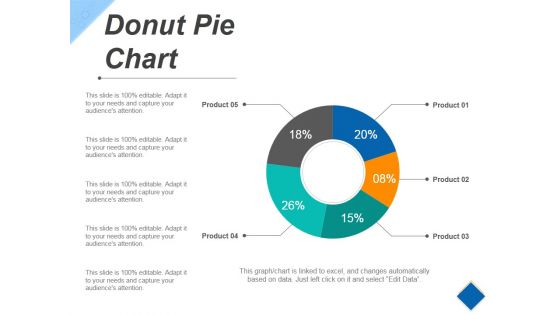
Donut Pie Chart Ppt PowerPoint Presentation Slides Example
This is a donut pie chart ppt powerpoint presentation slides example. This is a five stage process. The stages in this process are product, finance, business, process.
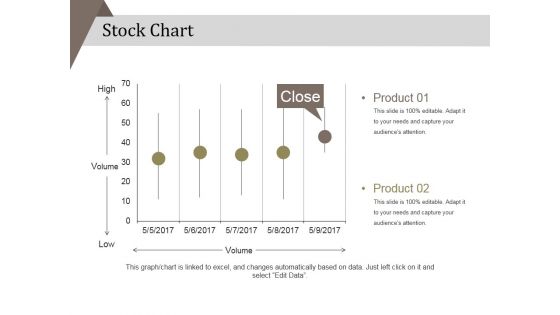
Stock Chart Ppt PowerPoint Presentation Portfolio Background Designs
This is a stock chart ppt powerpoint presentation portfolio background designs. This is a five stage process. The stages in this process are product, high, low .

Radar Chart Ppt PowerPoint Presentation Infographic Template Graphics Template
This is a radar chart ppt powerpoint presentation infographic template graphics template. This is a six stage process. The stages in this process are product, business, marketing, shapes.
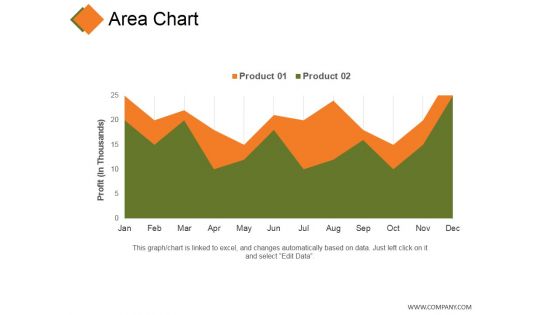
Area Chart Ppt PowerPoint Presentation Gallery Clipart Images
This is a area chart ppt powerpoint presentation gallery clipart images. This is a two stage process. The stages in this process are product, profit, business, finance, marketing.
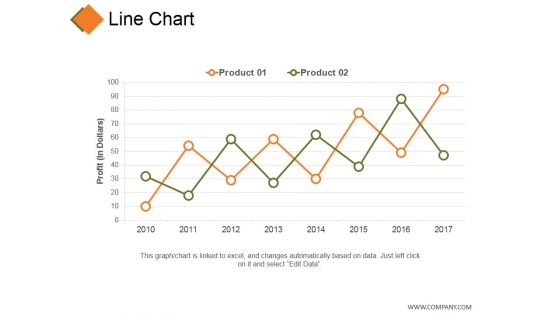
Line Chart Ppt PowerPoint Presentation Visual Aids Inspiration
This is a line chart ppt powerpoint presentation visual aids inspiration. This is a two stage process. The stages in this process are product, profit, growth, decline, success.

Column Chart Ppt PowerPoint Presentation Inspiration Design Ideas
This is a column chart ppt powerpoint presentation inspiration design ideas. This is a nine stage process. The stages in this process are product, growth, success, graph, business.
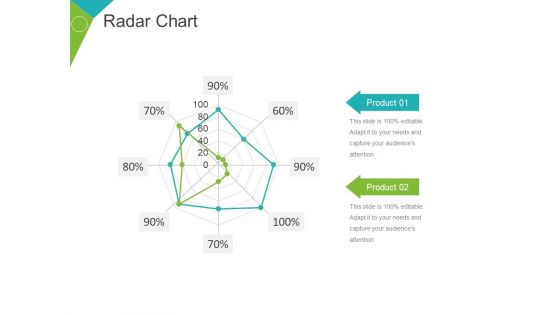
Radar Chart Ppt PowerPoint Presentation Portfolio Design Inspiration
This is a radar chart ppt powerpoint presentation portfolio design inspiration. This is a two stage process. The stages in this process are product, percentage, business, marketing, finance.
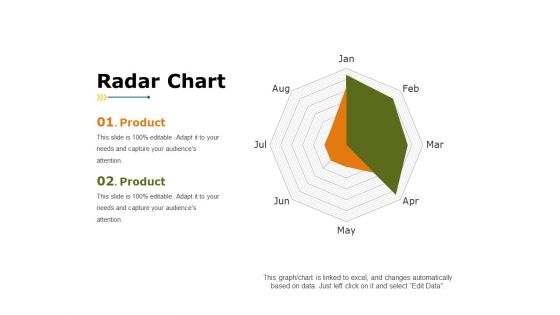
Radar Chart Ppt PowerPoint Presentation Summary Background Designs
This is a radar chart ppt powerpoint presentation summary background designs. This is a two stage process. The stages in this process are product, finance, business, marketing.
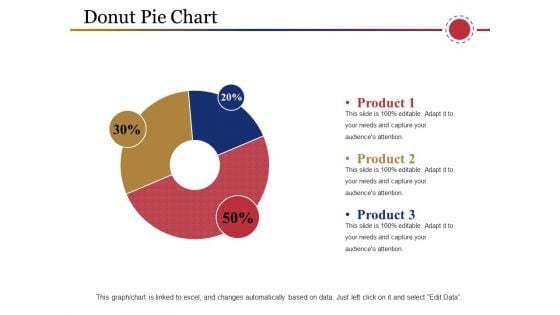
Donut Pie Chart Ppt PowerPoint Presentation Show Ideas
This is a donut pie chart ppt powerpoint presentation show ideas. This is a three stage process. The stages in this process are product, business, process, percentage, management.
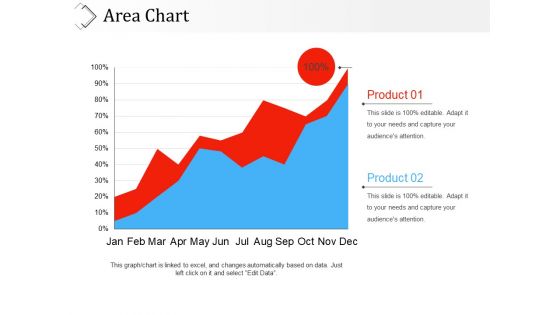
Area Chart Ppt PowerPoint Presentation Model Example Topics
This is a area chart ppt powerpoint presentation model example topics. This is a two stage process. The stages in this process are product, percentage, business, marketing, finance.
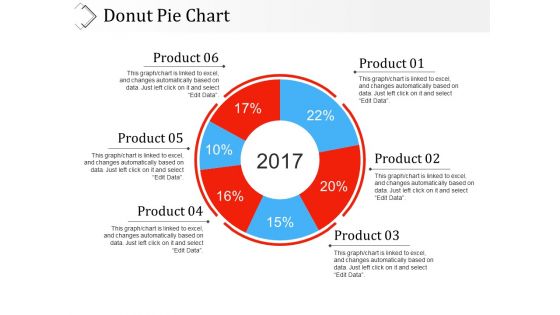
Donut Pie Chart Ppt PowerPoint Presentation Professional Slideshow
This is a donut pie chart ppt powerpoint presentation professional slideshow. This is a six stage process. The stages in this process are product, percentage, years, business, process.
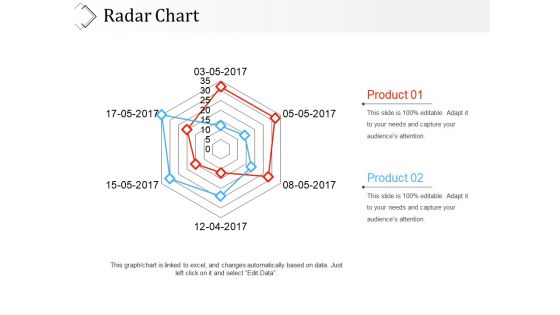
Radar Chart Ppt PowerPoint Presentation File Graphic Tips
This is a radar chart ppt powerpoint presentation file graphic tips. This is a two stage process. The stages in this process are product, finance, marketing, business.

Radar Chart Ppt PowerPoint Presentation Summary Slide Portrait
This is a radar chart ppt powerpoint presentation summary slide portrait. This is a two stage process. The stages in this process are product, business, marketing, finance.
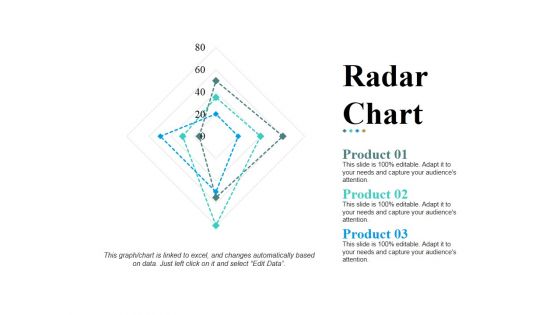
Radar Chart Ppt PowerPoint Presentation Pictures Design Templates
This is a radar chart ppt powerpoint presentation pictures design templates. This is a three stage process. The stages in this process are product, shapes, business, marketing, management.
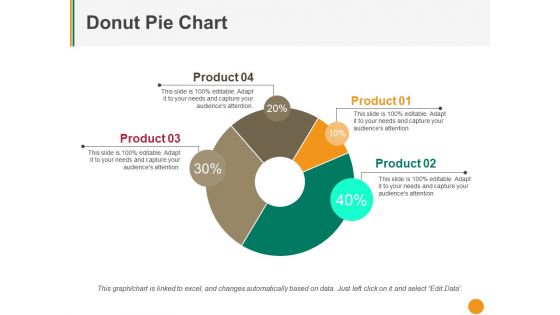
Donut Pie Chart Ppt PowerPoint Presentation Pictures Background
This is a donut pie chart ppt powerpoint presentation pictures background. This is a four stage process. The stages in this process are product, percentage, business, management, process.
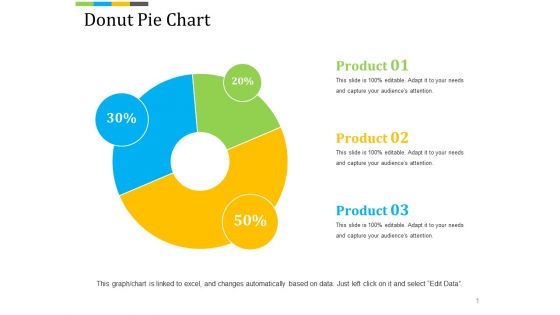
Donut Pie Chart Ppt PowerPoint Presentation Slides Outfit
This is a donut pie chart ppt powerpoint presentation slides outfit. This is a three stage process. The stages in this process are product, percentage, business, process, management.
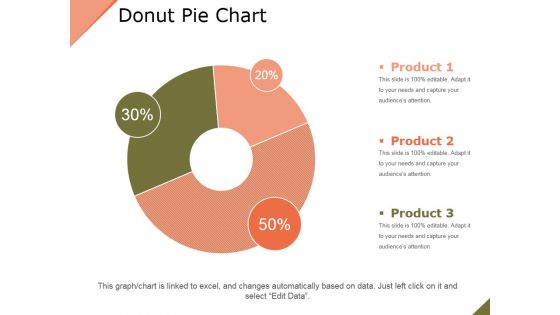
Donut Pie Chart Ppt PowerPoint Presentation Layouts Outfit
This is a donut pie chart ppt powerpoint presentation layouts outfit. This is a three stage process. The stages in this process are product, business, percentage, finance, marketing.
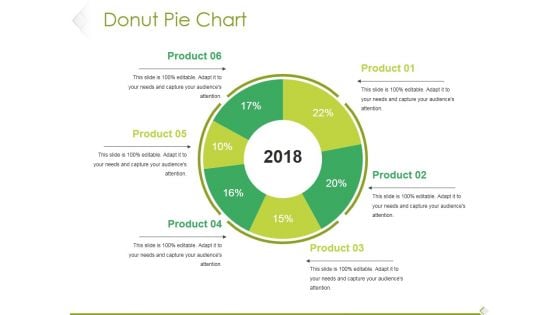
Donut Pie Chart Ppt PowerPoint Presentation Model Pictures
This is a donut pie chart ppt powerpoint presentation model pictures. This is a six stage process. The stages in this process are product, percentage, finance, year, business.
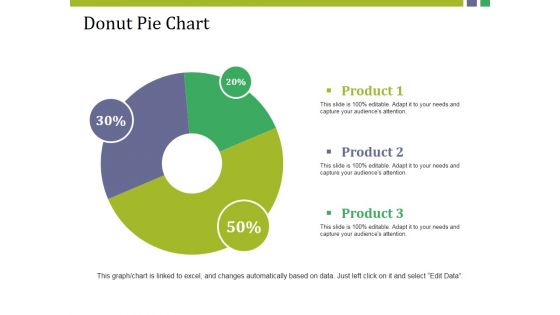
Donut Pie Chart Ppt PowerPoint Presentation Model Show
This is a donut pie chart ppt powerpoint presentation model show. This is a three stage process. The stages in this process are product, donut, percentage, finance, business.
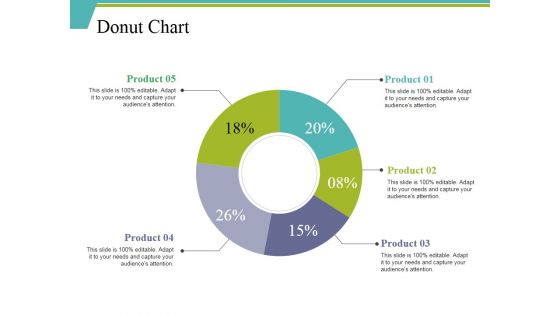
Donut Chart Ppt PowerPoint Presentation Ideas Background Designs
This is a donut chart ppt powerpoint presentation ideas background designs. This is a five stage process. The stages in this process are percentage, finance, donut, business, product.
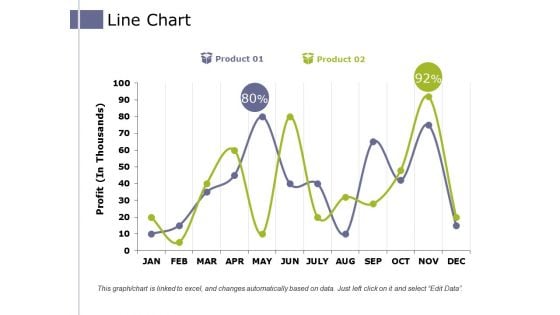
Line Chart Ppt PowerPoint Presentation Pictures Example Introduction
This is a line chart ppt powerpoint presentation pictures example introduction. This is a two stage process. The stages in this process are product, profit, business, growth, success.
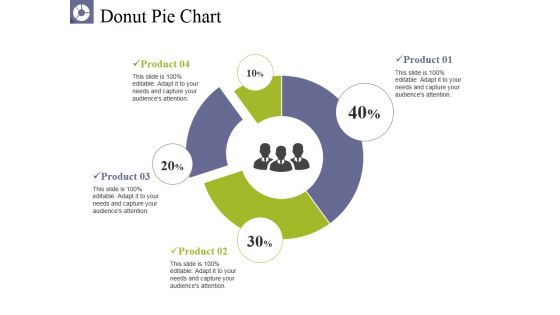
Donut Pie Chart Ppt PowerPoint Presentation Pictures Graphics
This is a donut pie chart ppt powerpoint presentation pictures graphics. This is a four stage process. The stages in this process are product, business, percentage, donut, finance.


 Continue with Email

 Home
Home


