Goal Chart
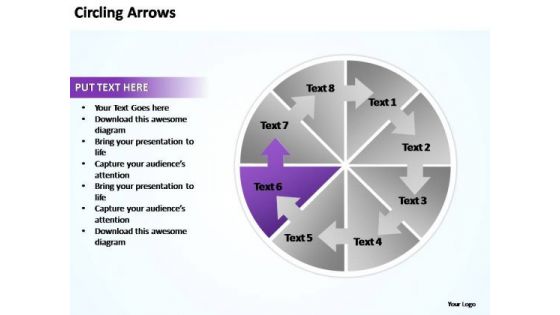
PowerPoint Templates Circling Arrows Flow Chart Ppt Design Slides
PowerPoint Templates Circling Arrows Flow Chart PPT Design Slides-Explore the various directions and layers existing in your in your plans and processes. Unravel the desired and essential elements of your overall strategy. Explain the relevance of the different layers and stages and directions in getting down to your core competence, ability and desired result. Our PowerPoint Templates Circling Arrows Flow Chart Ppt Design Slides give expression to your drive. They emit the essence of your determination.
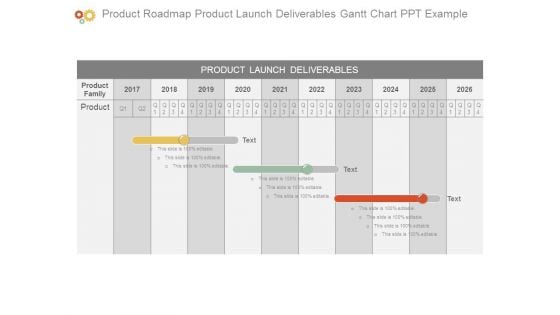
Product Roadmap Product Launch Deliverables Gantt Chart Ppt Example
This is a product roadmap product launch deliverables gantt chart ppt example. This is a three stage process. The stages in this process are product launch deliverables, product family, product.
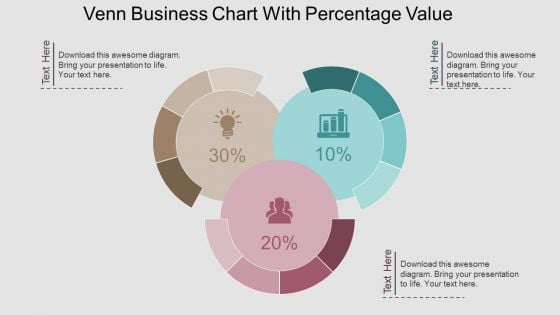
Venn Business Chart With Percentage Value Powerpoint Template
This PPT slide contains Venn business chart with percentage values. This PPT diagram is suitable to present data comparison and analysis. Enlighten others on the process with this innovative PowerPoint template.
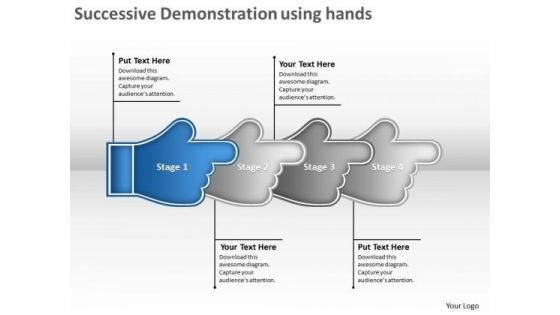
Successive Demonstration Using Hands Production Planning Flow Chart PowerPoint Templates
We present our successive demonstration using hands production planning flow chart PowerPoint templates. Use our Symbol PowerPoint Templates because; In any endeavor people matter most. Use our Business PowerPoint Templates because, Marketing Strategy Business Template:- Maximizing sales of your product is the intended destination. Use our Metaphor PowerPoint Templates because; educate your staff on the means to provide the required support for speedy recovery. Use our Abstract PowerPoint Templates because; Use our creative template to lay down your views. Use our Process and Flows PowerPoint Templates because, Our PowerPoint templates designed for your ideas to sell. Use these PowerPoint slides for presentations relating to Description using hands steps, Business, Collection, Connection, Cursor, Decoration, Design, Dimensional, Direction, Element, Icon, Illustration, Information, Modern, Motion, Paper, Perspective, Plastic, Pointer, Pointing, Process, Recycle, Recycling, Reflective, Set, Shape, Shiny, Sign, Symbol, Technology. The prominent colors used in the PowerPoint template are Blue, Gray, and Black Dwell on your exploits with our Successive Demonstration Using Hands Production Planning Flow Chart PowerPoint Templates. Bring out the courage of your actions.
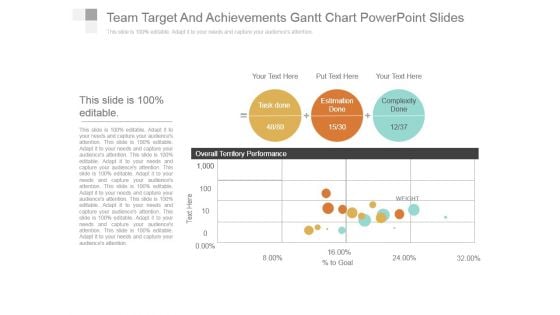
Team Target And Achievements Gantt Chart Powerpoint Slides
This is a team target and achievements gantt chart powerpoint slides. This is a three stage process. The stages in this process are task done, estimation done, complexity done, overall territory performance.
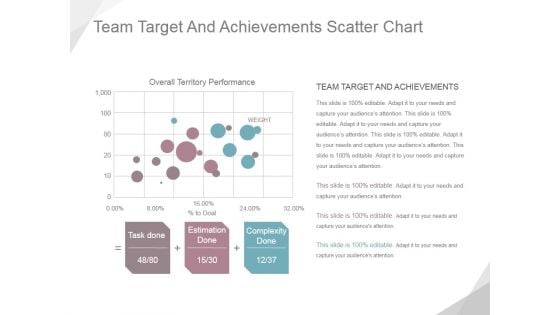
Team Target And Achievements Scatter Chart Ppt PowerPoint Presentation Example
This is a team target and achievements scatter chart ppt powerpoint presentation example. This is a three stage process. The stages in this process are overall territory performance, task done, estimation done, complexity done.
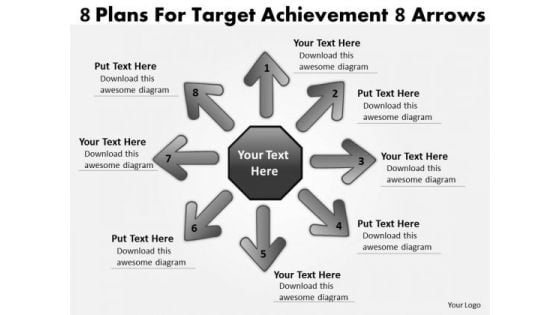
8 Plans For Target Achievement Arrows Venn Chart PowerPoint Slides
We present our 8 plans for target achievement arrows Venn Chart PowerPoint Slides.Present our Symbol PowerPoint Templates because there is a crucial aspect that requires extra attention. Present our Process and Flows PowerPoint Templates because it helps you to enlighten those around you with the value of your insight. Download and present our Arrows PowerPoint Templates because the concept and strategy is your strength. Present our Communication PowerPoint Templates because it helps you to get your team in the desired sequence into the bracket. Download our Business PowerPoint Templates because you can see clearly through to the bigger bowl ahead. Time your jump to perfection and hit the nail on the head.Use these PowerPoint slides for presentations relating to Abstract, Arrow, Background, Buttons, Circle, Clean, Communication, Concept, Conceptual, Design, Diagram, Direction, Elements, Exchange, Flow, Flowchart, Graph, Graphic, Icon, Illustration, Internet, Precise, Process, Red, Sign, Symbol, Template, Ultimate Simple, Web Graphics, Web Icons. The prominent colors used in the PowerPoint template are White, Gray, Black. PowerPoint presentation experts tell us our 8 plans for target achievement arrows Venn Chart PowerPoint Slides have awesome images to get your point across. People tell us our Concept PowerPoint templates and PPT Slides will save the presenter time. People tell us our 8 plans for target achievement arrows Venn Chart PowerPoint Slides are Reminiscent. Presenters tell us our Buttons PowerPoint templates and PPT Slides are effectively colour coded to prioritise your plans They automatically highlight the sequence of events you desire. Customers tell us our 8 plans for target achievement arrows Venn Chart PowerPoint Slides are designed by a team of presentation professionals. The feedback we get is that our Conceptual PowerPoint templates and PPT Slides are Radiant. Our 8 Plans For Target Achievement Arrows Venn Chart PowerPoint Slides are geared towards excellence. They find the average a bit banal.
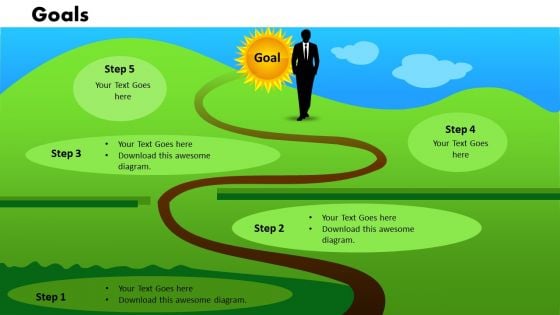
Road Map Timeline Chart PowerPoint Templates Editable Ppt Slides
Road_Map_timeline_Chart_PowerPoint_templates_Editable_PPT_Slides-These high quality powerpoint pre-designed slides and powerpoint templates have been carefully created by our professional team to help you impress your audience. All slides have been created and are 100% editable in powerpoint. Each and every property of any graphic - color, size, orientation, shading, outline etc. can be modified to help you build an effective powerpoint presentation. Any text can be entered at any point in the powerpoint template or slide. Simply DOWNLOAD, TYPE and PRESENT! These PowerPoint presentation slides can be used to represent themes relating to --Accuracy, accurate, achievement, aim, aiming, arrow, aspirations, background, best, business, center, challenge, chance, circle, competition, competitive, concept, conceptual, dart, decision, efficiency, game, goal, leisure, luck, marketing, objective, perfect, perfection, performance, red, shape, shot, solution, sport, strategy, success, successful, symbol, target, win, winner-Road_Map_timeline_Chart_PowerPoint_templates_Editable_PPT_Slides Hunt down problems with our Road Map Timeline Chart PowerPoint Templates Editable Ppt Slides. Make sure your presentation gets the attention it deserves.
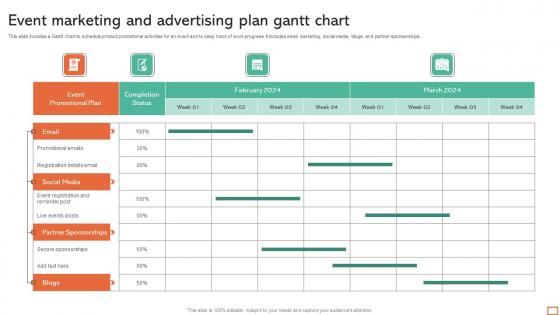
Event Marketing And Advertising Plan Gantt Chart Professional Pdf
This slide includes a Gantt chart to schedule product promotional activities for an event and to keep track of work progress. It includes email marketing, social media, blogs, and partner sponsorships. Pitch your topic with ease and precision using this Event Marketing And Advertising Plan Gantt Chart Professional Pdf. This layout presents information on Social Media, Partner Sponsorships. It is also available for immediate download and adjustment. So, changes can be made in the color, design, graphics or any other component to create a unique layout. This slide includes a Gantt chart to schedule product promotional activities for an event and to keep track of work progress. It includes email marketing, social media, blogs, and partner sponsorships.
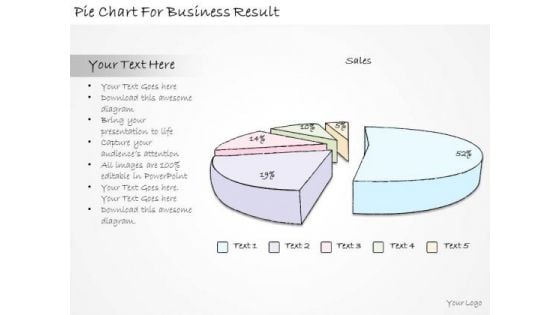
Ppt Slide Pie Chart For Business Result Sales Plan
Drive Your Team Along The Road To Success. Take The Wheel With Our PPT Slide pie chart for business result sales plan Powerpoint Templates. Drive Confidently Over All The Bumps. Our Business Plan Powerpoint Templates Will Absorb The Shocks.
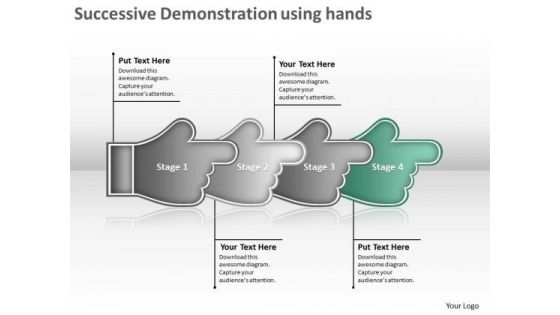
Successive Demonstration Using Hands Flow Chart Creator PowerPoint Templates
We present our successive demonstration using hands flow chart creator PowerPoint templates. Use our Symbol PowerPoint Templates because, are the tools that helped most of us evolve. Use our Business PowerPoint Templates because, Marketing Strategy Business Template:- Maximizing sales of your product is the intended destination. Use our Metaphor PowerPoint Templates because, Profit fairly earned is what you believe in. Use our Abstract PowerPoint Templates because, Forward thinking is the way to go. Use our Process and Flows PowerPoint Templates because, Original thinking is the need of the hour. Use these PowerPoint slides for presentations relating to Description using hands steps, Business, Collection, Connection, Cursor, Decoration, Design, Dimensional, Direction, Element, Icon, Illustration, Information, Modern, Motion, Paper, Perspective, Plastic, Pointer, Pointing, Process, Recycle, Recycling, Reflective, Set, Shape, Shiny, Sign, Symbol, Technology. The prominent colors used in the PowerPoint template are Green, Gray, and Black Drive your organization with our Successive Demonstration Using Hands Flow Chart Creator PowerPoint Templates. Download without worries with our money back guaranteee.
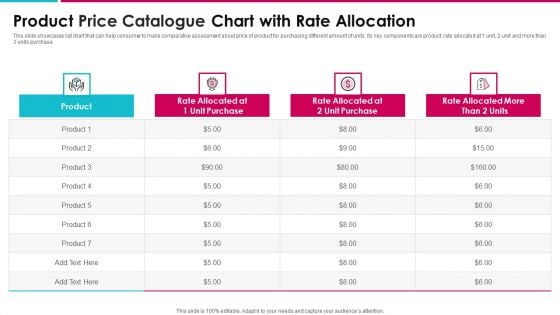
Product Price Catalogue Chart With Rate Allocation Infographics PDF
This slide showcases list chart that can help consumer to make comparative assessment about price of product for purchasing different amount of units. Its key components are product, rate allocated at 1 unit, 2 unit and more than 3 units purchase Pitch your topic with ease and precision using this product price catalogue chart with rate allocation infographics pdf. This layout presents information on product price catalogue chart with rate allocation. It is also available for immediate download and adjustment. So, changes can be made in the color, design, graphics or any other component to create a unique layout.
Risk Tracker Chart Of The Production One Pager Documents
This one pager covers the risk tracker chart of the company that can be used to track the risk factors and how the company is planning to overcome the same. Presenting you an exemplary Risk Tracker Chart Of The Production One Pager Documents. Our one-pager comprises all the must-have essentials of an inclusive document. You can edit it with ease, as its layout is completely editable. With such freedom, you can tweak its design and other elements to your requirements. Download this Risk Tracker Chart Of The Production One Pager Documents brilliant piece now.
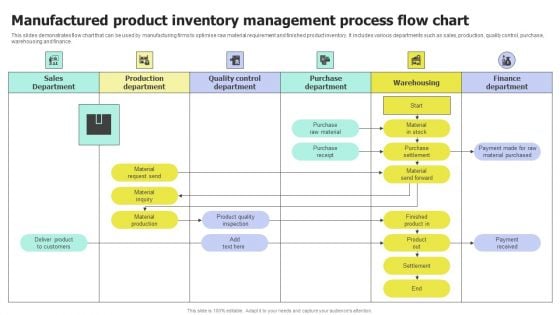
Manufactured Product Inventory Management Process Flow Chart Microsoft PDF
This slide demonstrates flow chart that can be used by manufacturing firms to optimise raw material requirement and finished product inventory. It includes various departments such as sales, production, quality control, purchase, warehousing and finance. Pitch your topic with ease and precision using this Manufactured Product Inventory Management Process Flow Chart Microsoft PDF. This layout presents information on Manufactured Product, Inventory Management, Process Flow Chart. It is also available for immediate download and adjustment. So, changes can be made in the color, design, graphics or any other component to create a unique layout.
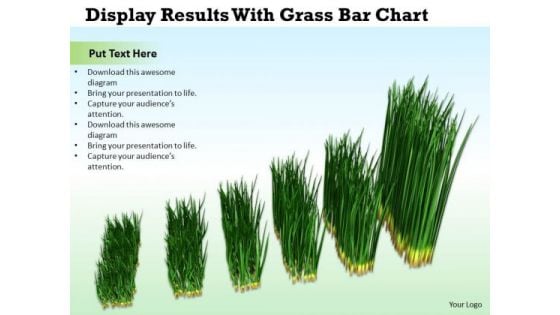
Business And Strategy Display Results With Grass Bar Chart Images
Analyze Ailments On Our business and strategy display results with grass bar chart images Powerpoint Templates. Bring Out The Thinking Doctor In You. Dock Your Thoughts With Our Agriculture Powerpoint Templates. They Will Launch Them Into Orbit.
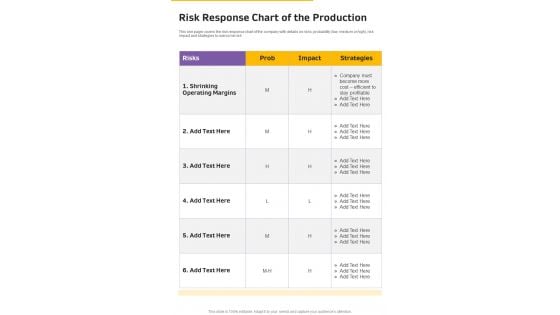
Risk Response Chart Of The Production One Pager Documents
This one pager covers the risk response chart of the company with details on risks, probability low, medium or high, risk impact and strategies to overcome risk. Presenting you a fantastic Risk Response Chart Of The Production One Pager Documents. This piece is crafted on hours of research and professional design efforts to ensure you have the best resource. It is completely editable and its design allow you to rehash its elements to suit your needs. Get this Risk Response Chart Of The Production One Pager Documents A4 One-pager now.
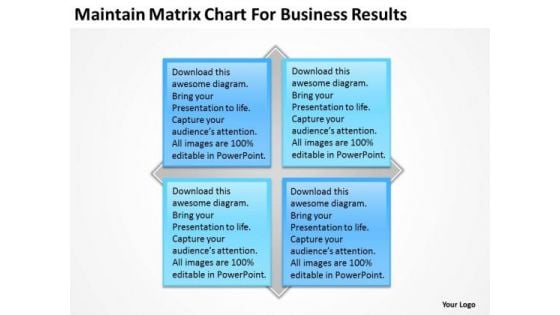
Maintain Matrix Chart For Business Results Plan Sample PowerPoint Slides
Blend your views with our maintain matrix chart for business results plan sample PowerPoint Slides. They are made for each other. Our Boxes Powerpoint templates are duly appointed. They have all the facets you require. There is no subject too dull for our Process and Flows Powerpoint templates. They will always generate keenness. Create failsafe designs with our Maintain Matrix Chart For Business Results Plan Sample PowerPoint Slides. Examine likely defects in detail.
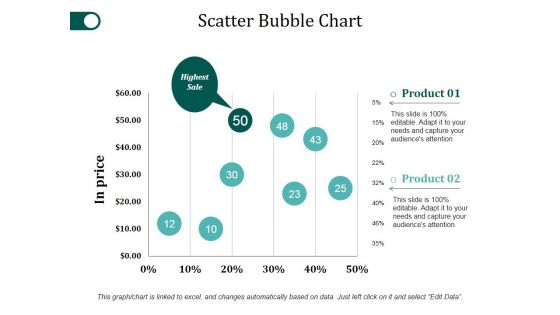
Scatter Bubble Chart Ppt PowerPoint Presentation Styles Objects
This is a scatter bubble chart ppt powerpoint presentation styles objects. This is a two stage process. The stages in this process are product, in price, highest sale, percentage, finance.
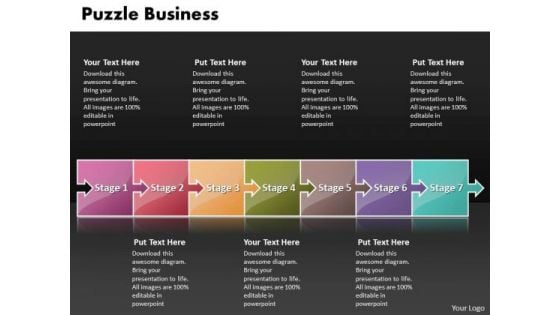
Ppt Puzzle New Business PowerPoint Presentation Process Flow Chart Templates
PPT puzzle new business powerpoint presentation process flow chart Templates-This Diagram shows how items are related to one another. Present your views using our innovative slide and be assured of leaving a lasting impression.-PPT puzzle new business powerpoint presentation process flow chart Templates-Abstract, Arrow, Backgrounds, Business, Computer, Concepts, Connection, Cooperation, Creativity, Crowd, Design, Digital, Digitally, Electric, Equalizer, Generated, Graph, Graphic, Group, Icon, Ideas, Illustration, Image, Individuality, Isolated, Leader, Leadership, Link, Motivation, Music, Objects, Order, Part, Pattern, Piece, Playing, Puzzle Dazzle the audience with your thoughts. Our Ppt Puzzle New Business PowerPoint Presentation Process Flow Chart Templates will leave them wide-eyed.
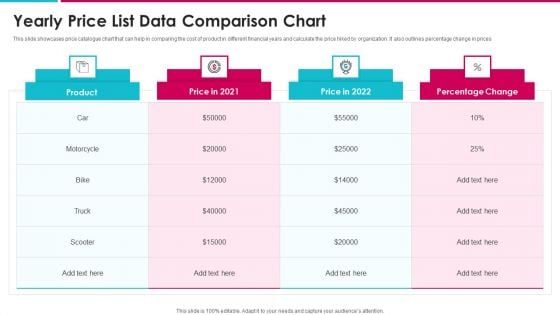
Yearly Price List Data Comparison Chart Structure PDF
This slide showcases price catalogue chart that can help in comparing the cost of product in different financial years and calculate the price hiked by organization. It also outlines percentage change in prices Showcasing this set of slides titled yearly price list data comparison chart structure pdf. The topics addressed in these templates are yearly price list data comparison chart. All the content presented in this PPT design is completely editable. Download it and make adjustments in color, background, font etc. as per your unique business setting.
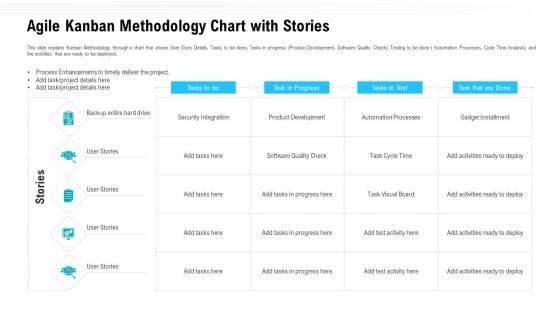
Agile Kanban Methodology Chart With Stories Ppt Model Show PDF
This slide explains Kanban Methodology through a chart that shows User Story Details, Tasks to be done, Tasks in progress Product Development, Software Quality Check, Testing to be done Automation Processes, Cycle Time Analysis and the activities that are ready to be deployed. Deliver an awe inspiring pitch with this creative agile kanban methodology chart with stories ppt model show pdf bundle. Topics like product development, process enhancements to timely deliver the project, agile kanban methodology chart with stories can be discussed with this completely editable template. It is available for immediate download depending on the needs and requirements of the user.
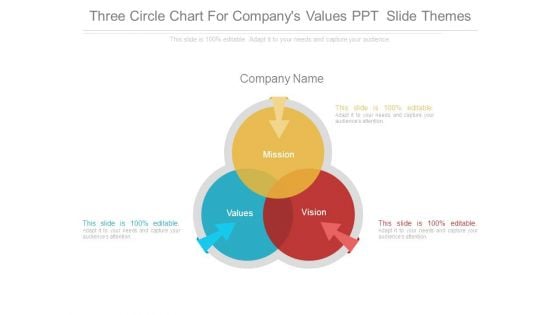
Three Circle Chart For Companys Values Ppt Slide Themes
This is a three circle chart for companys values ppt slide themes. This is a three stage process. The stages in this process are mission, company name, values, vision.
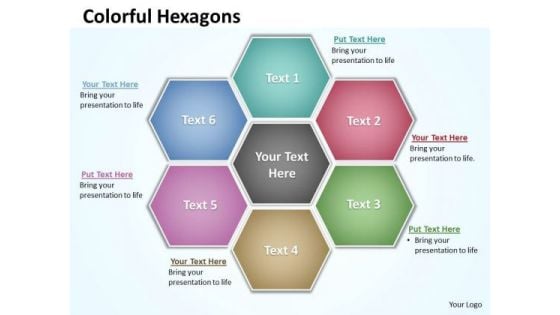
Ppt Hexagon Shapes Chart Presentation PowerPoint Tips Free Download Templates
PPT hexagon shapes chart presentation powerpoint tips free download Templates-This Hexagon diagram is a graphical illustration of the relationships between and among sets of data, groups of objects. . Present your views using this innovative slide and be assured of leaving a lasting impression.-PPT hexagon shapes chart presentation powerpoint tips free download Templates-Abstract, Background, Design, Digital, Elements, Graphic, Grey, Hexagon, Illustration, Light, Modern, Perspective, Triangles, Shapes, Shiny, Style, Technology, Template, Vector, Vertical, Virtual, Wallpaper, Web Experience the aesthetics of our Ppt Hexagon Shapes Chart Presentation PowerPoint Tips Free Download Templates. They are created with brilliant design sense.
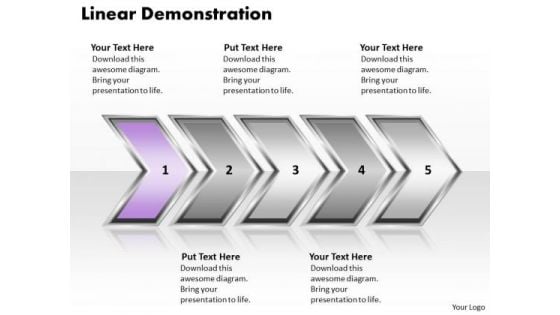
Ppt Linear Demonstration Of Arrows PowerPoint 2010 Org Chart Templates
PPT linear demonstration of arrows powerpoint 2010 org chart Templates-Life and Business is made up of processes comprising stages that flow from one to another. An excellent graphic to attract the attention of and understanding by your audience to improve earnings.-PPT linear demonstration of arrows powerpoint 2010 org chart Templates-Aim, Arrow, Arrowheads, Badge, Border, Click, Connection, Curve, Design, Direction, Download, Element, Fuchsia, Icon, Illustration, Indicator, Internet, Magenta, Mark, Object, Orientation, Pointer, Shadow, Shape, Sign Encourage creativity with our Ppt Linear Demonstration Of Arrows PowerPoint 2010 Org Chart Templates. You will come out on top.
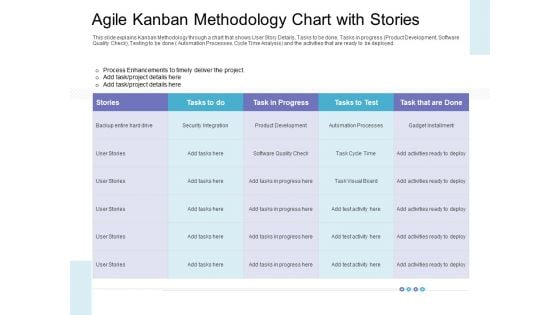
Agile Kanban Methodology Chart With Stories Formats PDF
This slide explains Kanban Methodology through a chart that shows User Story Details, Tasks to be done, Tasks in progress Product Development, Software Quality Check, Testing to be done Automation Processes, Cycle Time Analysis and the activities that are ready to be deployed. Deliver an awe-inspiring pitch with this creative agile kanban methodology chart with stories formats pdf bundle. Topics like agile kanban methodology chart with stories can be discussed with this completely editable template. It is available for immediate download depending on the needs and requirements of the user.
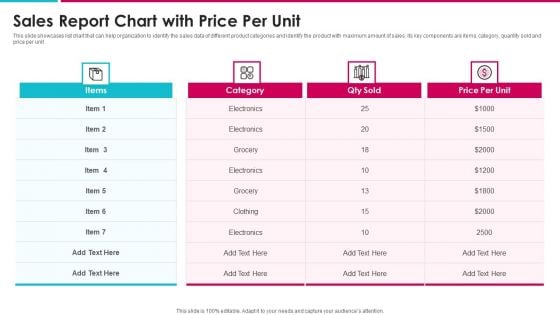
Sales Report Chart With Price Per Unit Information PDF
This slide showcases list chart that can help organization to identify the sales data of different product categories and identify the product with maximum amount of sales. Its key components are items, category, quantity sold and price per unit Showcasing this set of slides titled sales report chart with price per unit information pdf. The topics addressed in these templates are sales report chart with price per unit. All the content presented in this PPT design is completely editable. Download it and make adjustments in color, background, font etc. as per your unique business setting.
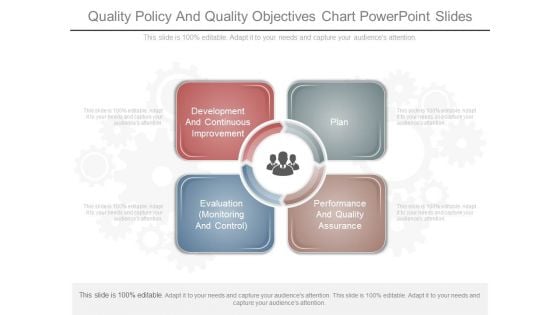
Quality Policy And Quality Objectives Chart Powerpoint Slides
This is a quality policy and quality objectives chart powerpoint slides. This is a four stage process. The stages in this process are development and continuous improvement, plan, evaluation monitoring and control, performance and quality assurance.
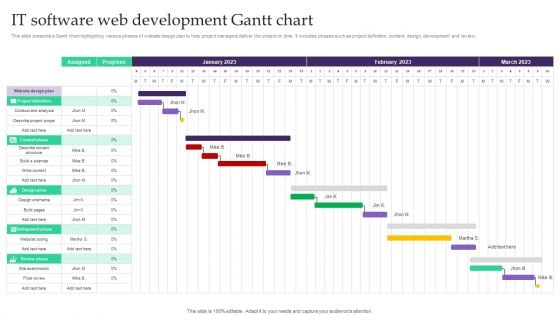
IT Software Web Development Gantt Chart Topics PDF
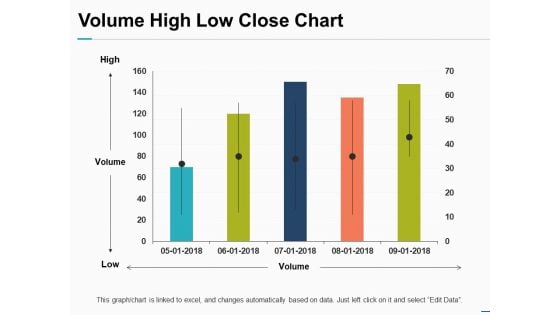
Volume High Low Close Chart Ppt PowerPoint Presentation Pictures Objects
This is a volume high low close chart ppt powerpoint presentation pictures objects. This is a one stage process. The stages in this process are finance, marketing, management, investment, analysis.
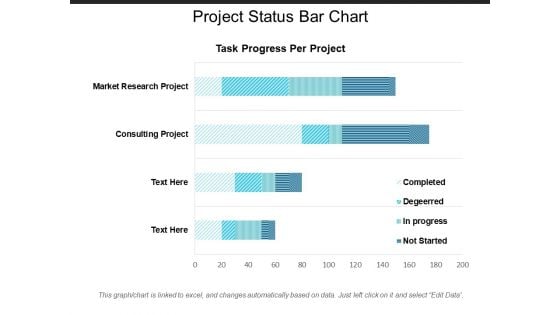
Project Status Bar Chart Ppt PowerPoint Presentation Ideas Objects
This is a project status bar chart ppt powerpoint presentation ideas objects. This is a four stage process. The stages in this process are project management, project progress, project growth.

Price Catalogue Chart With Bulk Cost And Deviation Background PDF
This slide showcases list chart that can help consumer to compare the price per unit offered by organization in marketplace. It also showcases pricing for bulk purchase of product and deviation in prices Showcasing this set of slides titled price catalogue chart with bulk cost and deviation background pdf. The topics addressed in these templates are price catalogue chart with bulk cost and deviation. All the content presented in this PPT design is completely editable. Download it and make adjustments in color, background, font etc. as per your unique business setting.
Circular Chart With Icons For Value Chain Powerpoint Template
This PowerPoint template has been designed with circular chart and icons. This professional PPT slide is suitable to present value chain analysis. Capture the attention of your audience using this professional slide.
Bubble Chart Employee Value Proposition Ppt PowerPoint Presentation Icon Sample
This is a bubble chart employee value proposition ppt powerpoint presentation icon sample. This is a two stage process. The stages in this process are business, management, strategy, analysis, marketing.
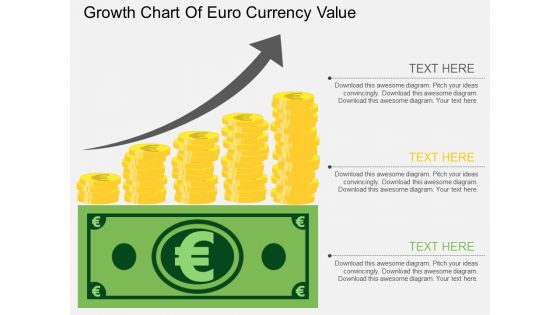
Growth Chart Of Euro Currency Value Powerpoint Template
The above PPT template displays growth chart of Euro currency. This diagram helps to exhibit Euro currency value growth. Adjust the above diagram in your business presentations to visually support your content.
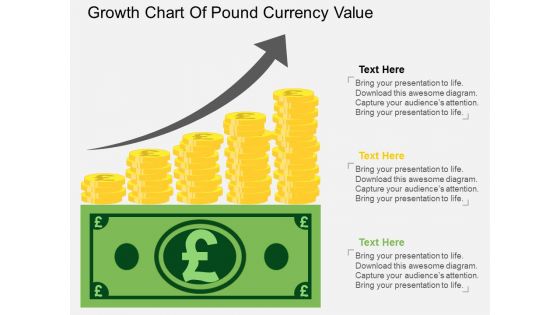
Growth Chart Of Pound Currency Value Powerpoint Template
The above PPT template displays growth chart of Pound currency. This diagram helps to exhibit Pound currency value growth. Adjust the above diagram in your business presentations to visually support your content.
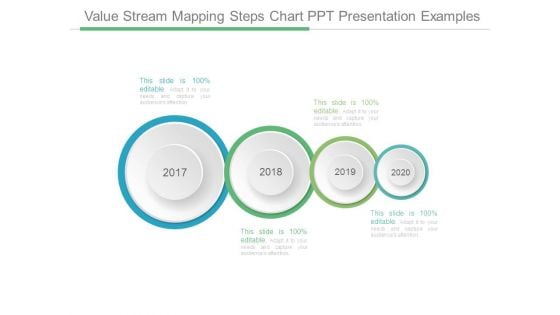
Value Stream Mapping Steps Chart Ppt Presentation Examples
This is a value stream mapping steps chart ppt presentation examples. This is a four stage process. The stages in this process are years, time planning, business, marketing, future.

Enterprise Value Timing Factors Chart Ppt Examples Professional
This is a enterprise value timing factors chart ppt examples professional. This is a four stage process. The stages in this process are industry dynamics, company performance, organic growth, strategic acquisitions.
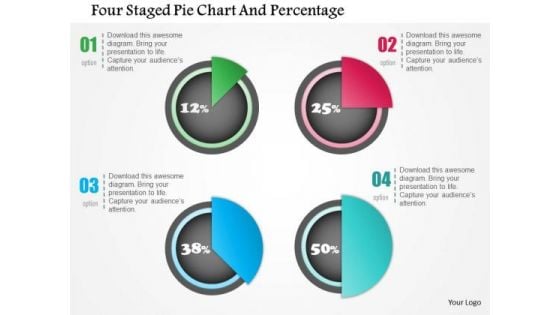
Business Diagram Four Staged Pie Chart And Percentage Presentation Template
Four staged pie chart and percentage values has been used to design this power point template. This PPT contains the concept of financial result analysis. Use this PPT for business and marketing related presentations.
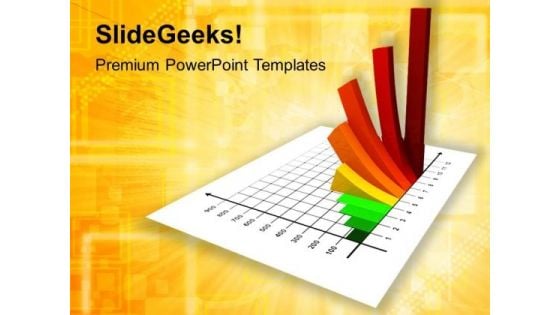
Business Chart Marketing PowerPoint Templates And PowerPoint Themes 1112
We present our Business Chart Marketing PowerPoint Templates And PowerPoint Themes 1112.Use our Marketing PowerPoint Templates because, Explain thecontribution of each of the elements and how they provide impetus to the next phase. Use our Success PowerPoint Templates because, Lead the way to spread good cheer to one and all. Use our Business PowerPoint Templates because, Use this template to explain the value of its wellness to human life. Use our Finance PowerPoint Templates because, Start with the fundamental basic activities and slowly but surely hone them down to the top of the pyramid, the ultimate goal. Use our Money PowerPoint Templates because, Business Process Design:- The template offers an excellent background to build up the various stages of your business process.Use these PowerPoint slides for presentations relating to Business graph, finance, success, marketing, business, money. The prominent colors used in the PowerPoint template are Green, Red, Yellow Our Business Chart Marketing PowerPoint Templates And PowerPoint Themes 1112 create presentations that blow your audience away. With our money back guarantee you have nothing to lose.
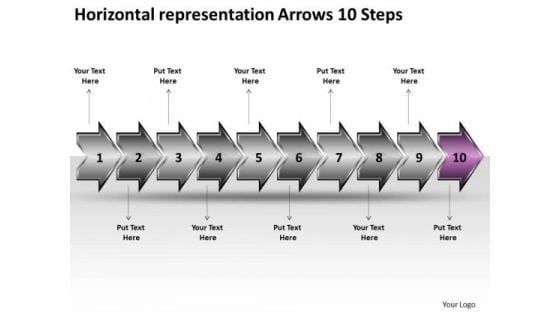
Horizontal Representation Arrows 10 Steps Documentation Flow Chart PowerPoint Templates
We present our horizontal representation arrows 10 steps documentation flow chart PowerPoint templates. Use our Design PowerPoint Templates because; represent the progress in our lives. Use our Arrows PowerPoint Templates because; now funnel your marketing strategies down the cone, stage by stage, refining as you go along. Use our Process and Flows PowerPoint Templates because, But you have an idea of which you are sure. Use our Shapes PowerPoint Templates because; amplify on this basic corporate concept and forefront the benefits of overlapping processes to arrive at common goals. Use our Business PowerPoint Templates because, Marketing Strategy Business Template:- Maximizing sales of your product is the intended destination. Use these PowerPoint slides for presentations relating to 3d ,abstract, around, arrows, business, center, circle, circular, concept, connections, curve, cycle, directions, distribution, illustration, management, middle, objects, plan, process, recycle, rounded, shadows, space, system. The prominent colors used in the PowerPoint template are Purple, White, and Gray Display your enterprise with our Horizontal Representation Arrows 10 Steps Documentation Flow Chart PowerPoint Templates. Go boldly forth with your plans.
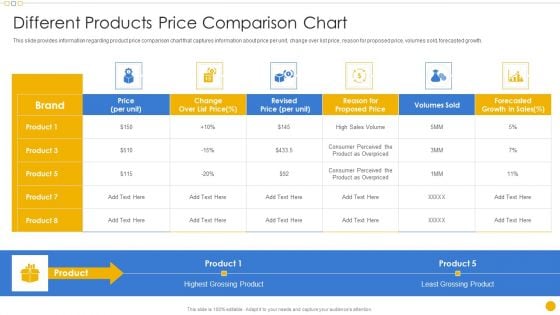
Sales Management Playbook Different Products Price Comparison Chart Professional PDF
This slide provides information regarding ideal customer profile that defines perfect customer fit to realize optimum value from product or solution rendered by identifying organizational concerns, pain points, value proposition, etc.Deliver and pitch your topic in the best possible manner with this Sales Management Playbook Different Products Price Comparison Chart Professional PDF Use them to share invaluable insights on Different Products Price Comparison Chart and impress your audience. This template can be altered and modified as per your expectations. So, grab it now.
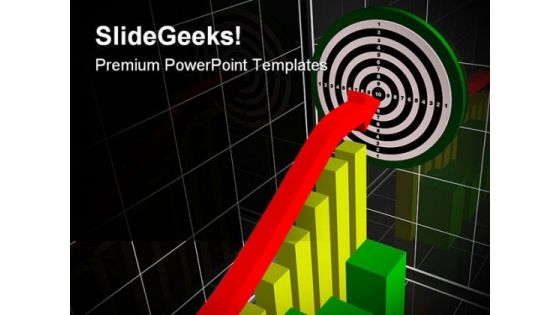
Performance Chart Business PowerPoint Templates And PowerPoint Backgrounds 0311
Microsoft PowerPoint Template and Background with business picture about analysis graph arrow and target Illustrate the essential elements of the project. Delve into the basic nature with our Performance Chart Business PowerPoint Templates And PowerPoint Backgrounds 0311.
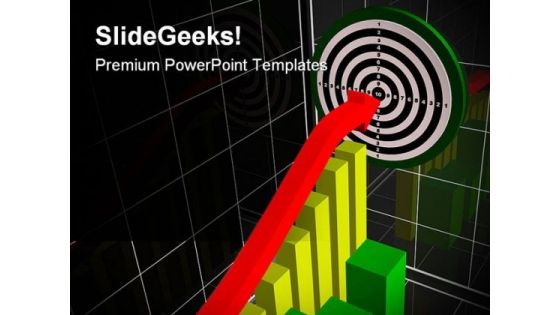
Performance Chart Business PowerPoint Themes And PowerPoint Slides 0311
Microsoft PowerPoint Theme and Slide with business picture about analysis graph arrow and target Your ideas will flower with our Performance Chart Business PowerPoint Themes And PowerPoint Slides 0311. Your brilliance will begin to bloom.
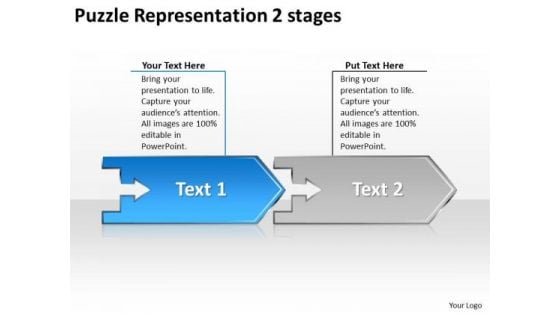
Puzzle Representation 2 Stages Ppt Flow Chart Slides Free PowerPoint
We present our puzzle representation 2 stages ppt flow chart Slides free PowerPoint. Use our Arrows PowerPoint Templates because, now you need to get it all together to form the complete picture and reach the goal. Use our Spheres PowerPoint Templates because, you have analyzed the illness and know the need. Use our Symbol PowerPoint Templates because, Business Template: - There is a vision, a need you can meet. Use our Marketing PowerPoint Templates because, Original thinking is the need of the hour. Use our Process and Flows PowerPoint Templates because, our template will help pinpoint their viability. Use these PowerPoint slides for presentations relating to Arrow, Business, Circle, Circular, Collection, Connection, Cursor, Decoration, Design, Dimensional, Direction, Element, Icon, Illustration, Information, Modern, Motion, Paper, Perspective, Plastic, Pointer, Pointing, Process, Recycle, Recycling, Reflective, Set, Shape, Shiny, Sign, Symbol, Technology. The prominent colors used in the PowerPoint template are Blue, Gray, and Black Back great ideas with our Puzzle Representation 2 Stages Ppt Flow Chart Slides Free PowerPoint. You will come out on top.
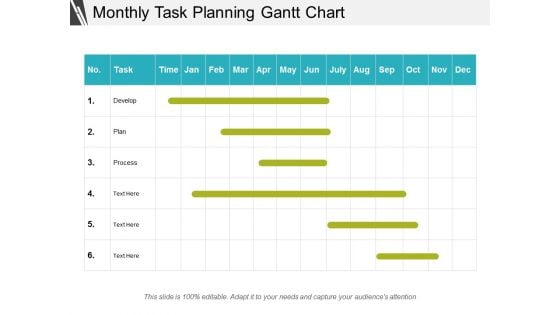
Monthly Task Planning Gantt Chart Ppt PowerPoint Presentation Portfolio Images
This is a monthly task planning gantt chart ppt powerpoint presentation portfolio images. This is a six stage process. The stages in this process are strategy plan, strategy objectives, strategy action.
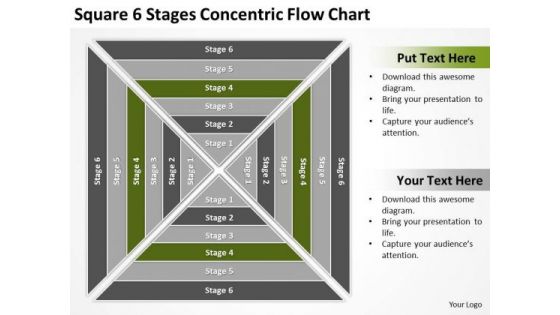
Square 6 Stages Concentric Flow Chart Business Plan PowerPoint Template
We present our square 6 stages concentric flow chart business plan PowerPoint template.Use our Business PowerPoint Templates because Your success is our commitment. Our PowerPoint Templates and Slides will ensure you reach your goal. Download and present our Signs PowerPoint Templates because Our PowerPoint Templates and Slides are topically designed to provide an attractive backdrop to any subject. Download and present our Shapes PowerPoint Templates because Our PowerPoint Templates and Slides are conceived by a dedicated team. Use them and give form to your wondrous ideas. Use our Boxes PowerPoint Templates because You can Hit a home run with our PowerPoint Templates and Slides. See your ideas sail into the minds of your audience. Present our Process and Flows PowerPoint Templates because You aspire to touch the sky with glory. Let our PowerPoint Templates and Slides provide the fuel for your ascent.Use these PowerPoint slides for presentations relating to 60s, 70s, art, background, decoration, decorative, design, fractal, generative, genetic, geometrical, hippie, illusion, illustration, kaleidoscope, kaleidoscopic, landscape, math, mathematical, mosaic, op, optical, optical illusion, pattern, pop, psychedelic, raytrace, retro, sculpture, seamless, seventies, sixties, symmetric, synthetic, vintage, virtual, virtual sculpture, wallpaper. The prominent colors used in the PowerPoint template are Green, Gray, White. Exhibit high fibre with our Square 6 Stages Concentric Flow Chart Business Plan PowerPoint Template. They display your fearless character.

Donut Pie Chart Product Finance Ppt PowerPoint Presentation Diagram Ppt
This is a donut pie chart product finance ppt powerpoint presentation diagram ppt. This is a three stage process. The stages in this process are finance, management, strategy, analysis, marketing.
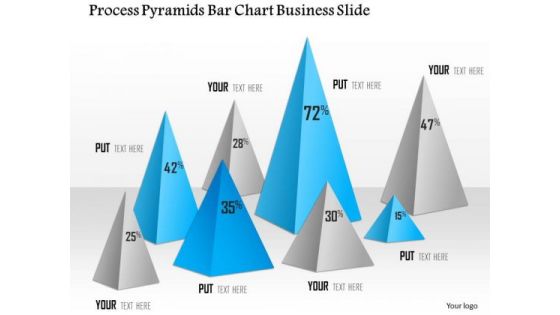
Business Diagram Process Pyramids Bar Chart Business Slide Presentation Template
Graphic of pyramid and bar chart has been used to design this power point template diagram. This PPT diagram contains the concept of business result analysis and process flow. Use this template slide and display result in your presentations.
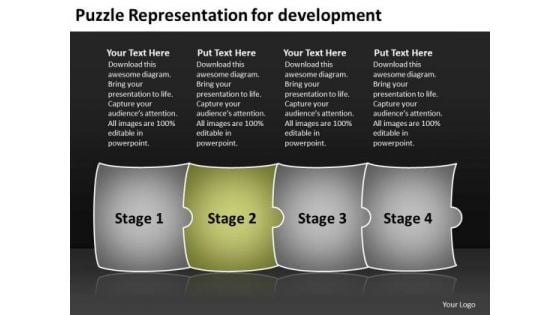
Puzzle Representation For Development Free Flow Chart PowerPoint Slides
We present our puzzle representation for development free flow chart PowerPoint Slides.Use our Business PowerPoint Templates because,It builds on your foundation or prepares for change ahead to enhance the future. Use our Puzzles or Jigsaws PowerPoint Templates because, It gives you really bright ideas. Use our Leadership PowerPoint Templates because, This Layout can explain the relevance of the different layers and stages in getting down to your core competence, ability and desired result. Use our Shapes PowerPoint Templates because,you can Master them all and you have it made. Use our Metaphor PowerPoint Templates because,There are various viable propositions available to further your commercial interests.Use these PowerPoint slides for presentations relating to 3d, abstract, background, business, company, concept, connection, design, development, goal, graphic, illustration, isolated, jigsaw, leadership, management, manager, metaphor, organization, pattern, puzzle, render, shape, solution, strategy, structure, system, teamwork. The prominent colors used in the PowerPoint template are Green, White, Gray Erroneous beliefs can be a bane. Be correct and accurate with our Puzzle Representation For Development Free Flow Chart PowerPoint Slides.
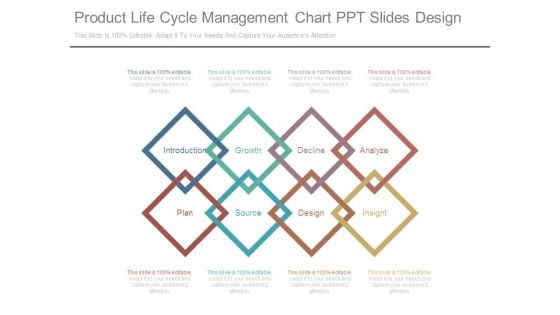
Product Life Cycle Management Chart Ppt Slides Design
This is a product life cycle management chart ppt slides design. This is a eight stage process. The stages in this process are introduction, growth, decline, analyze, plan, source, design, insight.
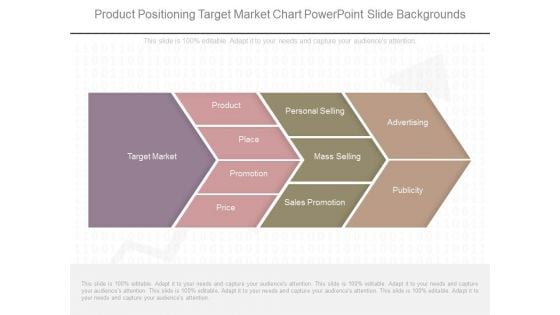
Product Positioning Target Market Chart Powerpoint Slide Backgrounds
This is a product positioning target market chart powerpoint slide backgrounds. This is a four stage process. The stages in this process are target market, product, place, promotion, price, personal selling, mass selling, sales promotion, advertising, publicity.
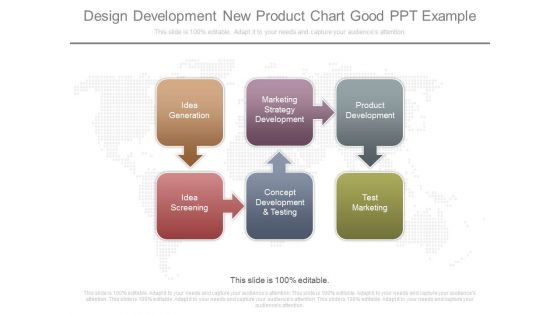
Design Development New Product Chart Good Ppt Example
This is a design development new product chart good ppt example. This is a six stage process. The stages in this process are idea generation, marketing strategy development, product development, idea screening, concept development and testing, test marketing.

Curve Chart For Product Life Cycle Presentation Outline
This is a curve chart for product life cycle presentation outline. This is a five stage process. The stages in this process are sales over time, product extension, introduction, growth, maturity, decline, time.
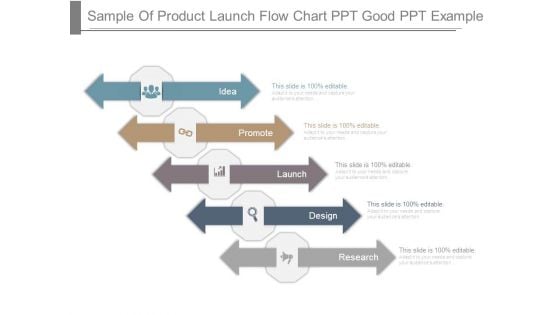
Sample Of Product Launch Flow Chart Ppt Good Ppt Example
This is a sample of product launch flow chart ppt good ppt example. This is a five stage process. The stages in this process are idea, promote, launch, design, research.
Our Product Vs Competition Analysis Chart Powerpoint Slide Background Designs
This is a our product vs competition analysis chart powerpoint slide background designs. This is a four stage process. The stages in this process are business, marketing, success, strategy, compare.
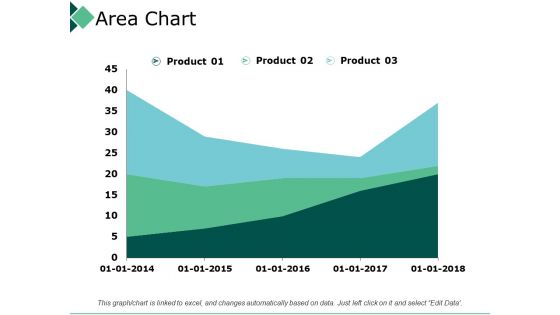
Area Chart Product Marketing Ppt PowerPoint Presentation Layouts Portfolio
This is a area chart product marketing ppt powerpoint presentation layouts portfolio. This is a three stage process. The stages in this process are business, management, strategy, analysis, marketing.
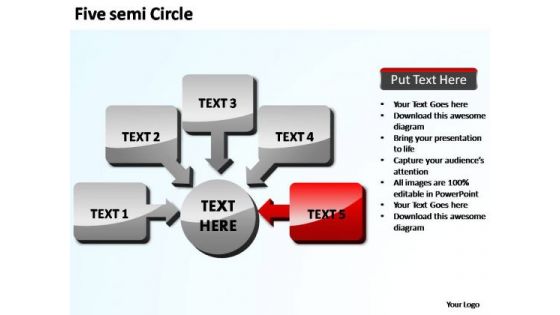
PowerPoint Backgrounds Chart Five New Concepts Ppt Slide
PowerPoint Backgrounds Chart Five New Concepts PPT Slide-Explore the various directions and layers existing in your in your plans and processes. Unravel the desired and essential elements of your overall strategy. Explain the relevance of the different layers and stages and directions in getting down to your core competence, ability and desired result. Deliver your address faultlessly. Our PowerPoint Backgrounds Chart Five New Concepts Ppt Slide ensure smooth and seamless flow.
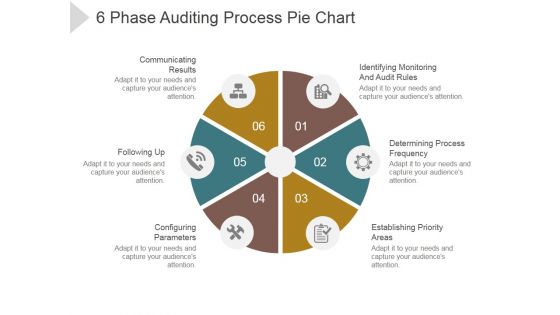
6 Phase Auditing Process Pie Chart Ppt PowerPoint Presentation Graphics
This is a 6 phase auditing process pie chart ppt powerpoint presentation graphics. This is a six stage process. The stages in this process are communicating results, following up, configuring parameters, establishing priority areas, determining process frequency.
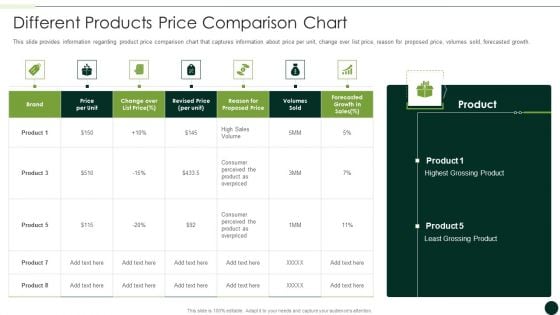
Salesman Principles Playbook Different Products Price Comparison Chart Slides PDF
This slide provides information regarding product price comparison chart that captures information about price per unit, change over list price, reason for proposed price, volumes sold, forecasted growth. Deliver an awe inspiring pitch with this creative salesman principles playbook different products price comparison chart slides pdf bundle. Topics like weekly updates meets, monthly review meetings, quarterly review meetings can be discussed with this completely editable template. It is available for immediate download depending on the needs and requirements of the user.
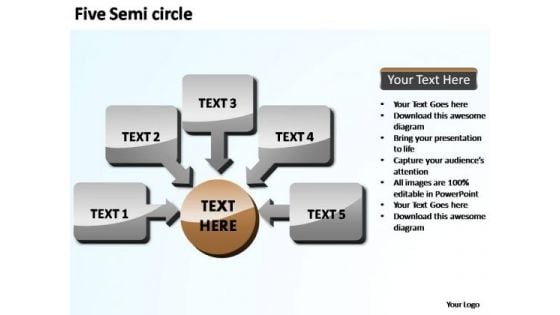
PowerPoint Design Chart Five New Concepts Ppt Slide
PowerPoint Design Chart Five New Concepts PPT Slide-Explore the various directions and layers existing in your in your plans and processes. Unravel the desired and essential elements of your overall strategy. Explain the relevance of the different layers and stages and directions in getting down to your core competence, ability and desired result. Collect all the evidence on our PowerPoint Design Chart Five New Concepts Ppt Slide. Connect the clues and come to conclusions with ease.


 Continue with Email

 Home
Home


