Goal Chart
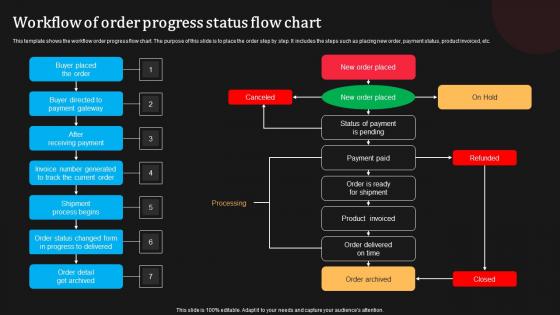
Workflow Of Order Progress Status Flow Chart Template Pdf
This template shows the workflow order progress flow chart. The purpose of this slide is to place the order step by step. It includes the steps such as placing new order, payment status, product invoiced, etc.Showcasing this set of slides titled Workflow Of Order Progress Status Flow Chart Template Pdf The topics addressed in these templates are Receiving Payment, Payment Gateway, Progress Delivered All the content presented in this PPT design is completely editable. Download it and make adjustments in color, background, font etc. as per your unique business setting. This template shows the workflow order progress flow chart. The purpose of this slide is to place the order step by step. It includes the steps such as placing new order, payment status, product invoiced, etc.
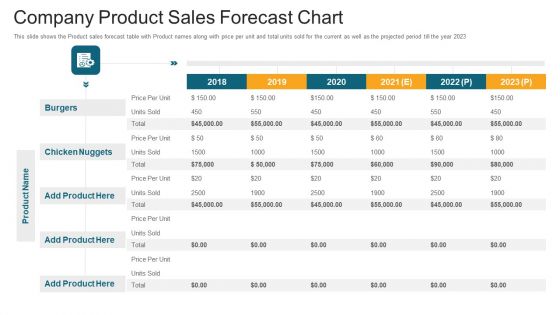
Company Product Sales Forecast Chart Ppt File Slide Portrait PDF
This slide shows the Product sales forecast table with Product names along with price per unit and total units sold for the current as well as the projected period till the year 2023. Deliver an awe inspiring pitch with this creative company product sales forecast chart ppt file slide portrait pdf bundle. Topics like company product sales forecast chart can be discussed with this completely editable template. It is available for immediate download depending on the needs and requirements of the user.
Ppt Slide Business Illustration Umbrella Chart Strategic Planning
Get The Domestics Right With Our PPT Slide business illustration umbrella chart strategic planning Powerpoint Templates. Create The Base For Thoughts To Grow. Do Away With Dogmatic Approaches. Establish The Value Of Reason With Our Business Plan Powerpoint Templates.
Five Circles Linear Chart With Icons Powerpoint Slides
Visually support your presentation with our above template containing five circles linear chart with icons. This diagram slide may be used for comparing contrasting different business objects. Etch your views in the brains of your audience with this diagram slide.
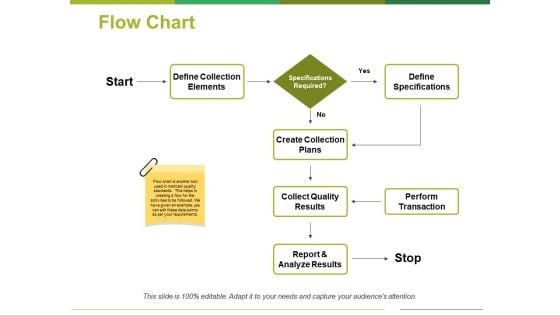
Flow Chart Ppt PowerPoint Presentation File Infographic Template
This is a flow chart ppt powerpoint presentation file infographic template. This is a seven stage process. The stages in this process are start, define specifications, perform transaction, create collection plans, report and analyze results.
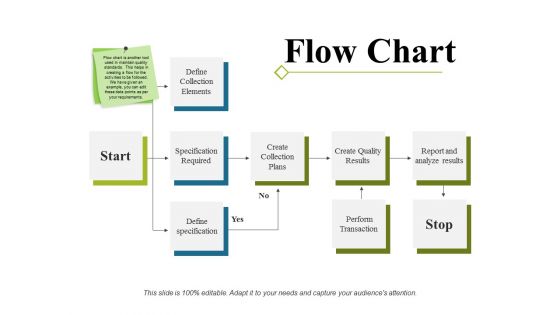
Flow Chart Ppt PowerPoint Presentation File Layout Ideas
This is a flow chart ppt powerpoint presentation file layout ideas. This is a four stage process. The stages in this process are define collection elements, specification required, define specification, create collection plans, create quality results, perform transaction.
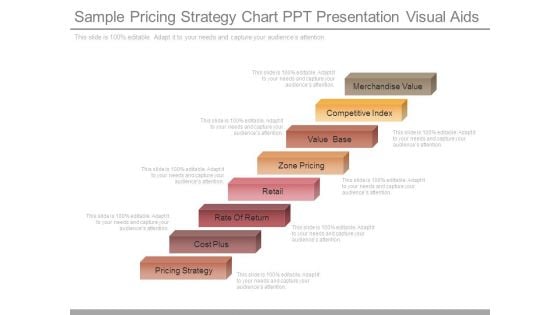
Sample Pricing Strategy Chart Ppt Presentation Visual Aids
This is a sample pricing strategy chart ppt presentation visual aids. This is a eight stage process. The stages in this process are merchandise value, competitive index, value base, zone pricing, retail, rate of return, cost plus, pricing strategy.
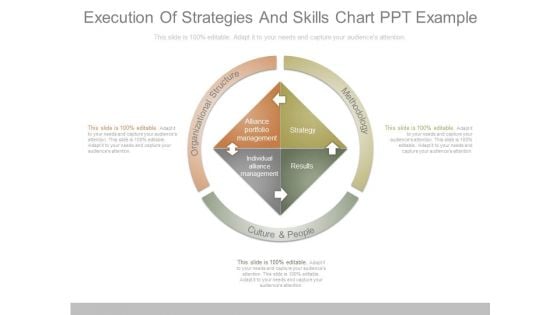
Execution Of Strategies And Skills Chart Ppt Example
This is a execution of strategies and skills chart ppt example. This is a three stage process. The stages in this process are methodology, culture and people, organizational structure, alliance portfolio management, strategy, individual alliance management, results.
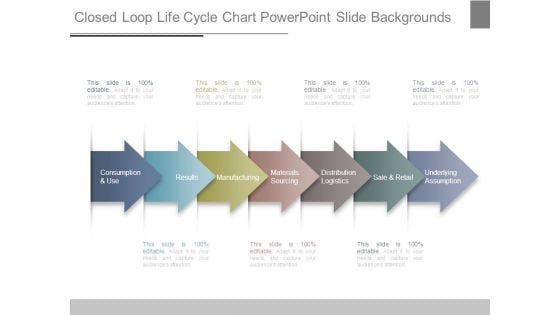
Closed Loop Life Cycle Chart Powerpoint Slide Backgrounds
This is a closed loop life cycle chart powerpoint slide backgrounds. This is a seven stage process. The stages in this process are consumption and use, results, manufacturing, materials sourcing, distribution logistics, sale and retail, underlying assumption.
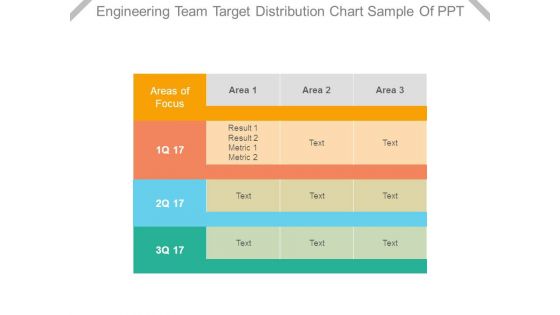
Engineering Team Target Distribution Chart Sample Of Ppt
This is a engineering team target distribution chart sample of ppt. This is a three stage process. The stages in this process are areas of focus, area, result, metric.
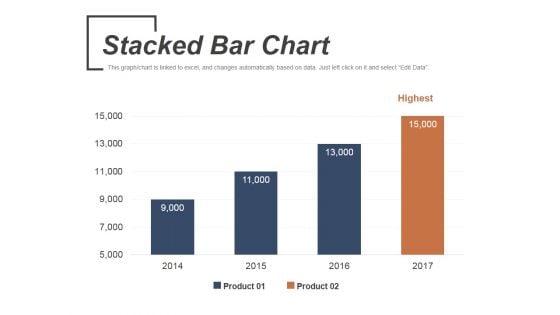
Stacked Bar Chart Ppt PowerPoint Presentation Inspiration Ideas
This is a stacked bar chart ppt powerpoint presentation inspiration ideas. This is a four stage process. The stages in this process are product, highest, business, marketing, bar graph.
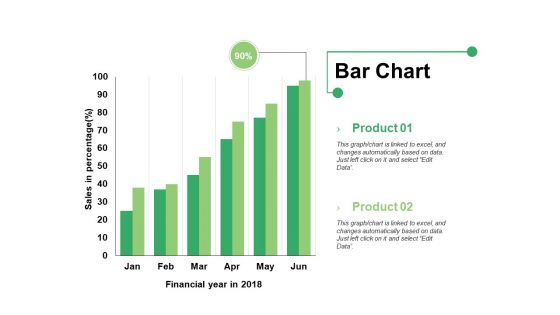
Bar Chart Ppt PowerPoint Presentation Infographics Format Ideas
This is a bar chart ppt powerpoint presentation infographics format ideas. This is a two stage process. The stages in this process are bar graph, product, financial year, sales in percentage.
Product Marketing Department Team Organizational Chart Icon Professional PDF
Persuade your audience using this Product Marketing Department Team Organizational Chart Icon Professional PDF. This PPT design covers three stages, thus making it a great tool to use. It also caters to a variety of topics including Team Organizational Chart Icon, Product Marketing Department. Download this PPT design now to present a convincing pitch that not only emphasizes the topic but also showcases your presentation skills.
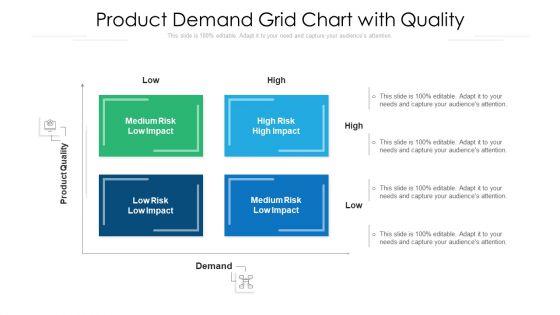
Product Demand Grid Chart With Quality Ppt Inspiration Maker PDF
Persuade your audience using this product demand grid chart with quality ppt inspiration maker pdf. This PPT design covers four stages, thus making it a great tool to use. It also caters to a variety of topics including product demand grid chart with quality. Download this PPT design now to present a convincing pitch that not only emphasizes the topic but also showcases your presentation skills.
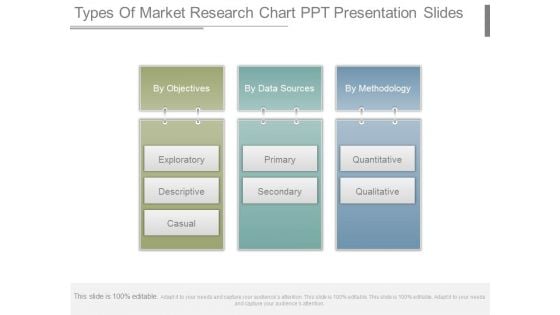
Types Of Market Research Chart Ppt Presentation Slides
This is a types of market research chart ppt presentation slides. This is a three stage process. The stages in this process are by objectives, exploratory, descriptive, causal, by data sources, primary, secondary, by methodology, quantitative, qualitative.
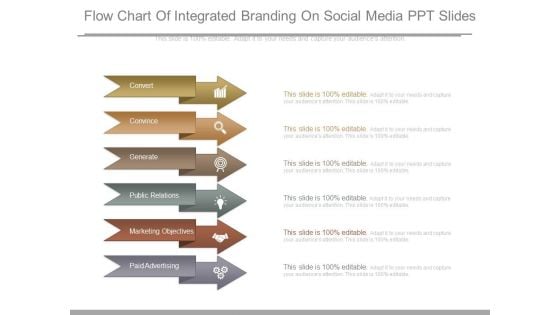
Flow Chart Of Integrated Branding On Social Media Ppt Slides
This is a flow chart of integrated branding on social media ppt slides. This is a six stage process. The stages in this process are convert, convince, generate, public relations, marketing objectives, paid advertising.
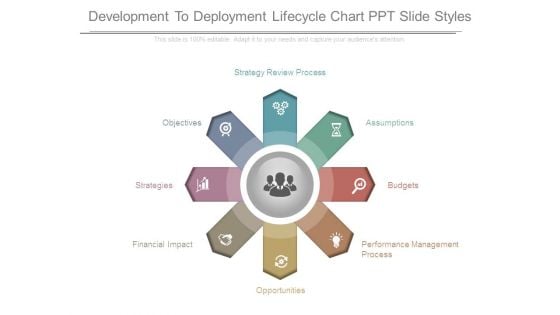
Development To Deployment Lifecycle Chart Ppt Slide Styles
This is a development to deployment lifecycle chart ppt slide styles. This is a eight stage process. The stages in this process are performance management process, opportunities, financial impact, strategies, objectives, strategy review process, assumptions, budgets.
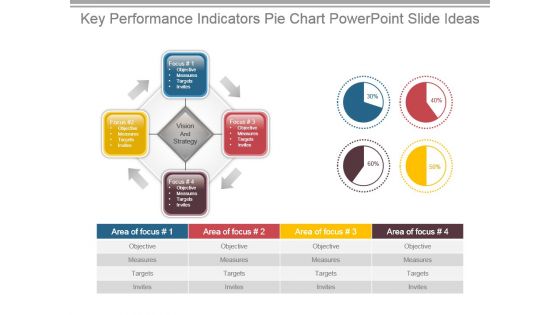
Key Performance Indicators Pie Chart Powerpoint Slide Ideas
This is a key performance indicators pie chart powerpoint slide ideas. This is a four stage process. The stages in this process are focus, objectives, measures, targets, invites, vision and strategy, area of focus.
Market Trends Chart With Percentage And Icons Powerpoint Slides
This PowerPoint template has been designed with graphics of chart with percentage values and icons. This PowerPoint template may be used to market trends and financial analysis. Prove the viability of your ideas using this impressive slide.
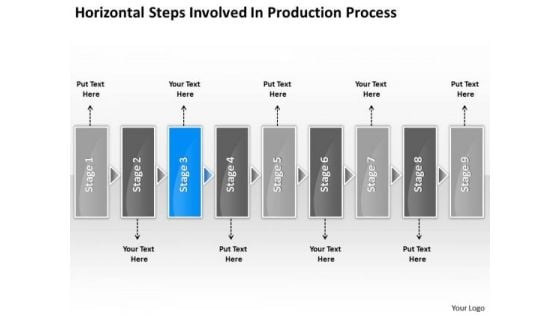
Steps Involved Production Processs Chart Electrical Design PowerPoint Slides
We present our steps involved production processs chart electrical design PowerPoint Slides.Download and present our Advertising PowerPoint Templates because you require care and diligence to function well. Download and present our Business PowerPoint Templates because you can see clearly through to the bigger bowl ahead. Time your jump to perfection and hit the nail on the head. Download and present our Shapes PowerPoint Templates because you have the people in place, selected the team leaders and all are raring to go. Download our Process and Flow PowerPoint Templates because there is a very good saying that prevention is better than cure, either way you have a store of knowledge for sure. Present our Arrows PowerPoint Templates because excite your audience with the brilliance of your thoughts.Use these PowerPoint slides for presentations relating to Abstract, Action, Attach, Box, Business, Center, Chain, Chart, Color, Communication, Concept, Connection, Cube, Cycle, Data, Diagram, Flow, Globe, Horizontal, Idea, Illustration, Information, Interaction, Jigsaw, Join, Link, Pieces, Process, Puzzle, Relation, Relationship, Shape, Success. The prominent colors used in the PowerPoint template are Blue, Gray, White. PowerPoint presentation experts tell us our steps involved production processs chart electrical design PowerPoint Slides will help you be quick off the draw. Just enter your specific text and see your points hit home. Customers tell us our Chart PowerPoint templates and PPT Slides are Flirty. Use our steps involved production processs chart electrical design PowerPoint Slides are Elevated. Use our Box PowerPoint templates and PPT Slides are Graceful. We assure you our steps involved production processs chart electrical design PowerPoint Slides are Majestic. People tell us our Chart PowerPoint templates and PPT Slides are Versatile. Beat criticism with our Steps Involved Production Processs Chart Electrical Design PowerPoint Slides. You will come out on top.
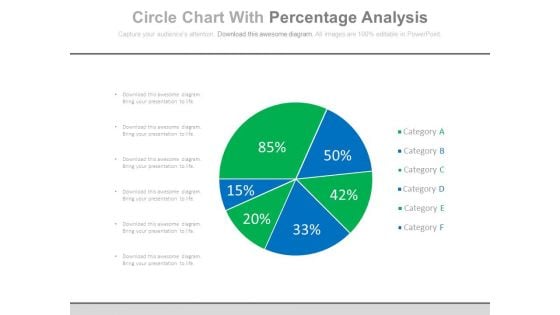
Percentage Chart For Good Marketing Strategy Powerpoint Slides
This PowerPoint template has been designed with pie chart and percentage values. The PowerPoint template has a high quality design. You can download this PowerPoint slide to make good marketing strategy and business plans.
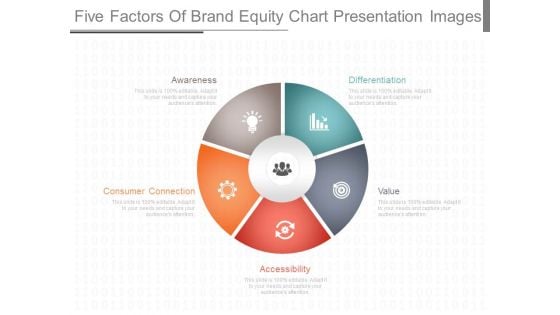
Five Factors Of Brand Equity Chart Presentation Images
This is a five factors of brand equity chart presentation images. This is a five stage process. The stages in this process are awareness, differentiation, consumer connection, accessibility, value. \n \n \n \n \n \n \n \n \n \n
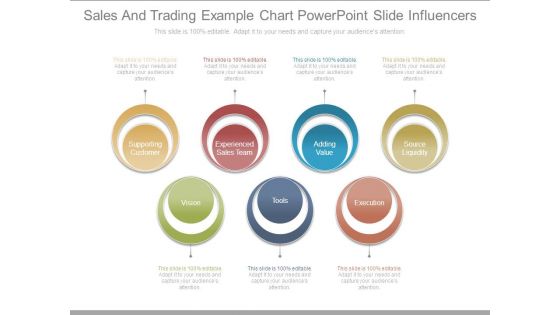
Sales And Trading Example Chart Powerpoint Slide Influencers
This is a sales and trading example chart powerpoint slide influencers. This is a seven stage process. The stages in this process are supporting customer, experienced sales team, adding value, source liquidity, vision, tools, execution.
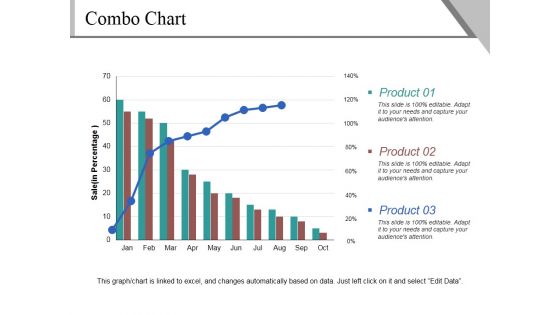
Combo Chart Ppt PowerPoint Presentation Ideas Visual Aids
This is a combo chart ppt powerpoint presentation ideas visual aids. This is a three stage process. The stages in this process are product, sales, bar graph, business, marketing.
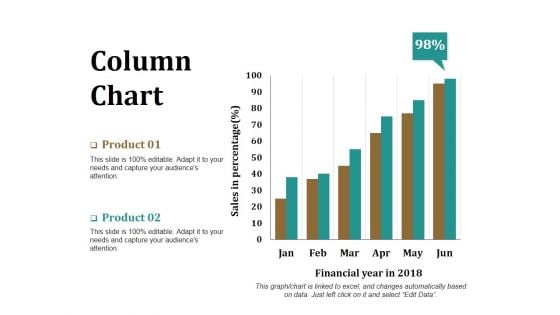
Column Chart Ppt PowerPoint Presentation Model Graphics Download
This is a column chart ppt powerpoint presentation model graphics download. This is a two stage process. The stages in this process are product, financial year, sales in percentage, bar graph, success.
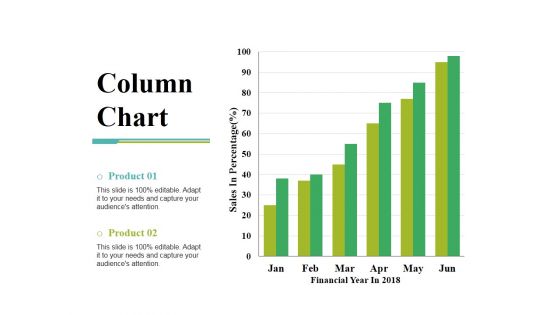
Column Chart Ppt PowerPoint Presentation Gallery Slide Portrait
This is a column chart ppt powerpoint presentation gallery slide portrait. This is a two stage process. The stages in this process are sales in percentage, financial year, product, bar graph, growth.
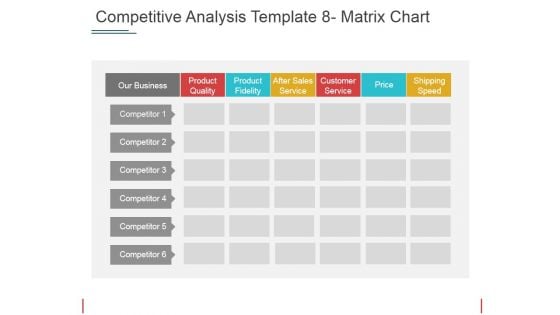
Competitive Analysis Matrix Chart Ppt PowerPoint Presentation Portfolio Format Ideas
This is a competitive analysis matrix chart ppt powerpoint presentation portfolio format ideas. This is a six stage process. The stages in this process are our business, product quality, product fidelity, after sales service, customer service.
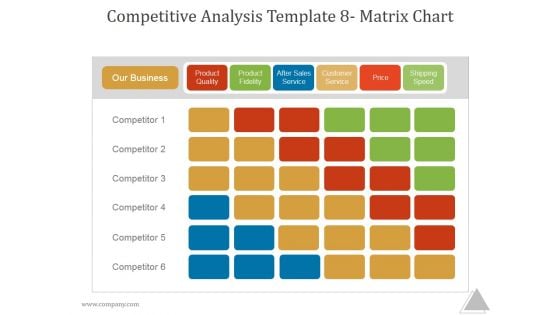
Competitive Analysis Template 8 Matrix Chart Ppt PowerPoint Presentation Templates
This is a competitive analysis template 8 matrix chart ppt powerpoint presentation templates. This is a six stage process. The stages in this process are our business, product quality, product fidelity, after sales service, customer service, price, shipping speed, competitor.
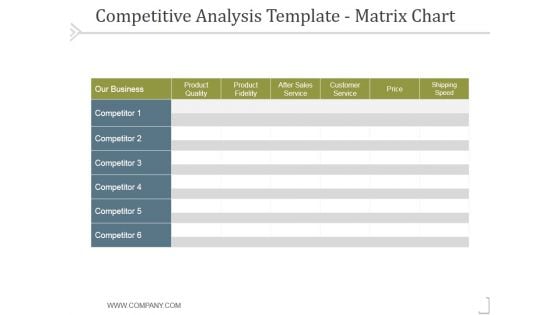
Competitive Analysis Matrix Chart Template 1 Ppt PowerPoint Presentation Deck
This is a competitive analysis matrix chart template 1 ppt powerpoint presentation deck. This is a six stage process. The stages in this process are product quality, product fidelity, after sales service, customer service, shipping speed.
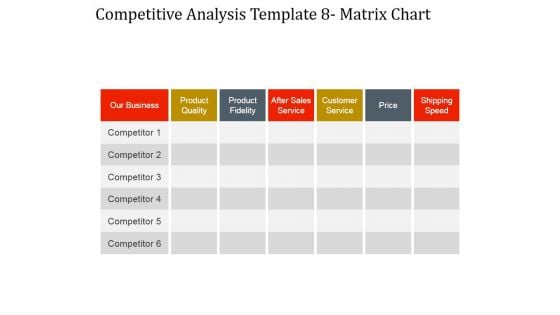
Competitive Analysis Matrix Chart Ppt PowerPoint Presentation Gallery
This is a competitive analysis matrix chart ppt powerpoint presentation gallery. This is a seven stage process. The stages in this process are our business, product quality, product fidelity, after sales service, customer service, price, shipping speed.
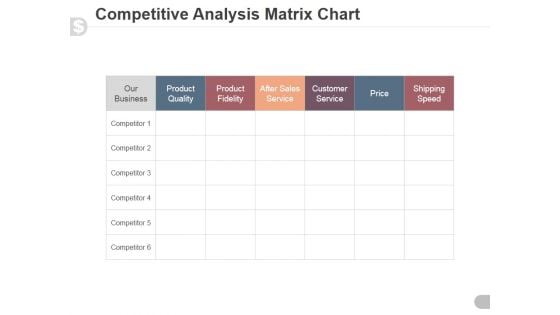
Competitive Analysis Matrix Chart Ppt PowerPoint Presentation Inspiration
This is a competitive analysis matrix chart ppt powerpoint presentation inspiration. This is a six stage process. The stages in this process are product quality, product fidelity, after sales service, customer service, price, shipping speed.
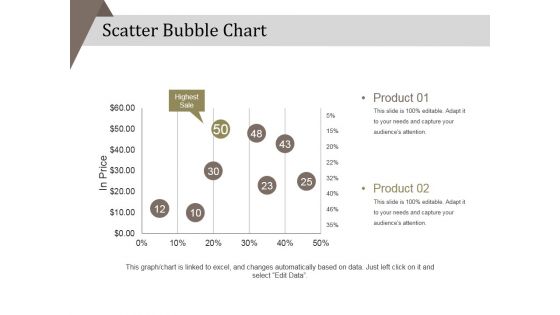
Scatter Bubble Chart Ppt PowerPoint Presentation Diagram Ppt
This is a scatter bubble chart ppt powerpoint presentation diagram ppt. This is a two stage process. The stages in this process are product, in price, highest sale, percentage, business, marketing.
Donut Pie Chart Ppt PowerPoint Presentation Icon Slide Portrait
This is a donut pie chart ppt powerpoint presentation icon slide portrait. This is a five stage process. The stages in this process are product, percentage, finance, donut, business.
Combo Chart Ppt PowerPoint Presentation Icon Design Templates
This is a combo chart ppt powerpoint presentation icon design templates. This is a three stage process. The stages in this process are market size, growth rate, product, business, success.
Scatter Bubble Chart Ppt PowerPoint Presentation Icon Elements
This is a scatter bubble chart ppt powerpoint presentation icon elements. This is a six stage process. The stages in this process are highest profit, profit, financial year, product.
Scatter Line Chart Ppt PowerPoint Presentation Icon Files
This is a scatter line chart ppt powerpoint presentation icon files. This is a one stage process. The stages in this process are dollar in millions, product, sales in percentage.
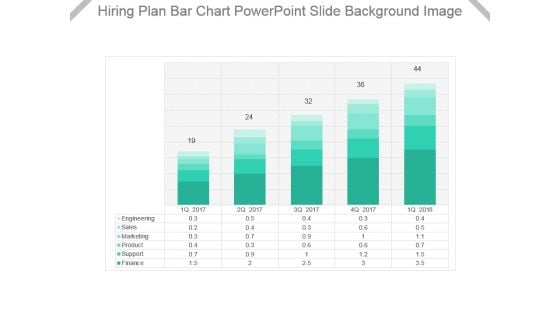
Hiring Plan Bar Chart Powerpoint Slide Background Image
This is a hiring plan bar chart powerpoint slide background image. This is a five stage process. The stages in this process are engineering, sales, marketing, product, support, finance.
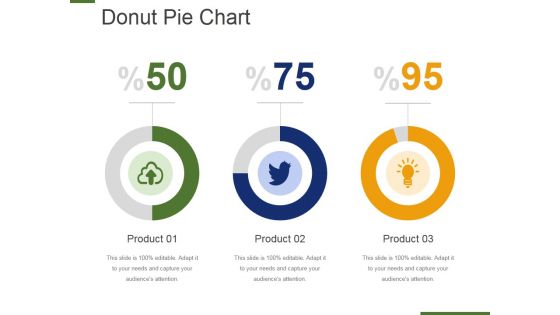
Donut Pie Chart Ppt PowerPoint Presentation Pictures Infographic Template
This is a donut pie chart ppt powerpoint presentation pictures infographic template. This is a three stage process. The stages in this process are product, business, marketing, icons, process.
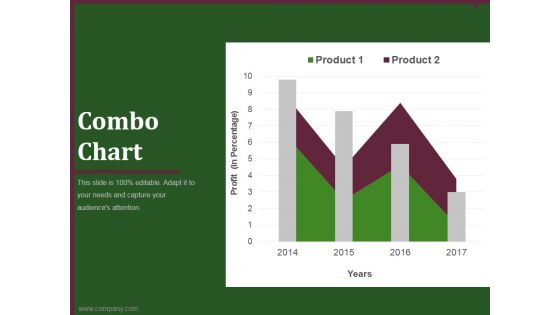
combo chart template 2 ppt powerpoint presentation background images
This is a combo chart template 2 ppt powerpoint presentation background images. This is a four stage process. The stages in this process are business, marketing, finance, timeline, product.
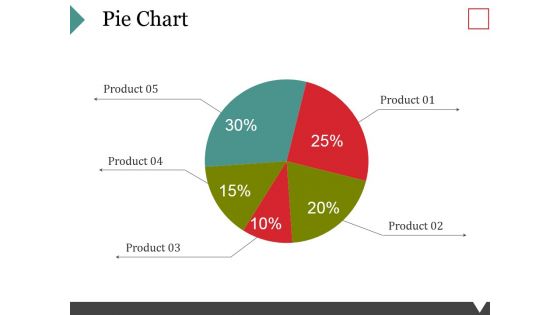
Pie Chart Ppt PowerPoint Presentation Summary Background Image
This is a pie chart ppt powerpoint presentation summary background image. This is a five stage process. The stages in this process are business, marketing, product, finance, strategy, planning.
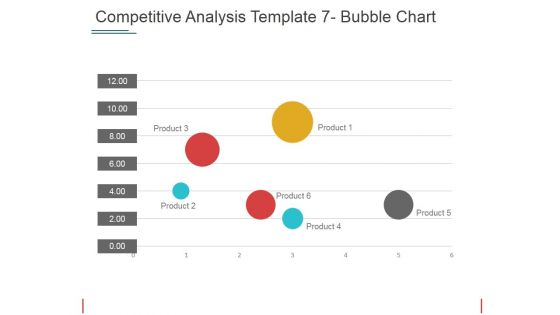
Competitive Analysis Bubble Chart Ppt PowerPoint Presentation Pictures Mockup
This is a competitive analysis bubble chart ppt powerpoint presentation pictures mockup. This is a six stage process. The stages in this process are product, table, business, marketing, management.
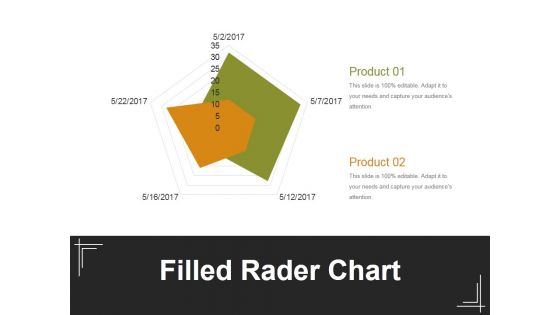
Filled Rader Chart Ppt PowerPoint Presentation Professional Background Image
This is a filled rader chart ppt powerpoint presentation professional background image. This is a five stage process. The stages in this process are product, business, marketing, process, management.
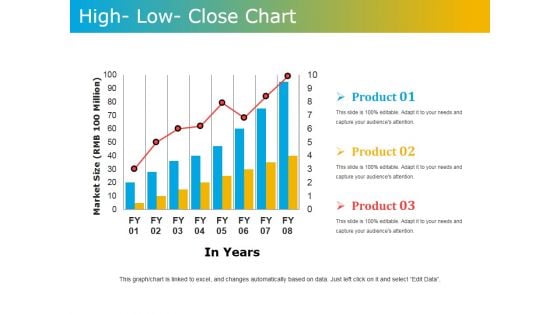
High Low Close Chart Ppt PowerPoint Presentation Model Graphics Tutorials
This is a high low close chart ppt powerpoint presentation model graphics tutorials. This is a three stage process. The stages in this process are market size, in years, product.
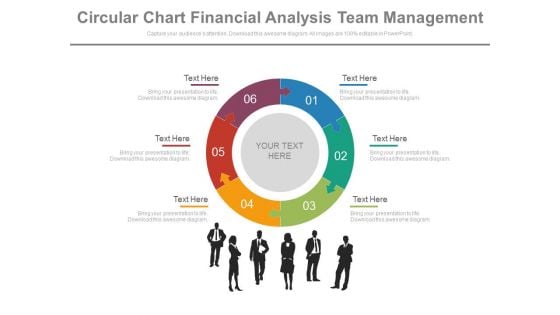
Puzzle Pie Chart With Team For Financial Analysis Powerpoint Slides
This PPT slide contains graphics of puzzle pie chart with team icons. You may use this PowerPoint template to display team strategy and success. Download this professional slide design to deliver amazing presentations.
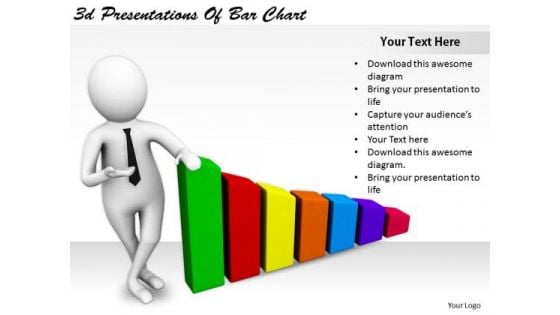
Business Strategy Innovation 3d Presentations Of Bar Chart Character Modeling
Your Thoughts Will Be The Main Course. Provide The Dressing With Our business strategy innovation 3d presentations of bar chart character modeling Powerpoint Templates. Dress Up Your Views With Our Marketing Powerpoint Templates. Deliver Your Ideas With Aplomb.
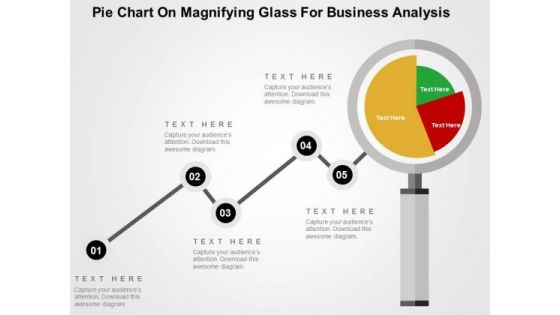
Pie Chart On Magnifying Glass For Business Analysis PowerPoint Template
Visually support your presentation with our above template showing pie chart on magnifying glass. This slide has been professionally designed to emphasize the concept of market research and analysis. Deliver amazing presentations to mesmerize your audience.
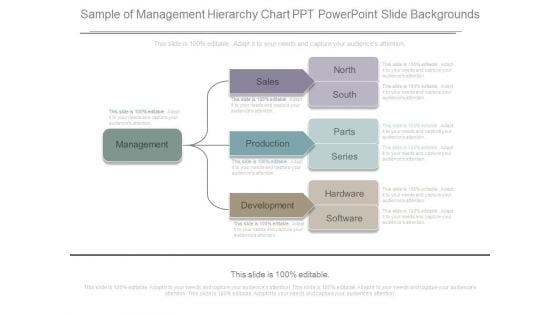
Sample Of Management Hierarchy Chart Ppt Powerpoint Slide Backgrounds
This is a sample of management hierarchy chart ppt powerpoint slide backgrounds. This is a one stage process. The stages in this process are management, sales, production, development, north, south, parts, series, hardware, software.
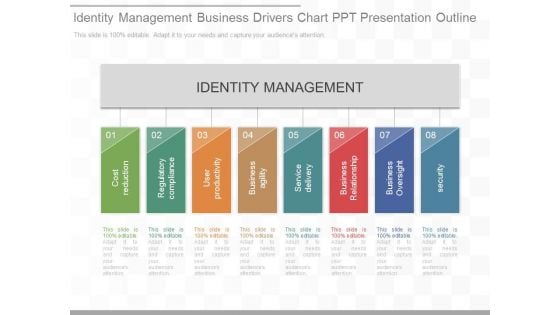
Identity Management Business Drivers Chart Ppt Presentation Outline
This is a identity management business drivers chart ppt presentation outline. This is a eight stage process. The stages in this process are identity management, cost reduction, regulatory compliance, user productivity, business agility, service delivery, business relationship, business oversight, security.
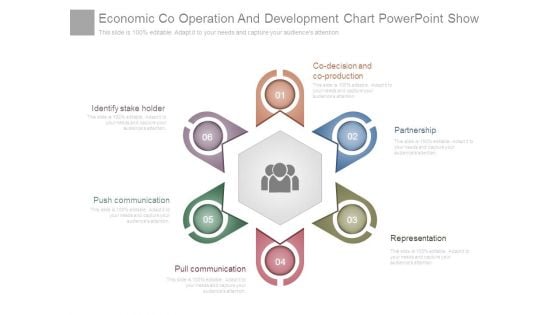
Economic Co Operation And Development Chart Powerpoint Show
This is a economic co operation and development chart powerpoint show. This is a six stage process. The stages in this process are co decision and co production, partnership, representation, pull communication, push communication, identify stake holder.
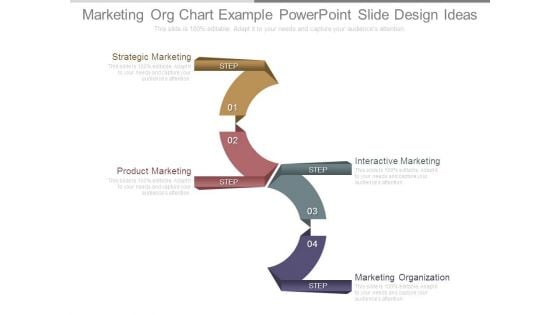
Marketing Org Chart Example Powerpoint Slide Design Ideas
This is a marketing org chart example powerpoint slide design ideas. This is a four stage process. The stages in this process are strategic marketing, product marketing, interactive marketing, marketing organization.
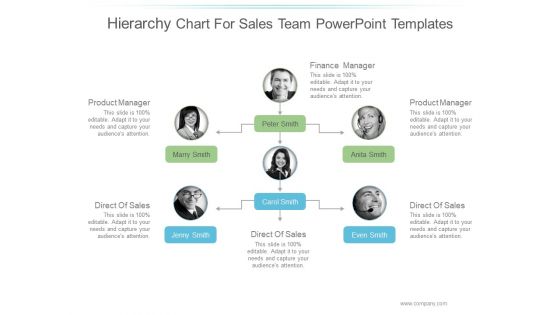
Hierarchy Chart For Sales Team Ppt PowerPoint Presentation Samples
This is a hierarchy chart for sales team ppt powerpoint presentation samples. This is a six stage process. The stages in this process are business, marketing, technology, product, management.
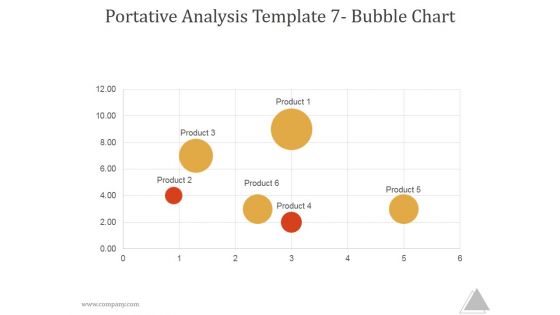
Portative Analysis Template 7 Bubble Chart Ppt PowerPoint Presentation Picture
This is a portative analysis template 7 bubble chart ppt powerpoint presentation picture. This is a six stage process. The stages in this process are product, business, marketing, management.
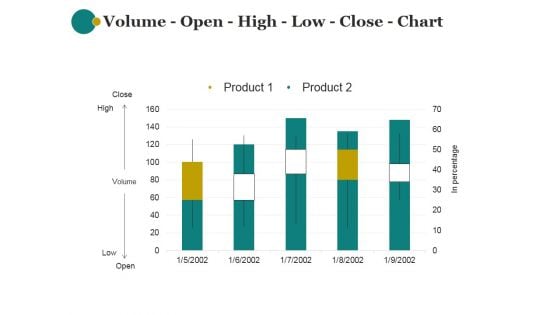
Volume Open High Low Close Chart Ppt PowerPoint Presentation Show
This is a volume open high low close chart ppt powerpoint presentation show. This is a five stage process. The stages in this process are product, marketing, business, management, strategy.
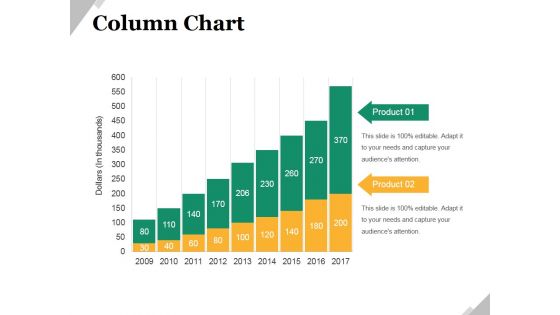
Column Chart Ppt PowerPoint Presentation Infographic Template Graphic Images
This is a column chart ppt powerpoint presentation infographic template graphic images. This is a nine stage process. The stages in this process are business, marketing, growth, product, management.
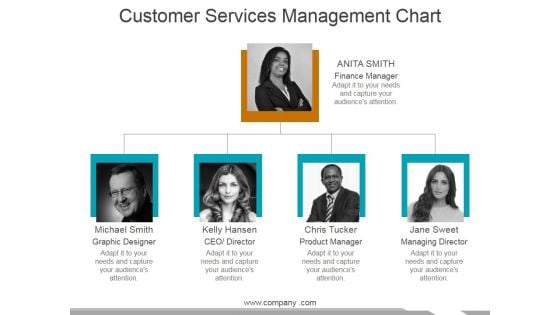
Customer Services Management Chart Ppt PowerPoint Presentation Show Slides
This is a customer services management chart ppt powerpoint presentation show slides. This is a two stage process. The stages in this process are finance manager, graphic designer, ceo director, product manager.
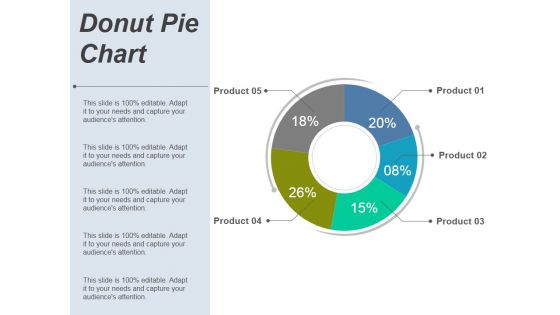
Donut Pie Chart Ppt PowerPoint Presentation Infographic Template Layout Ideas
This is a donut pie chart ppt powerpoint presentation infographic template layout ideas. This is a five stage process. The stages in this process are product, business, finance, marketing.
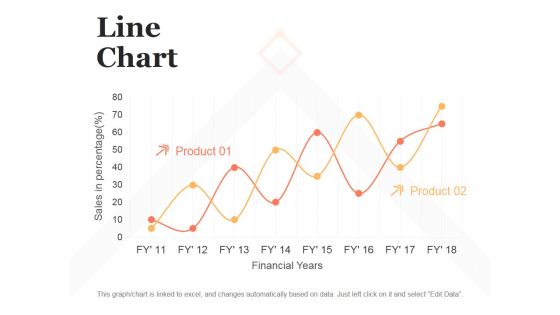
Line Chart Ppt PowerPoint Presentation Model Design Templates
This is a line chart ppt powerpoint presentation model design templates. This is a two stage process. The stages in this process are sales in percentage, financial years, product.
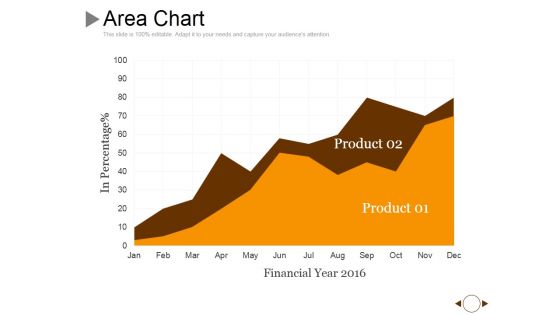
Area Chart Ppt PowerPoint Presentation Show Layout Ideas
This is a area chart ppt powerpoint presentation show layout ideas. This is a two stage process. The stages in this process are product, in percentage, financial year, growth.
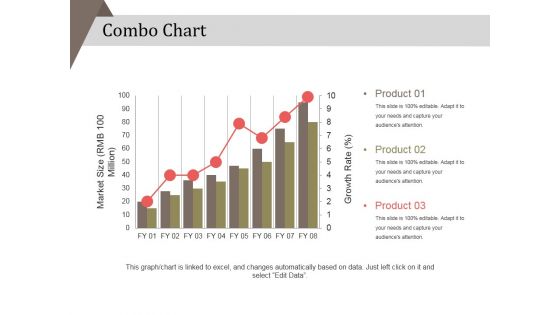
Combo Chart Ppt PowerPoint Presentation Infographic Template Brochure
This is a combo chart ppt powerpoint presentation infographic template brochure. This is a eight stage process. The stages in this process are product, market size, strategy, business, marketing.
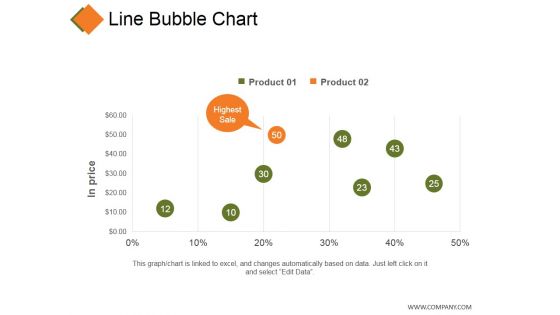
Line Bubble Chart Ppt PowerPoint Presentation Professional Infographic Template
This is a line bubble chart ppt powerpoint presentation professional infographic template. This is a five stage process. The stages in this process are product, in price, highest sale, business, finance.


 Continue with Email

 Home
Home


