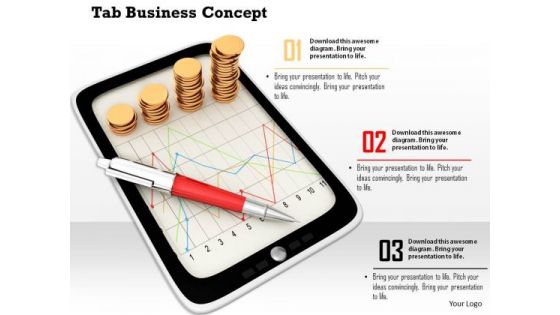
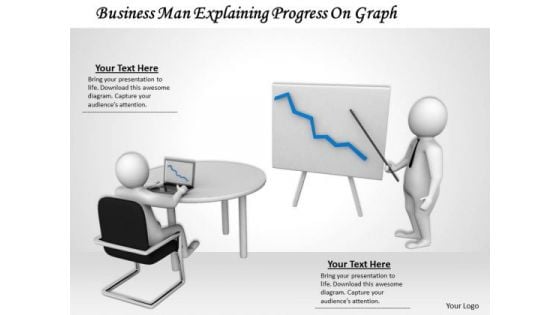
Graph
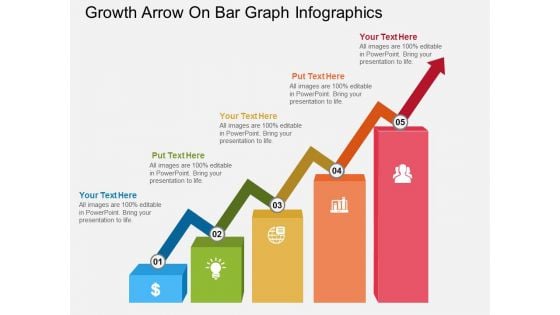
Growth Arrow On Bar Graph Infographics Powerpoint Template
This PowerPoint template has been designed with growth arrow on bar graph. You may download this diagram slide to display growth and progress concepts. Illustrate your plans to your listeners with this impressive template.
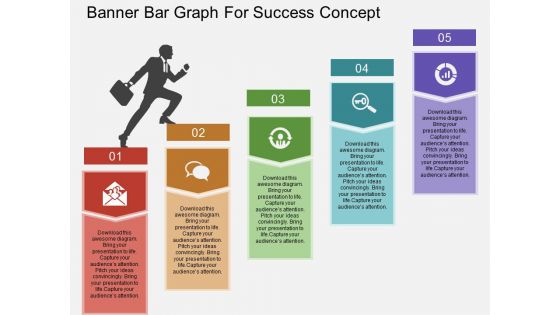
Banner Bar Graph For Success Concept Powerpoint Template
Concepts of success and progress have been displayed in this power point template diagram. This PPT diagram contains the graphic of business man on bar graph. Use this PPT diagram for business and success related presentations.
Four Pencils Bar Graph And Icons Powerpoint Template
Develop competitive advantage with our above template which contains a diagram of five pencils bar graph. This diagram provides an effective way of displaying business information. You can edit text, color, shade and style as per you need.
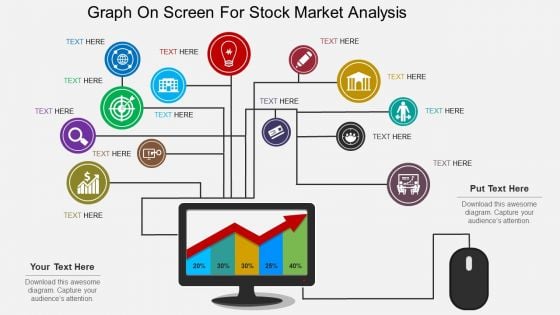
Graph On Screen For Stock Market Analysis Powerpoint Template
This PowerPoint slide contains computer screen with business graph. This professional slide may be used for visual explanation of data. Adjust the above diagram in your business presentations to give professional impact.
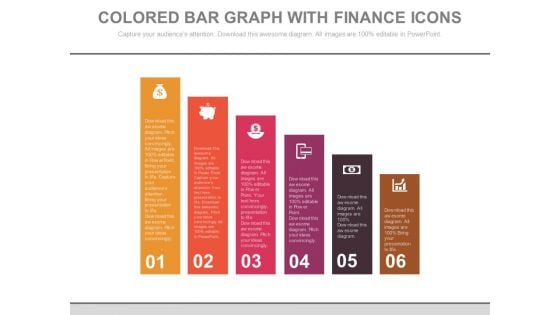
Bar Graph For Marketing Research Data Powerpoint Slides
This PowerPoint template has been designed with diagram of bar graph. This PPT slide can be used to prepare presentations for profit growth report and also for financial data analysis. You can download finance PowerPoint template to prepare awesome presentations.
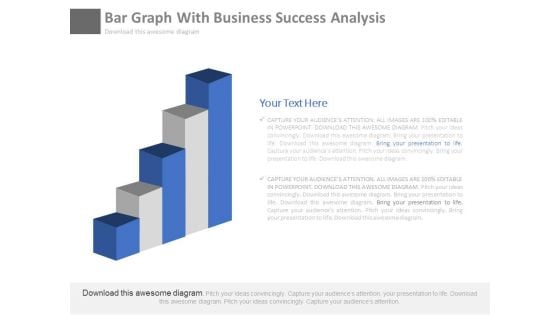
Bar Graph For Marketing Research Process Powerpoint Slides
This PowerPoint template has been designed with diagram of bar graph. This PPT slide can be used to prepare presentations for profit growth report and also for financial data analysis. You can download finance PowerPoint template to prepare awesome presentations.
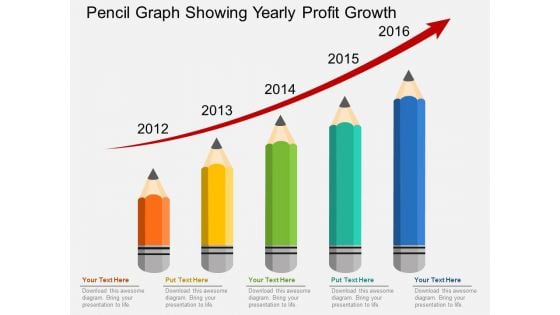
Pencil Graph Showing Yearly Profit Growth Powerpoint Templates
This slide has been designed with diagram of pencil graph. This diagram is suitable to present yearly profit growth. This professional slide helps in making an instant impact on viewers.

Man Presenting Data With Business Graph Powerpoint Templates
Our above business slide contains graphic of man showing business graph. This slide may be used for market research study. Capture the attention of your audience with this slide.
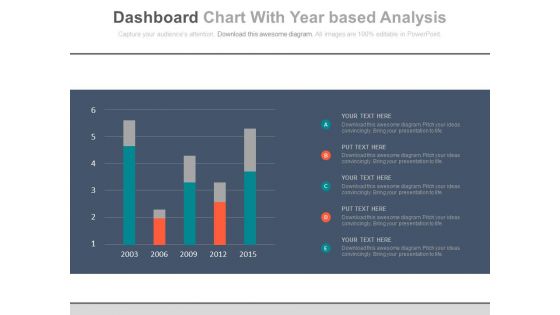
Bar Graph For Year Based Analysis Powerpoint Slides
This PowerPoint template has been designed with year based bar graph. This diagram may be used to display yearly statistical analysis. Use this PPT slide design to make impressive presentations.
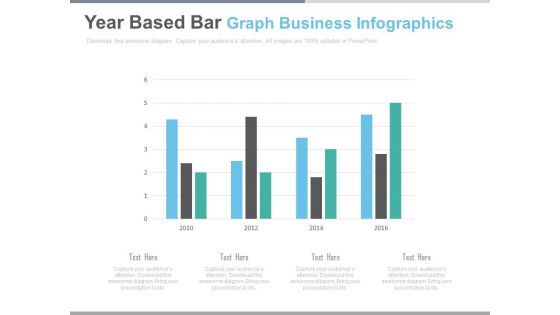
Bar Graph For Yearly Statistical Analysis Powerpoint Slides
This PowerPoint template has been designed with bar graph. This PowerPoint diagram is useful to exhibit yearly statistical analysis. This diagram slide can be used to make impressive presentations.
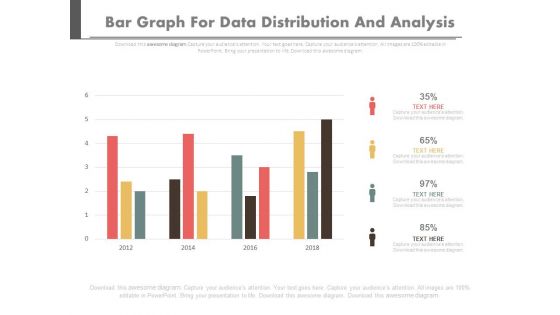
Bar Graph For Data Distribution And Analysis Powerpoint Slides
This PowerPoint template has been designed with bar graph. This PowerPoint diagram is useful for data distribution and analysis This diagram slide can be used to make impressive presentations.
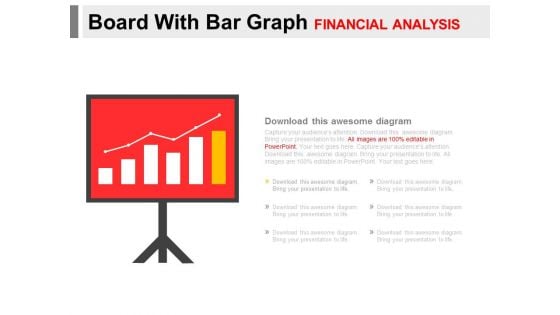
Board With Bar Graph For Financial Analysis Powerpoint Slides
You can download this PowerPoint template to display statistical data and analysis. This PPT slide contains display board with bar graph. Draw an innovative business idea using this professional diagram.
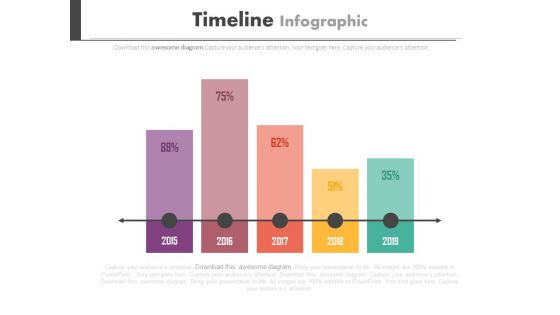
Timeline Bar Graph For Yearly Planning Powerpoint Slides
This PowerPoint template has been designed with timeline bar graph. You may download this timeline diagram slide to display long term planning for business. Chart the course you intend to take with this slide.

News Paper With Graph And Example Text Powerpoint Slides
This PowerPoint template has been designed with newspaper layout and graph. This PPT slide may be used to display concepts like information, business news and communication. Develop your marketing strategy by using this PPT slide.
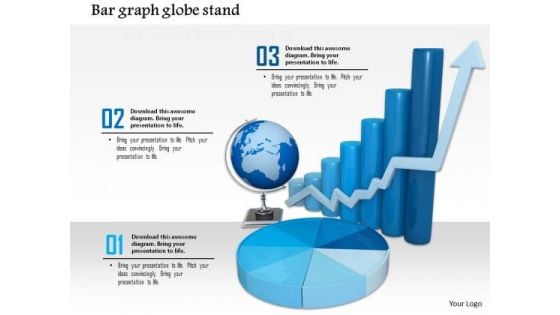
Stock Photo Globe With Bar Graph For Business PowerPoint Slide
This image slide displays globe with bar graph. This image has been designed with graphic of bar graph, pie char, globe and growth arrow. Use this image slide, in your presentations to express views on finance, global growth and success. This image slide may also be used to exhibit any information which requires visual presentation in your presentations. This image slide will enhance the quality of your presentations.
Stock Photo Chairs Around Table With Bar Graph PowerPoint Slide
The above image shows unique design of chairs around table with bar graph. This professional image of designed to portray concept of business meeting on facts and figures. Employ the right colors for your brilliant ideas. Help your viewers automatically empathize with your thoughts.
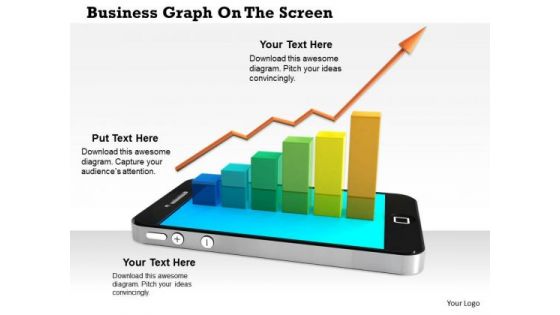
Stock Photo Arrow Growth Bar Graph On Phone Pwerpoint Slide
This graphic image has been designed with graphic of smart phone with growth bar graph. This image contains the concept of business growth analysis. Use this image for business and marketing related analysis presentations. Display finance growth analysis in an graphical way with this exclusive image.

Modern Marketing Concepts 3d Man Bar Graph Business Statement
Rake In The Dough With
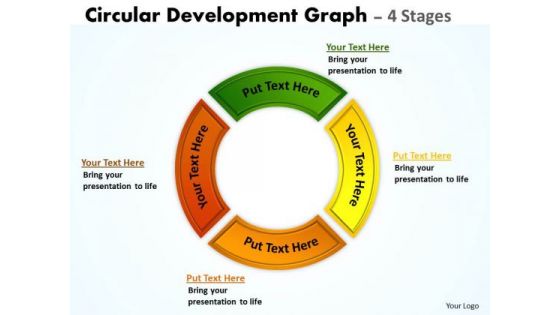
Strategic Management Circular Development Graph 4 Stages Sales Diagram
Our Strategic_Management_Circular_Development_Graph_4_Stages_Sales_Diagram Powerpoint Templates And Your Ideas Make A Great Doubles Pair. Play The Net With Assured Hands.
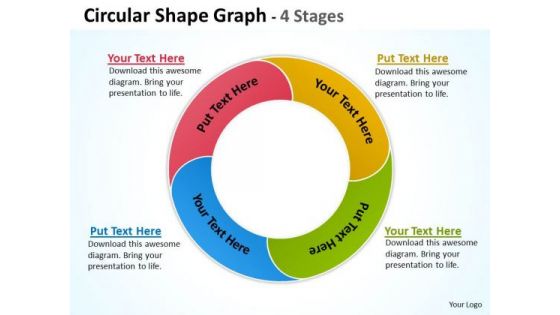
Strategic Management Circular Shape Graph 4 Stages Business Diagram
Brace Yourself, Arm Your Thoughts. Prepare For The Hustle With Our Strategic_Management_Circular_Shape_Graph_4_Stages_Business_Diagram Powerpoint Templates.
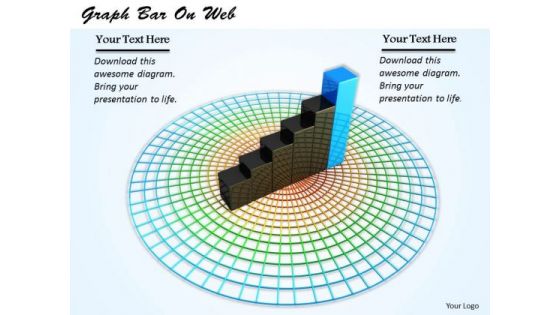
Stock Photo Bar Graph On Circular Web PowerPoint Slide
This image slide displays bar garph on circular web. This image slide helps you to make business and sales related presenations. Deliver amazing presentations to mesmerize your audience.

Stock Photo Graph Of Growing Green Grass PowerPoint Slide
The above slide shows conecptual image of business growth. This image is designed with graphics of grass. You can downoad this image for business presenations and also for environmental presenations.

Stock Photo Growth Graph With Dollar Symbol PowerPoint Slide
This image is a useful tool that enable you to define your message in your business presentations. It portrays the concept of dollar growth. Add charm to your presentations with our attractive image slide.
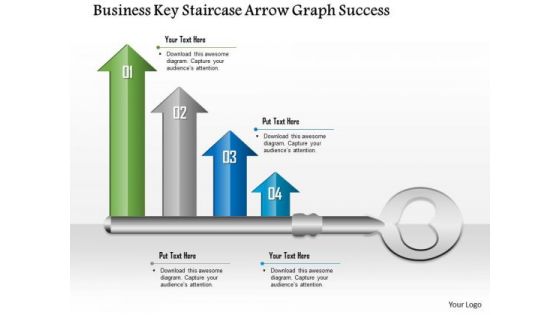
Business Diagram Business Key Staircase Arrow Graph Success Presentation Template
This slide contains numbers key stair case diagram. This PowerPoint template has been designed to depict order of steps. Display linear process flow for any business process with this exclusive diagram and attract your viewers.
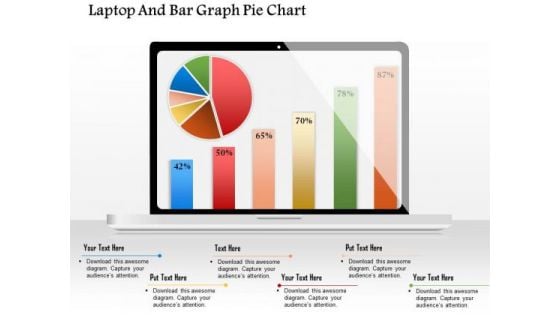
Business Diagram Laptop And Bar Graph Pie Chart Presentation Template
This Power Point template has been designed with graphic of target dart. This PPT diagram contains the concept of information communication. Use this PPT in your business communication related presentations.
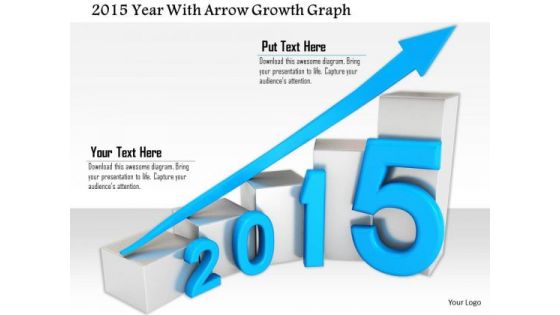
Stock Photo 2015 Year With Arrow Growth Graph PowerPoint Slide
This Power Point image template slide has been crafted with graphic of 2015 year text and arrow. This PPT slide contains the concept of business growth and success. Use this image template and get good remarks from your viewers.

Business Diagram Business Bar Graph For Data Analysis Presentation Template
This business slide displays pie charts with percentage ratios. This diagram is a data visualization tool that gives you a simple way to present statistical information. This slide helps your audience examines and interprets the data you present.
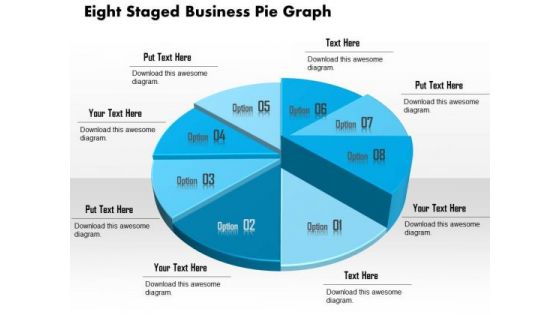
Business Diagram Eight Staged Business Pie Graph Presentation Template
This business slide displays eight staged pie chart. This diagram is a data visualization tool that gives you a simple way to present statistical information. This slide helps your audience examine and interpret the data you present.
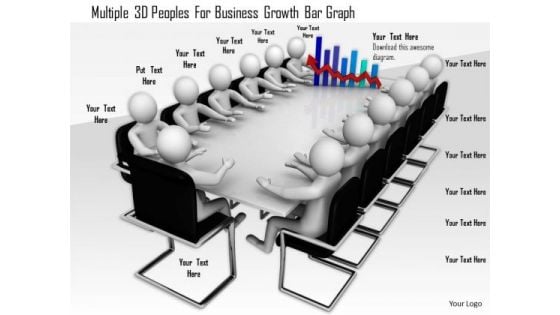
Multiple 3d Peoples For Business Growth Bar Graph
This image slide displays graphics of team meeting. This conceptual image depicts discussion on business facts and figures. Use this diagram slide to build presentation on business planning and teamwork related topics.

Stock Photo Golden Dollar Symbol With Pie Graph PowerPoint Slide
This Power Point template has been crafted with graphic of golden dollar symbol and pie chart on a tablet. Display the concept of financial data analysis with this image. Use this image to present financial reports in business presentations.
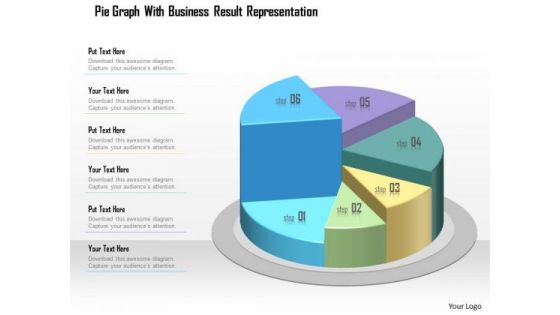
Business Diagram Pie Graph With Business Result Representation Presentation Template
This business diagram displays graphic of pie chart. This business slide contains the concept of business data representation. Use this diagram to build professional presentation for your viewers.
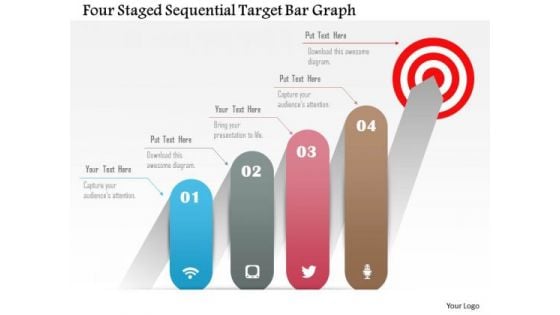
Business Diagram Four Staged Sequential Target Bar Graph Presentation Template
This business diagram has been designed with graphic of four steps towards target achievement. Use this diagram, in your presentations to express views on strategies, policies, success, achievements and opportunities. Create professional presentations using this diagram slide.
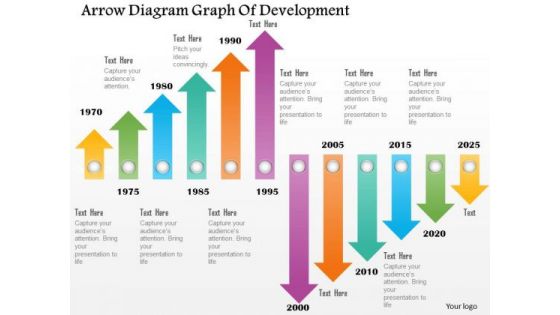
Business Diagram Arrow Diagram Graph Of Development Presentation Template
This power point template has been designed with graphic of arrow diagram. This PPT contains the concept of growth and development. Use this PPT for business and management related presentations.
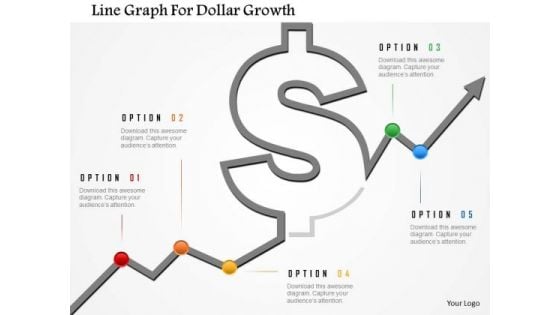
Business Diagram Line Graph For Dollar Growth Presentation Template
Graphic of dollar symbol and growth arrow has been used to design this power point template. This diagram contains the concept of financial result analysis. Use this business diagram for finance related presentations
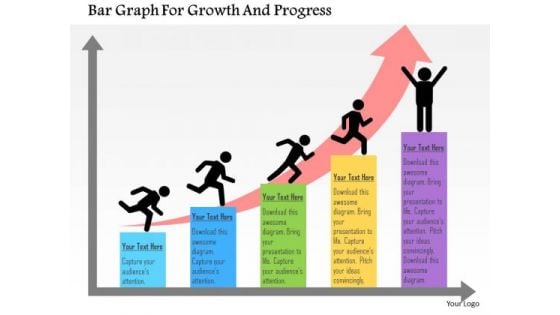
Business Diagram Bar Graph For Growth And Progress Presentation Template
This business slide has been designed with graphics of bar chart. You may download this diagram to display concepts like growth, progress and success in business. Download this diagram slide to make impressive presentations.
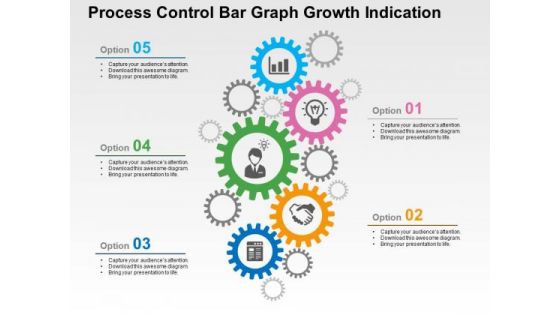
Process Control Bar Graph Growth Indication PowerPoint Template
Download our business slide with gear graphics to convincingly convey your important ideas in presentations. It also contains graphics of business icons. Create captivating presentations using this template
Infographics With News Mail Microscope Bar Graph Icons Powerpoint Templates
This PowerPoint template has been designed with infographic square. Download this PPT slide to display information in visual manner. Use this diagram to build an exclusive presentation.
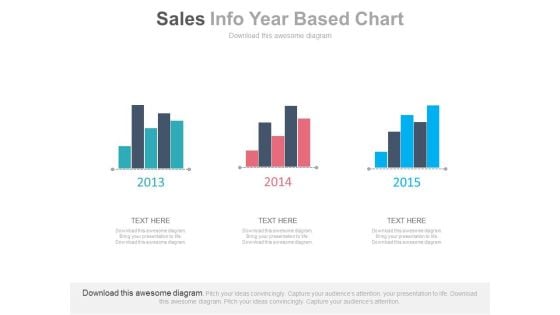
Three Years Sales Data Bar Graph Powerpoint Slides
This PowerPoint template has been designed with bar charts. This business slide may be used to display three years sales data for comparison. Present your views and ideas with this impressive design.
Four Options With Gears Mike And Graph Icons Powerpoint Templates
Visually support your presentation with our above template illustrating four options infographic. You may use this diagram to exhibit growth measurement. Convey your views with this business diagram slide.
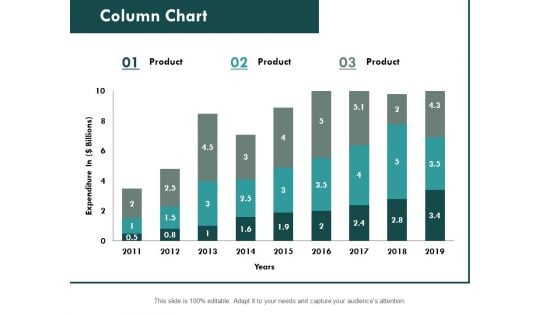
Column Chart Graph Ppt PowerPoint Presentation Slides File Formats
This is a combo chart bar ppt powerpoint presentation slides portfolio. This is a three stage process. The stages in this process are finance, marketing, analysis, investment, million.
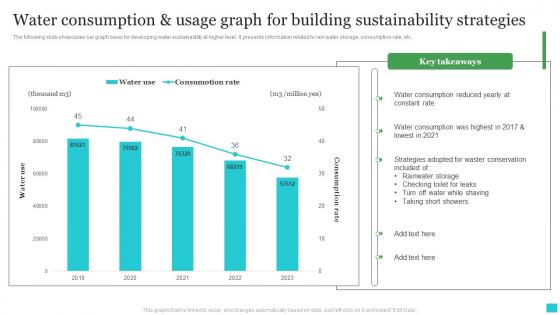
Water Consumption And Usage Graph For Building Sustainability Strategies Ideas Pdf
The following slide showcases bar graph basis for developing water sustainability at higher level. It presents information related to rain water storage, consumption rate, etc. Pitch your topic with ease and precision using this Water Consumption And Usage Graph For Building Sustainability Strategies Ideas Pdf. This layout presents information on Water Consumption, Constant Rate, Rainwater Storage. It is also available for immediate download and adjustment. So, changes can be made in the color, design, graphics or any other component to create a unique layout. The following slide showcases bar graph basis for developing water sustainability at higher level. It presents information related to rain water storage, consumption rate, etc.
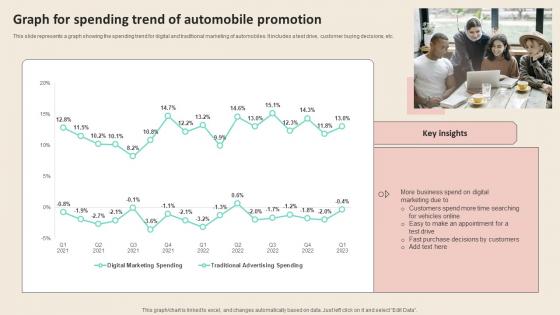
Graph For Spending Trend Of Automobile Promotional Strategies To Increase Download PDF
This slide represents a graph showing the spending trend for digital and traditional marketing of automobiles. It includes a test drive, customer buying decisions, etc. Whether you have daily or monthly meetings, a brilliant presentation is necessary. Graph For Spending Trend Of Automobile Promotional Strategies To Increase Download PDF can be your best option for delivering a presentation. Represent everything in detail using Graph For Spending Trend Of Automobile Promotional Strategies To Increase Download PDF and make yourself stand out in meetings. The template is versatile and follows a structure that will cater to your requirements. All the templates prepared by Slidegeeks are easy to download and edit. Our research experts have taken care of the corporate themes as well. So, give it a try and see the results. This slide represents a graph showing the spending trend for digital and traditional marketing of automobiles. It includes a test drive, customer buying decisions, etc.
Financial Graph Economic Growth Vector Icon Ppt PowerPoint Presentation Infographics Graphic Images Cpb
This is a financial graph economic growth vector icon ppt powerpoint presentation infographics graphic images cpb. This is a three stage process. The stages in this process are bar chart icon, bar graph icon, data chart icon.
Growing Arrow On Bar Graph Vector Icon Ppt PowerPoint Presentation Designs Cpb
This is a growing arrow on bar graph vector icon ppt powerpoint presentation designs cpb . This is a three stage process. The stages in this process are bar chart icon, bar graph icon, data chart icon.

Microsoft Corporations Revenue Growth Graph Microsoft Long Term Business Professional PDF
This slide represents graph which ca be used to calculate the revenue growth of Microsoft in last twenty years. Microsofts revenue has been growing continuously over the past 5 years since. Presenting this PowerPoint presentation, titled Microsoft Corporations Revenue Growth Graph Microsoft Long Term Business Professional PDF, with topics curated by our researchers after extensive research. This editable presentation is available for immediate download and provides attractive features when used. Download now and captivate your audience. Presenting this Microsoft Corporations Revenue Growth Graph Microsoft Long Term Business Professional PDF. Our researchers have carefully researched and created these slides with all aspects taken into consideration. This is a completely customizable Microsoft Corporations Revenue Growth Graph Microsoft Long Term Business Professional PDF that is available for immediate downloading. Download now and make an impact on your audience. Highlight the attractive features available with our PPTs. This slide represents graph which ca be used to calculate the revenue growth of Microsoft in last twenty years. Microsofts revenue has been growing continuously over the past 5 years since.

Microsoft Corporations Revenue Growth Graph Strategic Advancements By Microsofts Diagrams Pdf
This slide represents graph which ca be used to calculate the revenue growth of Microsoft in last twenty years. Microsofts revenue has been growing continuously over the past 5 years since. Presenting this PowerPoint presentation, titled Microsoft Corporations Revenue Growth Graph Strategic Advancements By Microsofts Diagrams Pdf, with topics curated by our researchers after extensive research. This editable presentation is available for immediate download and provides attractive features when used. Download now and captivate your audience. Presenting this Microsoft Corporations Revenue Growth Graph Strategic Advancements By Microsofts Diagrams Pdf. Our researchers have carefully researched and created these slides with all aspects taken into consideration. This is a completely customizable Microsoft Corporations Revenue Growth Graph Strategic Advancements By Microsofts Diagrams Pdf that is available for immediate downloading. Download now and make an impact on your audience. Highlight the attractive features available with our PPTs. This slide represents graph which ca be used to calculate the revenue growth of Microsoft in last twenty years. Microsofts revenue has been growing continuously over the past 5 years since.
Pie Graph Icon Circle Charts PowerPoint Templates And PowerPoint Themes 0612
Pie Graph Icon Circle Charts PowerPoint Templates And PowerPoint Themes Business-Microsoft Powerpoint Templates and Background with pie chart icon Enhance feasibility with our Pie Graph Icon Circle Charts PowerPoint Templates And PowerPoint Themes 0612. Exhort your team to eventual success.
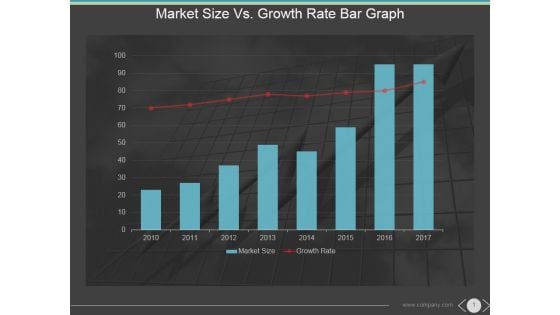
Market Size Vs Growth Rate Bar Graph Ppt PowerPoint Presentation Themes
This is a market size vs growth rate bar graph ppt powerpoint presentation themes. This is a eight stage process. The stages in this process are market size, growth rate, years, future, graph.
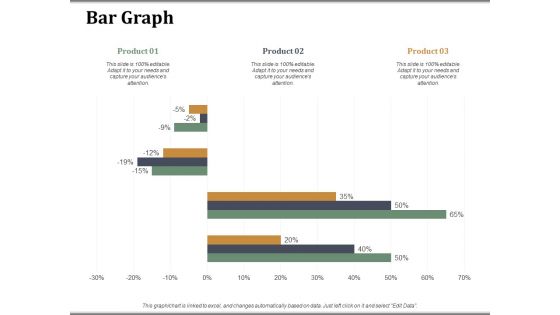
Bar Graph Companys Business Model Canvas Ppt PowerPoint Presentation Visual Aids Model
This is a bar graph companys business model canvas ppt powerpoint presentation visual aids model. This is a three stage process. The stages in this process are bar graph, finance, marketing, strategy, analysis, business.

Graph Model Showing Relation Between Objects Ppt PowerPoint Presentation Summary Graphics Tutorials
This is a graph model showing relation between objects ppt powerpoint presentation summary graphics tutorials. This is a two stage process. The stages in this process are graph theory, chart theory, business.
Graph Pattern For Network Analysis Ppt PowerPoint Presentation Infographics Graphics Template
This is a graph pattern for network analysis ppt powerpoint presentation infographics graphics template. This is a two stage process. The stages in this process are graph theory, chart theory, business.
Interconnect Graph Layout With Icons And Text Holders Ppt PowerPoint Presentation Inspiration Example Introduction
This is a interconnect graph layout with icons and text holders ppt powerpoint presentation inspiration example introduction. This is a three stage process. The stages in this process are graph theory, chart theory, business.
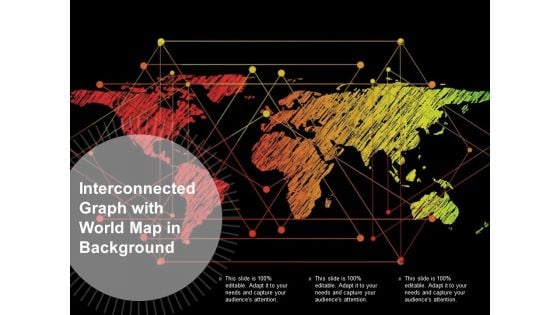
Interconnected Graph With World Map In Background Ppt PowerPoint Presentation Infographics Slide
This is a interconnected graph with world map in background ppt powerpoint presentation infographics slide. This is a three stage process. The stages in this process are graph theory, chart theory, business.
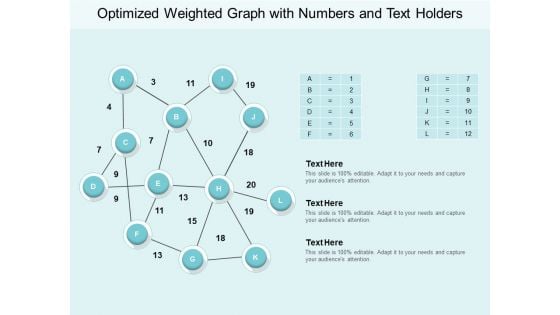
Optimized Weighted Graph With Numbers And Text Holders Ppt PowerPoint Presentation Outline Picture
This is a optimized weighted graph with numbers and text holders ppt powerpoint presentation outline picture. This is a three stage process. The stages in this process are graph theory, chart theory, business.
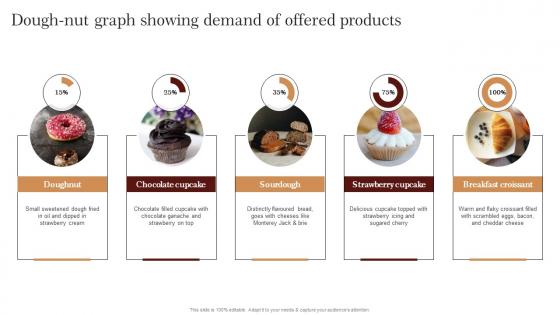
Dough Nut Graph Showing Demand Of Strategic Advertising Plan For Bakehouse Structure Pdf
Get a simple yet stunning designed Dough Nut Graph Showing Demand Of Strategic Advertising Plan For Bakehouse Structure Pdf. It is the best one to establish the tone in your meetings. It is an excellent way to make your presentations highly effective. So, download this PPT today from Slidegeeks and see the positive impacts. Our easy to edit Dough Nut Graph Showing Demand Of Strategic Advertising Plan For Bakehouse Structure Pdf can be your go to option for all upcoming conferences and meetings. So, what are you waiting for Grab this template today. Our Dough Nut Graph Showing Demand Of Strategic Advertising Plan For Bakehouse Structure Pdf are topically designed to provide an attractive backdrop to any subject. Use them to look like a presentation pro.
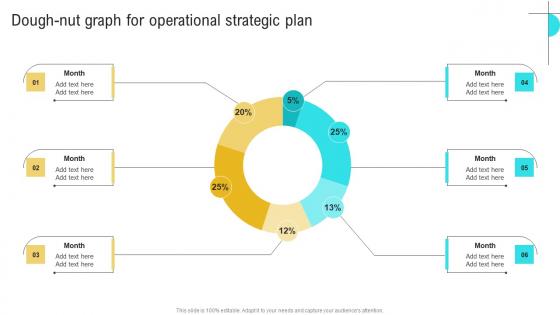
Dough Nut Graph For Operational Business Performance Optimization New Operations Strategy Brochure Pdf
If you are looking for a format to display your unique thoughts, then the professionally designed Dough Nut Graph For Operational Business Performance Optimization New Operations Strategy Brochure Pdf is the one for you. You can use it as a Google Slides template or a PowerPoint template. Incorporate impressive visuals, symbols, images, and other charts. Modify or reorganize the text boxes as you desire. Experiment with shade schemes and font pairings. Alter, share or cooperate with other people on your work. Download Dough Nut Graph For Operational Business Performance Optimization New Operations Strategy Brochure Pdf and find out how to give a successful presentation. Present a perfect display to your team and make your presentation unforgettable. Our Dough Nut Graph For Operational Business Performance Optimization New Operations Strategy Brochure Pdf are topically designed to provide an attractive backdrop to any subject. Use them to look like a presentation pro.
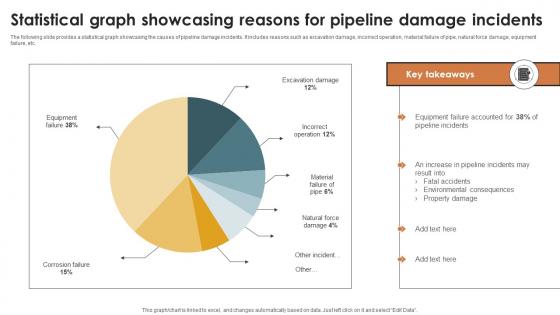
IoT Solutions For Oil Statistical Graph Showcasing Reasons For Pipeline IoT SS V
The following slide provides a statistical graph showcasing the causes of pipeline damage incidents. It includes reasons such as excavation damage, incorrect operation, material failure of pipe, natural force damage, equipment failure, etc. Want to ace your presentation in front of a live audience Our IoT Solutions For Oil Statistical Graph Showcasing Reasons For Pipeline IoT SS V can help you do that by engaging all the users towards you. Slidegeeks experts have put their efforts and expertise into creating these impeccable powerpoint presentations so that you can communicate your ideas clearly. Moreover, all the templates are customizable, and easy-to-edit and downloadable. Use these for both personal and commercial use. The following slide provides a statistical graph showcasing the causes of pipeline damage incidents. It includes reasons such as excavation damage, incorrect operation, material failure of pipe, natural force damage, equipment failure, etc.
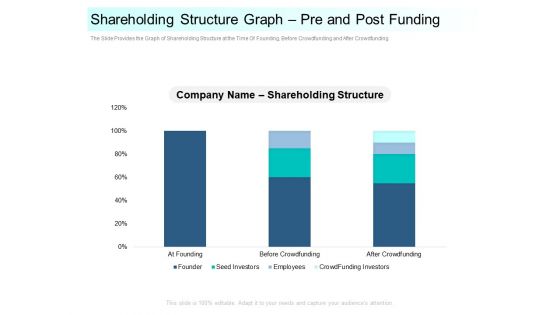
Community Capitalization Pitch Deck Shareholding Structure Graph Pre And Post Funding Template Pdf
The Slide Provides the Graph of Shareholding Structure at the Time Of Founding, Before Crowdfunding and After Crowdfunding. Deliver an awe inspiring pitch with this creative community capitalization pitch deck shareholding structure graph pre and post funding template pdf bundle. Topics like shareholding structure graph pre and post funding can be discussed with this completely editable template. It is available for immediate download depending on the needs and requirements of the user.


 Continue with Email

 Home
Home


