Graph
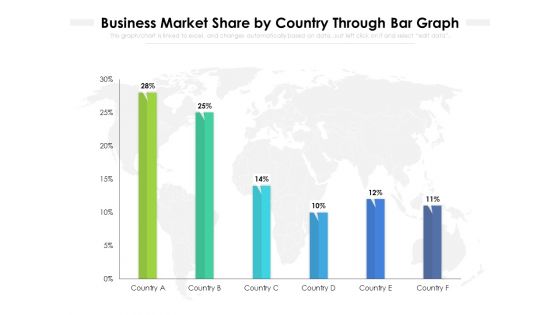
Business Market Share By Country Through Bar Graph Ppt PowerPoint Presentation Gallery Show PDF
Showcasing this set of slides titled business market share by country through bar graph ppt powerpoint presentation gallery show pdf. The topics addressed in these templates are business market share by country through bar graph. All the content presented in this PPT design is completely editable. Download it and make adjustments in color, background, font etc. as per your unique business setting.
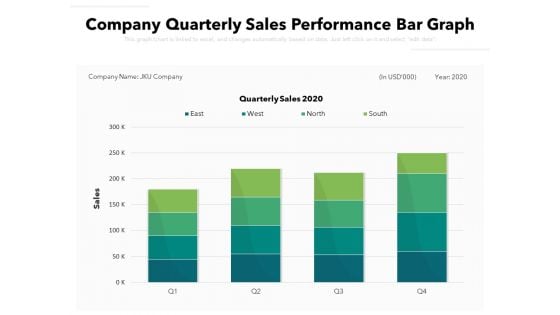
Company Quarterly Sales Performance Bar Graph Ppt PowerPoint Presentation File Templates PDF
Pitch your topic with ease and precision using this company quarterly sales performance bar graph ppt powerpoint presentation file templates pdf. This layout presents information on company quarterly sales performance bar graph. It is also available for immediate download and adjustment. So, changes can be made in the color, design, graphics or any other component to create a unique layout.
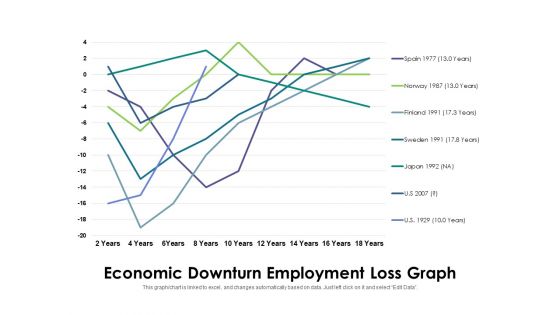
Economic Downturn Employment Loss Graph Ppt PowerPoint Presentation Outline Example File PDF
Pitch your topic with ease and precision using this economic downturn employment loss graph ppt powerpoint presentation outline example file pdf. This layout presents information on economic downturn employment loss graph. It is also available for immediate download and adjustment. So, changes can be made in the color, design, graphics or any other component to create a unique layout.
Monthly Company Product Sales Bar Graph Ppt PowerPoint Presentation Icon Model PDF
Showcasing this set of slides titled monthly company product sales bar graph ppt powerpoint presentation icon model pdf. The topics addressed in these templates are monthly company product sales bar graph. All the content presented in this PPT design is completely editable. Download it and make adjustments in color, background, font etc. as per your unique business setting.
Small And Medium Business Weekly Sales Bar Graph Ppt PowerPoint Presentation Icon Diagrams PDF
Showcasing this set of slides titled small and medium business weekly sales bar graph ppt powerpoint presentation icon diagrams pdf. The topics addressed in these templates are small and medium business weekly sales bar graph. All the content presented in this PPT design is completely editable. Download it and make adjustments in color, background, font etc. as per your unique business setting.
Bar Graph And Line Chart For Comparative Analysis Icon Ppt PowerPoint Presentation Gallery Infographics PDF
Showcasing this set of slides titled bar graph and line chart for comparative analysis icon ppt powerpoint presentation gallery infographics pdf. The topics addressed in these templates are bar graph and line chart for comparative analysis icon. All the content presented in this PPT design is completely editable. Download it and make adjustments in color, background, font etc. as per your unique business setting.
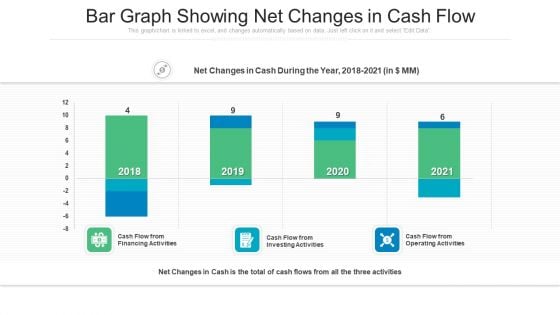
Bar Graph Showing Net Changes In Cash Flow Ppt PowerPoint Presentation Gallery Clipart Images PDF
Showcasing this set of slides titled bar graph showing net changes in cash flow ppt powerpoint presentation gallery clipart images pdf. The topics addressed in these templates are bar graph showing net changes in cash flow. All the content presented in this PPT design is completely editable. Download it and make adjustments in color, background, font etc. as per your unique business setting.
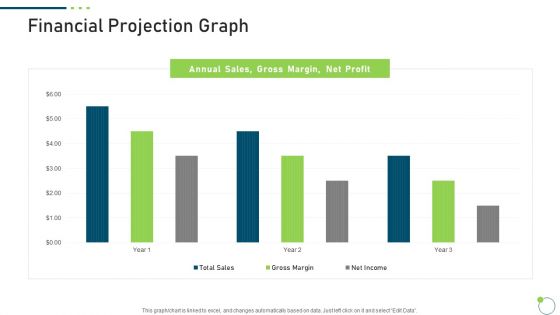
Investor Pitch Deck New Venture Capital Raising Financial Projection Graph Demonstration PDF
Deliver an awe inspiring pitch with this creative investor pitch deck new venture capital raising financial projection graph demonstration pdf bundle. Topics like financial projection graph can be discussed with this completely editable template. It is available for immediate download depending on the needs and requirements of the user.
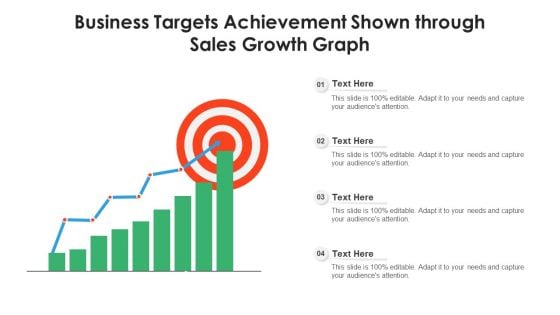
Business Targets Achievement Shown Through Sales Growth Graph Ppt PowerPoint Presentation Gallery Elements PDF
Pitch your topic with ease and precision using this business targets achievement shown through sales growth graph ppt powerpoint presentation gallery elements pdf. This layout presents information on business targets achievement shown through sales growth graph. It is also available for immediate download and adjustment. So, changes can be made in the color, design, graphics or any other component to create a unique layout.
Business Services Icon With Pie Graph And Dollar Sign Ppt Styles Good PDF
Pitch your topic with ease and precision using this business services icon with pie graph and dollar sign ppt styles good pdf. This layout presents information on business services icon with pie graph and dollar sign. It is also available for immediate download and adjustment. So, changes can be made in the color, design, graphics or any other component to create a unique layout.
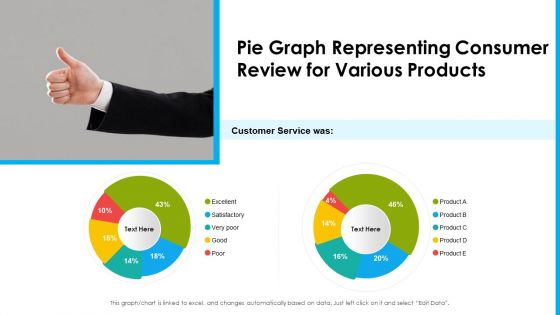
Pie Graph Representing Consumer Review For Various Products Ppt Summary Professional PDF
Showcasing this set of slides titled pie graph representing consumer review for various products ppt summary professional pdf. The topics addressed in these templates are pie graph representing consumer review for various products. All the content presented in this PPT design is completely editable. Download it and make adjustments in color, background, font etc. as per your unique business setting.
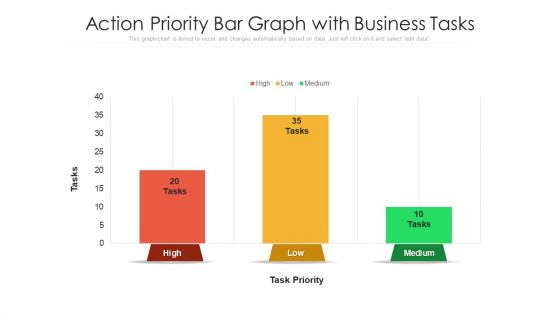
Action Priority Bar Graph With Business Tasks Ppt Layouts Graphics Download PDF
Showcasing this set of slides titled action priority bar graph with business tasks ppt layouts graphics download pdf. The topics addressed in these templates are action priority bar graph with business tasks. All the content presented in this PPT design is completely editable. Download it and make adjustments in color, background, font etc. as per your unique business setting.
3 Months Timeline Graph For Gross Lease Ppt PowerPoint Presentation Icon Model PDF
Showcasing this set of slides titled 3 months timeline graph for gross lease ppt powerpoint presentation icon model pdf. The topics addressed in these templates are 3 months timeline graph for gross lease. All the content presented in this PPT design is completely editable. Download it and make adjustments in color, background, font etc. as per your unique business setting.
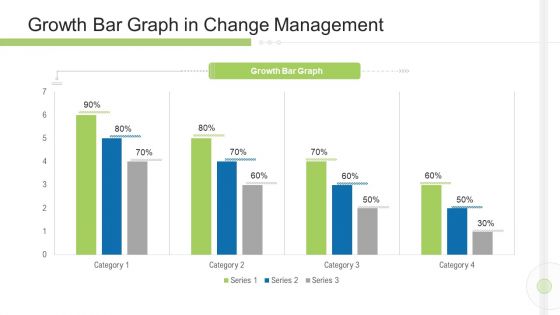
Execution Management In Business Growth Bar Graph In Change Management Graphics PDF
Deliver and pitch your topic in the best possible manner with this execution management in business growth bar graph in change management graphics pdf. Use them to share invaluable insights on growth bar graph in change management and impress your audience. This template can be altered and modified as per your expectations. So, grab it now.
Financial Graph For Urban Population Growth With Prediction Figures Icons PDF
Showcasing this set of slides titled financial graph for urban population growth with prediction figures icons pdf. The topics addressed in these templates are financial graph for urban population growth with prediction figures. All the content presented in this PPT design is completely editable. Download it and make adjustments in color, background, font etc. as per your unique business setting.
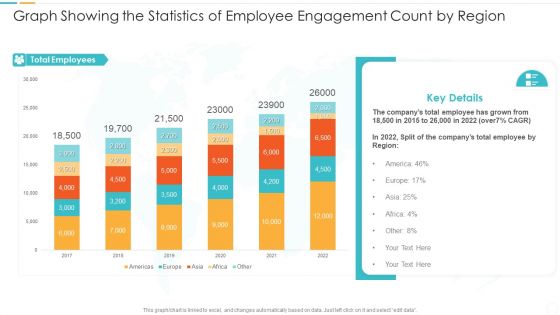
Graph Showing The Statistics Of Employee Engagement Count By Region Formats PDF
Pitch your topic with ease and precision using this graph showing the statistics of employee engagement count by region formats pdf. This layout presents information on graph showing the statistics of employee engagement count by region. It is also available for immediate download and adjustment. So, changes can be made in the color, design, graphics or any other component to create a unique layout.
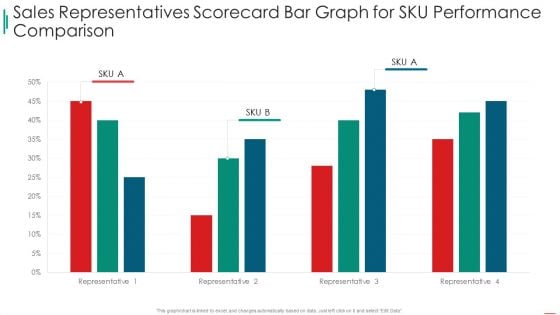
Sales Rep Scorecard Sales Representatives Scorecard Bar Graph For Sku Performance Comparison Clipart PDF
Deliver an awe inspiring pitch with this creative sales rep scorecard sales representatives scorecard bar graph for sku performance comparison clipart pdf bundle. Topics like sales representatives scorecard bar graph for sku performance comparison can be discussed with this completely editable template. It is available for immediate download depending on the needs and requirements of the user.
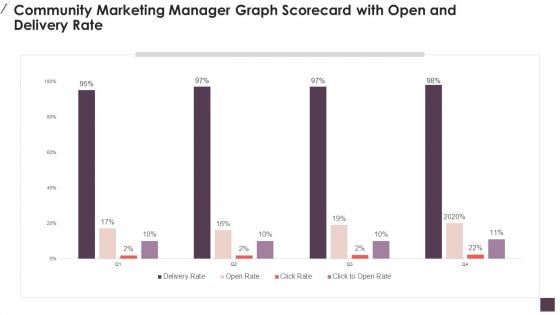
Community Marketing Manager Graph Scorecard With Open And Delivery Rate Designs PDF
Deliver and pitch your topic in the best possible manner with this Community Marketing Manager Graph Scorecard With Open And Delivery Rate Designs PDF Use them to share invaluable insights on Community Marketing, Manager Graph, Scorecard Delivery and impress your audience. This template can be altered and modified as per your expectations. So, grab it now.
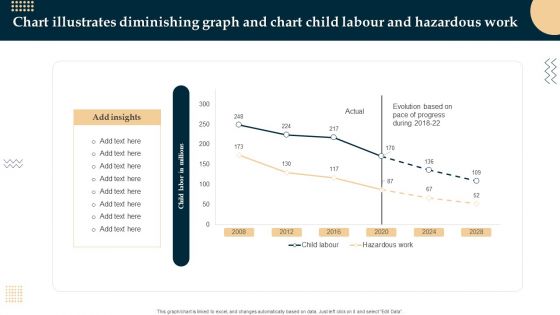
Chart Illustrates Diminishing Graph And Chart Child Labour And Hazardous Work Inspiration PDF
Showcasing this set of slides titled Chart Illustrates Diminishing Graph And Chart Child Labour And Hazardous Work Inspiration PDF. The topics addressed in these templates are Chart Illustrates Diminishing Graph, Hazardous Work, Chart Child Labour. All the content presented in this PPT design is completely editable. Download it and make adjustments in color, background, font etc. as per your unique business setting.
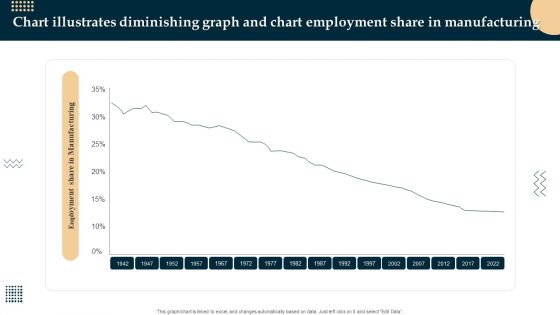
Chart Illustrates Diminishing Graph And Chart Employment Share In Manufacturing Diagrams PDF
Pitch your topic with ease and precision using this Chart Illustrates Diminishing Graph And Chart Employment Share In Manufacturing Diagrams PDF. This layout presents information on Chart Employment, Share In Manufacturing, Chart Illustrates Diminishing Graph. It is also available for immediate download and adjustment. So, changes can be made in the color, design, graphics or any other component to create a unique layout.

Chart Indicates Diminishing Graph And Chart Cash Payment Mode Inspiration PDF
Showcasing this set of slides titled Chart Indicates Diminishing Graph And Chart Cash Payment Mode Inspiration PDF. The topics addressed in these templates are Chart Indicates Diminishing Graph, Chart Cash Payment Mode. All the content presented in this PPT design is completely editable. Download it and make adjustments in color, background, font etc. as per your unique business setting.
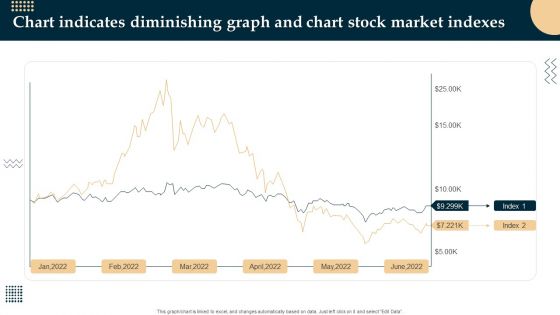
Chart Indicates Diminishing Graph And Chart Stock Market Indexes Themes PDF
Showcasing this set of slides titled Chart Indicates Diminishing Graph And Chart Stock Market Indexes Themes PDF. The topics addressed in these templates are Chart Indicates Diminishing Graph, Chart Stock Market Indexes. All the content presented in this PPT design is completely editable. Download it and make adjustments in color, background, font etc. as per your unique business setting.
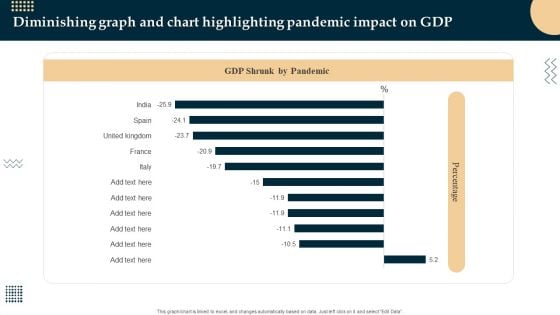
Diminishing Graph And Chart Highlighting Pandemic Impact On GDP Sample PDF
Pitch your topic with ease and precision using this Diminishing Graph And Chart Highlighting Pandemic Impact On GDP Sample PDF. This layout presents information on Diminishing Graph, Chart Highlighting Pandemic. It is also available for immediate download and adjustment. So, changes can be made in the color, design, graphics or any other component to create a unique layout.
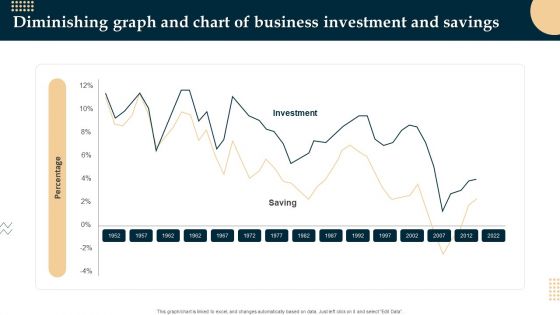
Diminishing Graph And Chart Of Business Investment And Savings Demonstration PDF
Showcasing this set of slides titled Diminishing Graph And Chart Of Business Investment And Savings Demonstration PDF. The topics addressed in these templates are Diminishing Graph, Chart Of Business Investment. All the content presented in this PPT design is completely editable. Download it and make adjustments in color, background, font etc. as per your unique business setting.
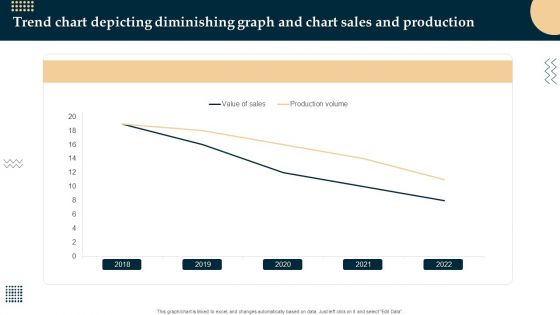
Trend Chart Depicting Diminishing Graph And Chart Sales And Production Structure PDF
Pitch your topic with ease and precision using this Trend Chart Depicting Diminishing Graph And Chart Sales And Production Structure PDF. This layout presents information on Trend Chart Depicting, Diminishing Graph, Chart Sales And Production. It is also available for immediate download and adjustment. So, changes can be made in the color, design, graphics or any other component to create a unique layout.

Chart Indicates Diminishing Graph And Chart Retail Value And Volume Download PDF
Pitch your topic with ease and precision using this Chart Indicates Diminishing Graph And Chart Retail Value And Volume Download PDF. This layout presents information on Chart Indicates Diminishing Graph, Chart Retail Value And Volume. It is also available for immediate download and adjustment. So, changes can be made in the color, design, graphics or any other component to create a unique layout.
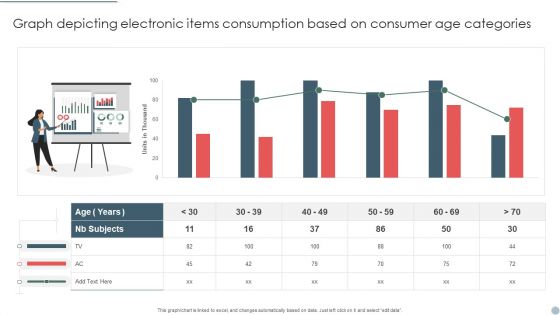
Graph Depicting Electronic Items Consumption Based On Consumer Age Categories Structure PDF
Showcasing this set of slides titled Graph Depicting Electronic Items Consumption Based On Consumer Age Categories Structure PDF. The topics addressed in these templates are Graph Depicting Electronic Items, Consumption Based On Consumer, Age Categories. All the content presented in this PPT design is completely editable. Download it and make adjustments in color, background, font etc. as per your unique business setting.
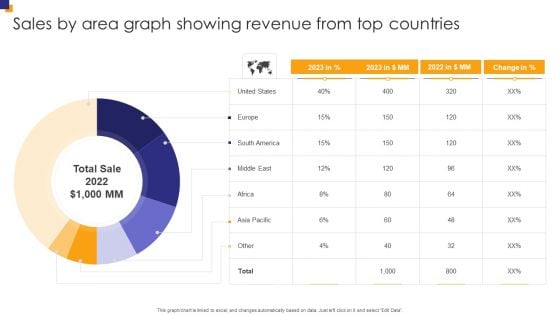
Sales By Area Graph Showing Revenue From Top Countries Inspiration PDF
Showcasing this set of slides titled Sales By Area Graph Showing Revenue From Top Countries Inspiration PDF. The topics addressed in these templates are Sales Area, Graph Showing, Revenue Countries. All the content presented in this PPT design is completely editable. Download it and make adjustments in color, background, font etc. as per your unique business setting.
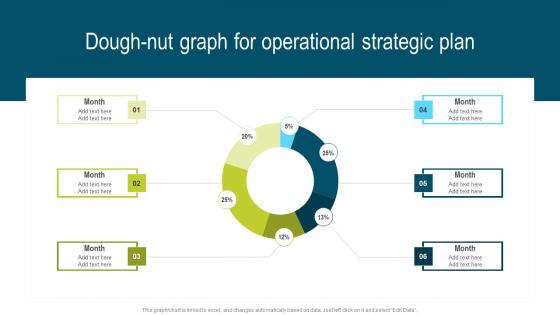
Dough Nut Graph For Operational Strategic Developing Extensive Plan For Operational Ideas Pdf
Are you in need of a template that can accommodate all of your creative concepts This one is crafted professionally and can be altered to fit any style. Use it with Google Slides or PowerPoint. Include striking photographs, symbols, depictions, and other visuals. Fill, move around, or remove text boxes as desired. Test out color palettes and font mixtures. Edit and save your work, or work with colleagues. Download Dough Nut Graph For Operational Strategic Developing Extensive Plan For Operational Ideas Pdf and observe how to make your presentation outstanding. Give an impeccable presentation to your group and make your presentation unforgettable. Our Dough Nut Graph For Operational Strategic Developing Extensive Plan For Operational Ideas Pdf are topically designed to provide an attractive backdrop to any subject. Use them to look like a presentation pro.
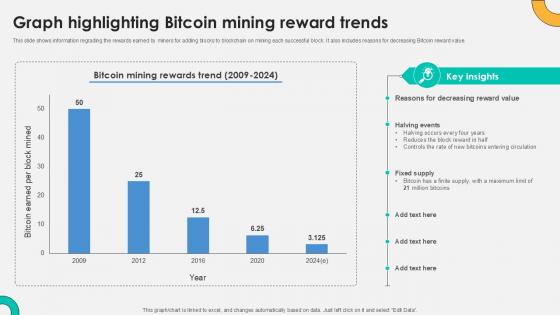
Graph Highlighting Bitcoin Mining Everything About Bitcoin PPT Example Fin SS V
This slide shows information regrading the rewards earned by miners for adding blocks to blockchain on mining each successful block. It also includes reasons for decreasing Bitcoin reward value. Explore a selection of the finest Graph Highlighting Bitcoin Mining Everything About Bitcoin PPT Example Fin SS V here. With a plethora of professionally designed and pre-made slide templates, you can quickly and easily find the right one for your upcoming presentation. You can use our Graph Highlighting Bitcoin Mining Everything About Bitcoin PPT Example Fin SS V to effectively convey your message to a wider audience. Slidegeeks has done a lot of research before preparing these presentation templates. The content can be personalized and the slides are highly editable. Grab templates today from Slidegeeks. This slide shows information regrading the rewards earned by miners for adding blocks to blockchain on mining each successful block. It also includes reasons for decreasing Bitcoin reward value.

Bar Graph With Dollar Finance PowerPoint Templates And PowerPoint Themes 0512
Microsoft Powerpoint Templates and Background with business graph success-Bar Graph With Dollar Finance PowerPoint Templates And PowerPoint Themes 0512-These PowerPoint designs and slide layouts can be used for themes relating to -Business graph, success, global, marketing, finance, sales With our Bar Graph With Dollar Finance PowerPoint Templates And PowerPoint Themes 0512 fear is never a factor. Do not allow adversity to effect you.
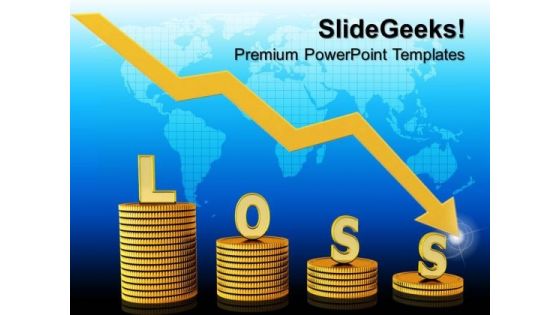
Loss In Money Graph Finance PowerPoint Templates And PowerPoint Themes 0812
Loss In Money Graph Finance PowerPoint Templates And PowerPoint Themes 0812-Microsoft Powerpoint Templates and Background with graph moving down and showing money loss Load up with our Loss In Money Graph Finance PowerPoint Templates And PowerPoint Themes 0812 with our Loss In Money Graph Finance PowerPoint Templates And PowerPoint Themes 0812. You will be at the top of your game.
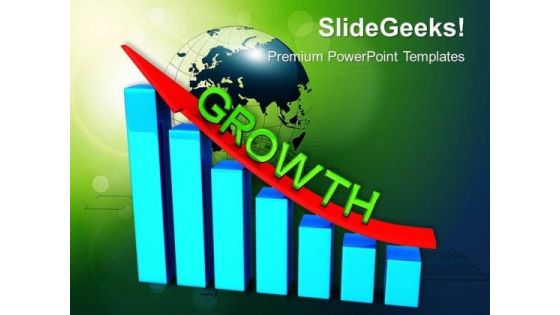
Business Bar Graph Upward Arrow Success PowerPoint Templates And PowerPoint Themes 0912
Business Bar Graph Upward Arrow Success PowerPoint Templates And PowerPoint Themes 0912-Microsoft Powerpoint Templates and Background with bar graph with upwards arrows-Bar graph with upwards arrows, success, money, arrows, finance, business Question doubts with our Business Bar Graph Upward Arrow Success PowerPoint Templates And PowerPoint Themes 0912. Download without worries with our money back guaranteee.

3d Man Draws Graph Success PowerPoint Templates And PowerPoint Themes 0912
3d Man Draws Graph Success PowerPoint Templates And PowerPoint Themes 0912-Microsoft Powerpoint Templates and Background with man drawing graph-Man drawing graph, people, business, arrows, success, signs Advocate your case with our 3d Man Draws Graph Success PowerPoint Templates And PowerPoint Themes 0912. They will deliver a strong defense.
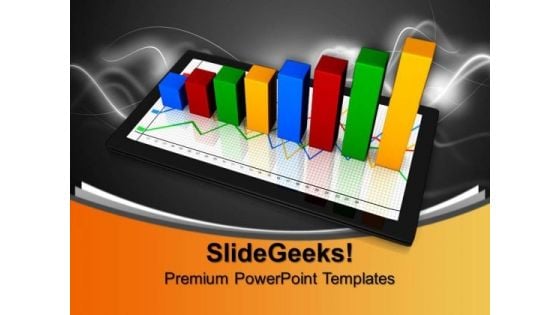
Computer Tablet With Success Growth Graph PowerPoint Templates And PowerPoint Themes 0912
Computer Tablet With Success Growth Graph PowerPoint Templates And PowerPoint Themes 0912-Microsoft Powerpoint Templates and Background with tablet with business growth graph-Tablet with business growth graph, technology, finance, success, business, computer Bid for it with our Computer Tablet With Success Growth Graph PowerPoint Templates And PowerPoint Themes 0912. Good returns will definitely ensue.
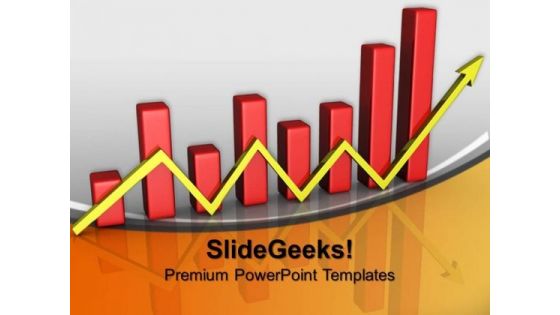
Finance Bar Graph With Arrow Business PowerPoint Templates And PowerPoint Themes 0912
Finance Bar Graph With Arrow Business PowerPoint Templates And PowerPoint Themes 0912-Microsoft Powerpoint Templates and Background with financial bar graph chart-Financial bar graph chart, business, arrows, marketing, finance, success End doubts with our Finance Bar Graph With Arrow Business PowerPoint Templates And PowerPoint Themes 0912. You will come out on top.
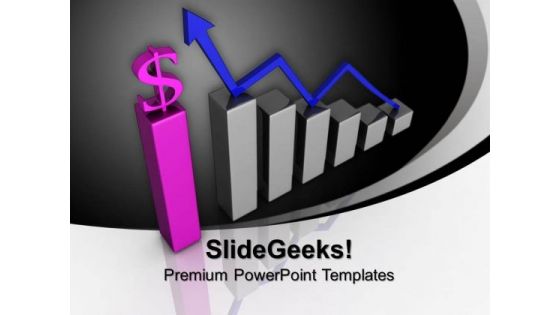
Increase In Dollar Graph Finance PowerPoint Templates And PowerPoint Themes 0912
Increase In Dollar Graph Finance PowerPoint Templates And PowerPoint Themes 0912-Microsoft Powerpoint Templates and Background with business graph with arrow showing profits-Business graph with arrow showing profits, signs, success, finance, business, arrows Encourage teams with our Increase In Dollar Graph Finance PowerPoint Templates And PowerPoint Themes 0912. Download without worries with our money back guaranteee.
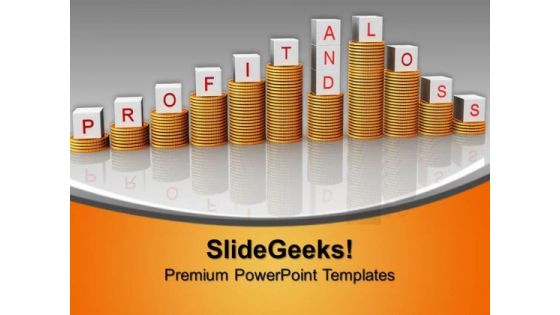
Profit And Loss Graph Concept Finance PowerPoint Templates And PowerPoint Themes 0912
Profit And Loss Graph Concept Finance PowerPoint Templates And PowerPoint Themes 0912-Microsoft Powerpoint Templates and Background with profit and loss graph-Profit and loss graph, business, finance, money, sales, marketing Father them through testing times. Bear the burden with our Profit And Loss Graph Concept Finance PowerPoint Templates And PowerPoint Themes 0912.
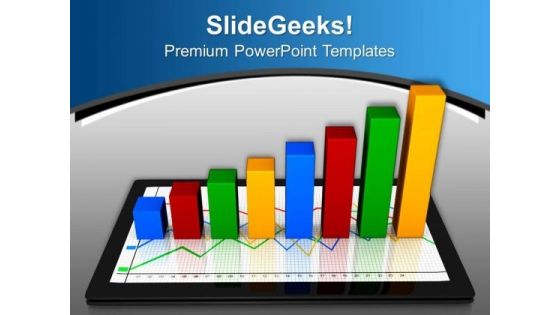
Tablet With Growth Graph Business PowerPoint Templates And PowerPoint Themes 0912
Tablet With Growth Graph Business PowerPoint Templates And PowerPoint Themes 0912-Microsoft Powerpoint Templates and Background with tablets with a bar graph-Tablets with a bar graph, business, technology, success, finance, marketing Our Tablet With Growth Graph Business PowerPoint Templates And PowerPoint Themes 0912 are evidently advantageous. The balance will tilt in your favour.
3d Pie Chart Graph And Dollar PowerPoint Templates And PowerPoint Themes 0912
3d Pie Chart Graph And Dollar PowerPoint Templates And PowerPoint Themes 0912-Microsoft Powerpoint Templates and Background with pie chart graph and dollar-Pie chart graph and dollar, business, signs, marketing, money, finance Connect the dots differently. Be daring with our 3d Pie Chart Graph And Dollar PowerPoint Templates And PowerPoint Themes 0912.

Pie Chart Graph Dollar Business PowerPoint Templates And PowerPoint Themes 0912
Pie Chart Graph Dollar Business PowerPoint Templates And PowerPoint Themes 0912-Microsoft Powerpoint Templates and Background with pie chart graph and dollar-Pie chart graph and dollar, business, signs, marketing, money, finance Fashion your plans on our Pie Chart Graph Dollar Business PowerPoint Templates And PowerPoint Themes 0912. They will always keep you in contention.
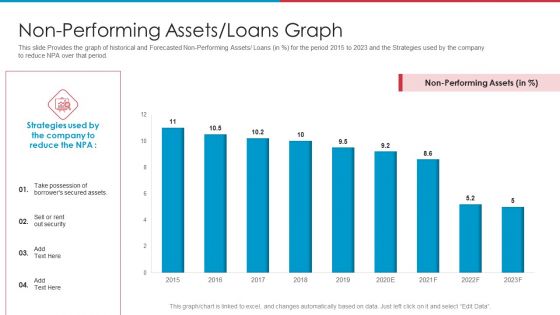
After IPO Equity Non Performing Assets Loans Graph Ppt Infographic Template Example Introduction PDF
This slide Provides the graph of historical and Forecasted Non-Performing Assets or Loans in percent for the period 2015 to 2023 and the Strategies used by the company to reduce NPA over that period. Deliver an awe-inspiring pitch with this creative after ipo equity non performing assets loans graph ppt infographic template example introduction pdf bundle. Topics like non performing assets or loans graph can be discussed with this completely editable template. It is available for immediate download depending on the needs and requirements of the user.
Skill Development Training To Strengthen Employee Performance Employee Efficiency Graph For The Five Years Icons PDF
This slide shows the five- year graph of average production per employee in tonne and employee efficiency in percentage along with the key insights. Deliver and pitch your topic in the best possible manner with this skill development training to strengthen employee performance employee efficiency graph for the five years icons pdf. Use them to share invaluable insights on employee efficiency graph for the five years and impress your audience. This template can be altered and modified as per your expectations. So, grab it now.
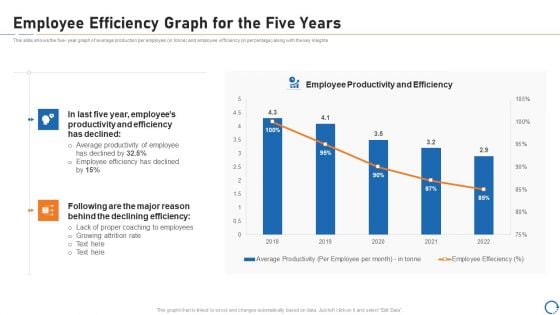
Upskill Training For Employee Performance Improvement Employee Efficiency Graph For The Five Years Summary PDF
This slide shows the five- year graph of average production per employee in tonne and employee efficiency in percentage along with the key insights. Deliver and pitch your topic in the best possible manner with this upskill training for employee performance improvement employee efficiency graph for the five years summary pdf. Use them to share invaluable insights on employee efficiency graph for the five years and impress your audience. This template can be altered and modified as per your expectations. So, grab it now.
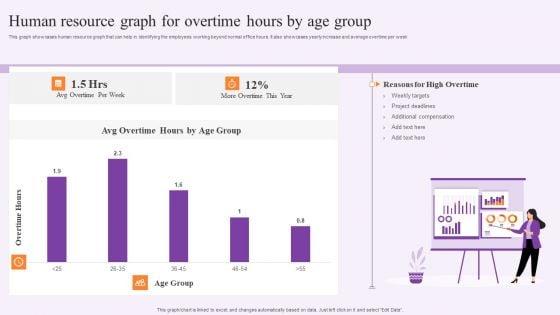
Human Resource Graph For Overtime Hours By Age Group Rules PDF
This graph showcases human resource graph that can help in identifying the employees working beyond normal office hours. It also showcases yearly increase and average overtime per week. Pitch your topic with ease and precision using this Human Resource Graph For Overtime Hours By Age Group Rules PDF. This layout presents information on Weekly Targets, Project Deadlines. It is also available for immediate download and adjustment. So, changes can be made in the color, design, graphics or any other component to create a unique layout.
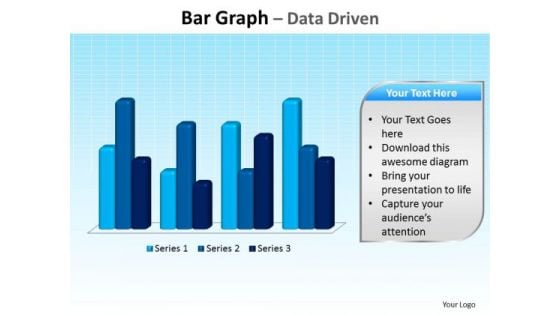
Business Education PowerPoint Templates Business Bar Graph Data Driven Ppt Slides
Business Education PowerPoint Templates Business bar graph data driven PPT Slides-This PowerPoint slide is a data driven Columns Chart. The number of columns depend on the data.-Business Editable PowerPoint Templates Business beveled column chart PPT Slides-This ppt can be used for concepts relating to-chart,, graph, growth, investment, , market, percentage, , presentation report, results, statistics, stock, success and business. Our Business Education PowerPoint Templates Business Bar Graph Data Driven Ppt Slides keep the faith alive. Belief in you will get stronger.
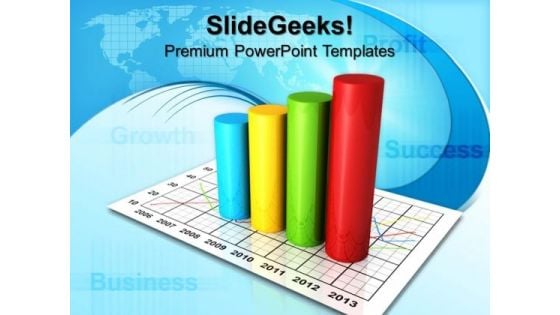
Business Circular Bar Graph Success PowerPoint Templates And PowerPoint Themes 0912
Business Circular Bar Graph Success PowerPoint Templates And PowerPoint Themes Presentations-Microsoft Powerpoint Templates and Background with circular business bar graph-Business Circular Bar Graph Success PowerPoint Templates And PowerPoint Themes PresentationsThis PPT can be used for presentations relating to-Circular business bar graph, cylinders, success, business, marketing, finance Design excellent slides with our Business Circular Bar Graph Success PowerPoint Templates And PowerPoint Themes 0912. Dont pass up this opportunity to shine.
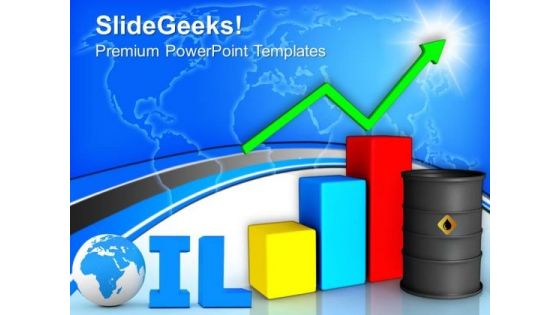
Oil Barrel With Up Arrow Graph Marketing PowerPoint Templates And PowerPoint Themes 0912
Oil Barrel With Up Arrow Graph Marketing PowerPoint Templates And PowerPoint Themes Presentations-Microsoft Powerpoint Templates and Background with oil barrels and chart graph with arrow-Oil Barrel With Up Arrow Graph Marketing PowerPoint Templates And PowerPoint Themes PresentationsThis PPT can be used for presentations relating to-Oil barrels and chart graph with arrow, business, marketing, finance, success, arrows Dazzle the audience with your thoughts. Our Oil Barrel With Up Arrow Graph Marketing PowerPoint Templates And PowerPoint Themes 0912 will leave them wide-eyed.
Dollar And Bar Graph Metaphor PowerPoint Templates And PowerPoint Themes 1012
Dollar And Bar Graph Metaphor PowerPoint Templates And PowerPoint Themes 1012-Microsoft Powerpoint Templates and Background with dollar and bar graph-Dollar And Bar Graph Metaphor PowerPoint Templates And PowerPoint Themes 1012-This PowerPoint template can be used for presentations relating to-Dollar and bar graph, money, signs, finance, business, success Drum up a fervour with our Dollar And Bar Graph Metaphor PowerPoint Templates And PowerPoint Themes 1012. You will come out on top.

Business Graph With Dollar Sign Marketing PowerPoint Templates And PowerPoint Themes 1012
Business Graph With Dollar Sign Marketing PowerPoint Templates And PowerPoint Themes 1012-Microsoft Powerpoint Templates and Background with bussiness graph with dollar sign-Business Graph With Dollar Sign Marketing PowerPoint Templates And PowerPoint Themes 1012-This PowerPoint template can be used for presentations relating to-Business graph with dollar sign, finance, business, success, signs, money Even out things with our Business Graph With Dollar Sign Marketing PowerPoint Templates And PowerPoint Themes 1012. Get your team on the same level.
E Business Graph Presentation Success Growth PowerPoint Templates And PowerPoint Themes 1012
E Business Graph Presentation Success Growth PowerPoint Templates And PowerPoint Themes 1012-Microsoft Powerpoint Templates and Background with business graph with arrow-E Business Graph Presentation Success Growth PowerPoint Templates And PowerPoint Themes 1012-This PowerPoint template can be used for presentations relating to-Business graph with arrow, technology, computer, business, success, arrows Embarrass your brother with our E Business Graph Presentation Success Growth PowerPoint Templates And PowerPoint Themes 1012. Just download, type and present.
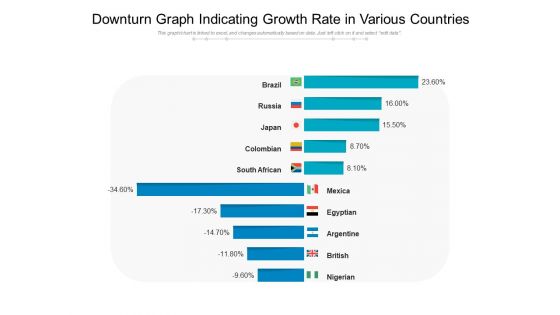
Downturn Graph Indicating Growth Rate In Various Countries Ppt PowerPoint Presentation Layouts Design Templates PDF
Pitch your topic with ease and precision using this downturn graph indicating growth rate in various countries ppt powerpoint presentation layouts design templates pdf. This layout presents information on downturn graph indicating growth rate in various countries. It is also available for immediate download and adjustment. So, changes can be made in the color, design, graphics or any other component to create a unique layout.
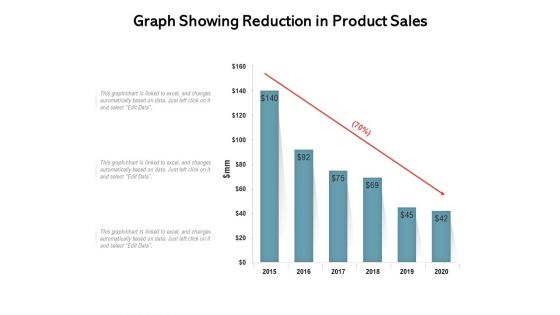
Graph Showing Reduction In Product Sales Ppt PowerPoint Presentation Infographic Template Graphics Design PDF
Pitch your topic with ease and precision using this graph showing reduction in product sales ppt powerpoint presentation infographic template graphics design pdf. This layout presents information on graph showing reduction in product sales, 2015 to 2020. It is also available for immediate download and adjustment. So, changes can be made in the color, design, graphics or any other component to create a unique layout.
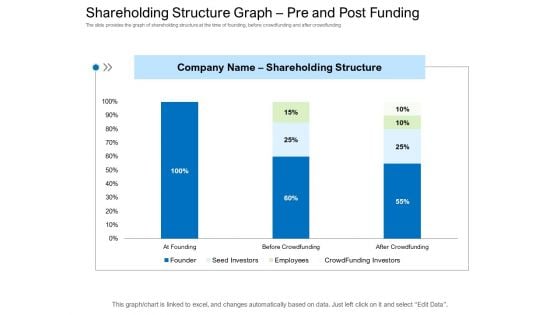
Collective Equity Funding Pitch Deck Shareholding Structure Graph Pre And Post Funding Graphics PDF
The slide provides the graph of shareholding structure at the time of founding, before crowdfunding and after crowdfunding. Deliver and pitch your topic in the best possible manner with this collective equity funding pitch deck shareholding structure graph pre and post funding graphics pdf. Use them to share invaluable insights on shareholding structure, investors, seed investors, employees and impress your audience. This template can be altered and modified as per your expectations. So, grab it now.
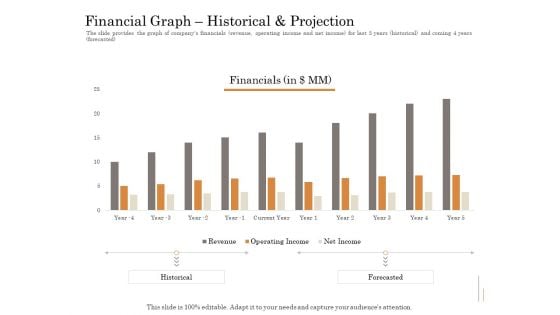
Subordinated Loan Funding Financial Graph Historical And Projection Ppt Model File Formats PDF
The slide provides the graph of companys financials revenue, operating income and net income for last 5 years historical and coming 4 years forecasted. Deliver and pitch your topic in the best possible manner with this subordinated loan funding financial graph historical and projection ppt model file formats pdf. Use them to share invaluable insights on revenue, operating income, net income, current year. and impress your audience. This template can be altered and modified as per your expectations. So, grab it now.
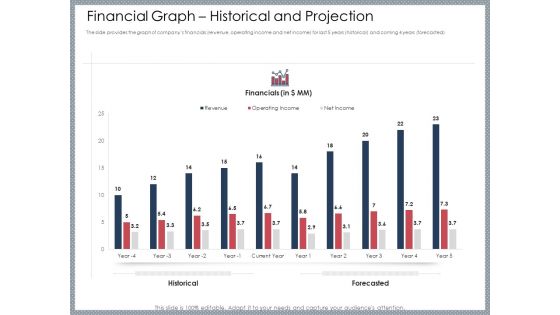
Mezzanine Venture Capital Funding Pitch Deck Financial Graph Historical And Projection Pictures PDF
The slide provides the graph of companys financials revenue operating income and net income for last five years historical and coming four years forecasted. Deliver and pitch your topic in the best possible manner with this mezzanine venture capital funding pitch deck financial graph historical and projection pictures pdf. Use them to share invaluable insights on financial, historical, projection, year, revenue and impress your audience. This template can be altered and modified as per your expectations. So, grab it now.
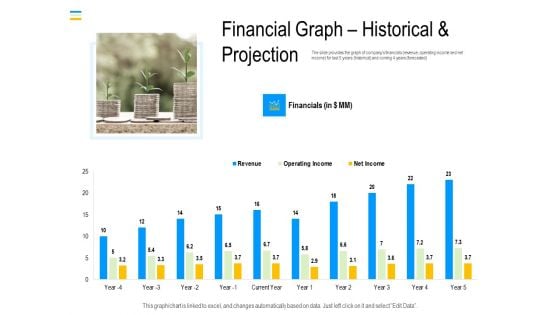
Mezzanine Debt Financing Pitch Deck Financial Graph Historical And Projection Demonstration PDF
The slide provides the graph of companys financials revenue, operating income and net income for last five years historical and coming four years forecasted. Deliver and pitch your topic in the best possible manner with this mezzanine debt financing pitch deck financial graph historical and projection demonstration pdf. Use them to share invaluable insights on financials, revenue, operating income and impress your audience. This template can be altered and modified as per your expectations. So, grab it now.
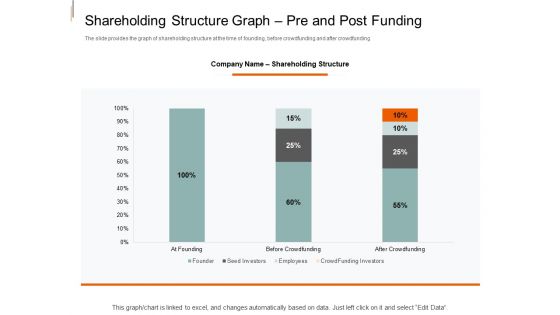
Equity Crowd Investing Shareholding Structure Graph Pre And Post Funding Background PDF
The slide provides the graph of shareholding structure at the time of founding, before crowdfunding and after crowdfunding. Deliver an awe inspiring pitch with this creative equity crowd investing shareholding structure graph pre and post funding background pdf bundle. Topics like founder, seed investors, employees, crowdfunding investors, before crowdfunding, after crowdfunding can be discussed with this completely editable template. It is available for immediate download depending on the needs and requirements of the user.
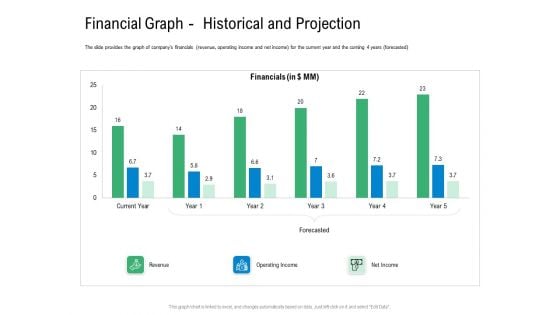
Convertible Preferred Stock Funding Pitch Deck Financial Graph Historical And Projection Themes PDF
The slide provides the graph of companys financials revenue, operating income and net income for the current year and the coming 4 years forecasted. Deliver an awe inspiring pitch with this creative convertible preferred stock funding pitch deck financial graph historical and projection themes pdf bundle. Topics like revenue, operating income, net income can be discussed with this completely editable template. It is available for immediate download depending on the needs and requirements of the user.
Option Pool Funding Pitch Deck Shareholding Structure Graph Pre And Post Funding Ppt Icon Rules PDF
The slide provides the graph of shareholding structure at the time of founding, before crowdfunding and after crowdfunding. Deliver an awe inspiring pitch with this creative option pool funding pitch deck shareholding structure graph pre and post funding ppt icon rules pdf bundle. Topics like founder, seed investors, employees, crowd funding investors can be discussed with this completely editable template. It is available for immediate download depending on the needs and requirements of the user.


 Continue with Email

 Home
Home


