Graph
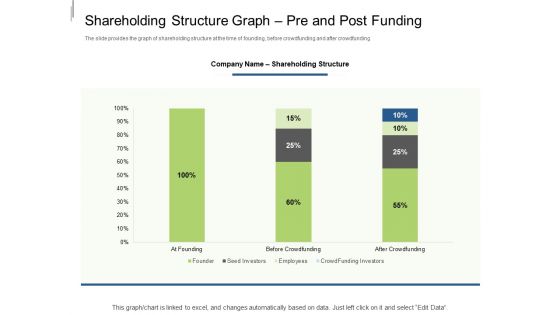
Equity Crowdfunding Pitch Deck Shareholding Structure Graph Pre And Post Funding Ppt Summary Graphics Pictures PDF
The slide provides the graph of shareholding structure at the time of founding, before crowdfunding and after crowdfunding. Deliver an awe inspiring pitch with this creative equity crowdfunding pitch deck shareholding structure graph pre and post funding ppt summary graphics pictures pdf bundle. Topics like founder, seed investors, employees, crowd funding investors can be discussed with this completely editable template. It is available for immediate download depending on the needs and requirements of the user.
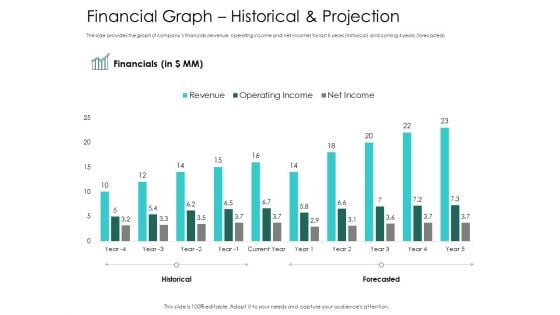
Hybrid Investment Pitch Deck Financial Graph Historical And Projection Ppt Portfolio Design Inspiration PDF
The slide provides the graph of companys financials revenue, operating income and net income for last 5 years historical and coming 4 years forecasted. Deliver an awe inspiring pitch with this creative hybrid investment pitch deck financial graph historical and projection ppt portfolio design inspiration pdf bundle. Topics like financial, revenue, operating income, net income can be discussed with this completely editable template. It is available for immediate download depending on the needs and requirements of the user.
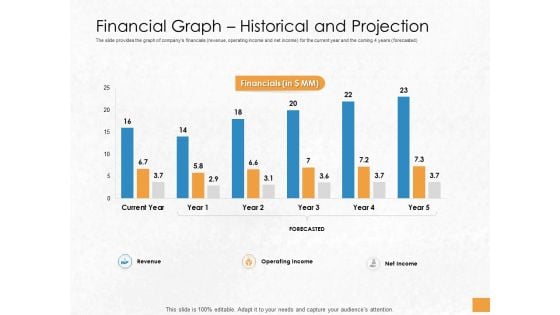
Convertible Debenture Funding Financial Graph Historical And Projection Ppt Professional Themes PDF
The slide provides the graph of companys financials revenue, operating income and net income for the current year and the coming 4 years forecasted. Deliver an awe-inspiring pitch with this creative convertible debenture funding financial graph historical and projection ppt professional themes pdf bundle. Topics like revenue, operating income, net income, forecasted, financials, current year can be discussed with this completely editable template. It is available for immediate download depending on the needs and requirements of the user.
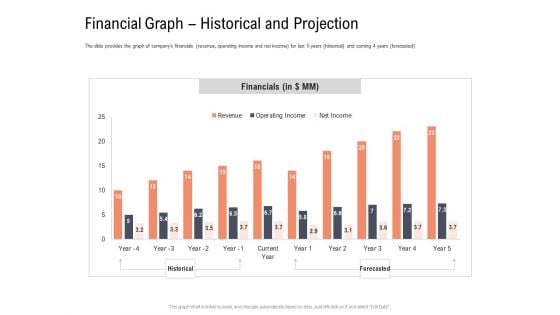
Investor Pitch Deck To Collect Capital From Subordinated Loan Financial Graph Historical And Projection Introduction PDF
The slide provides the graph of companys financials revenue, operating income and net income for last 5 years historical and coming 4 years forecasted. Deliver an awe-inspiring pitch with this creative investor pitch deck to collect capital from subordinated loan financial graph historical and projection introduction pdf bundle. Topics like financials, net income, operating income, revenue, historical, forecasted can be discussed with this completely editable template. It is available for immediate download depending on the needs and requirements of the user.
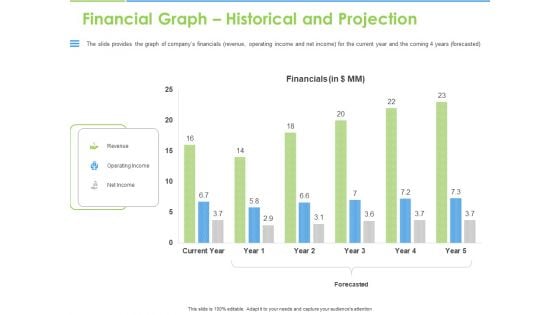
Convertible Bonds Pitch Deck For Increasing Capitals Financial Graph Historical And Projection Elements PDF
The slide provides the graph of companys financials revenue, operating income and net income for the current year and the coming 4 years forecasted. Deliver an awe-inspiring pitch with this creative convertible bonds pitch deck for increasing capitals financial graph historical and projection elements pdf bundle. Topics like revenue, operating income, net income, forecasted, financials, current year can be discussed with this completely editable template. It is available for immediate download depending on the needs and requirements of the user.
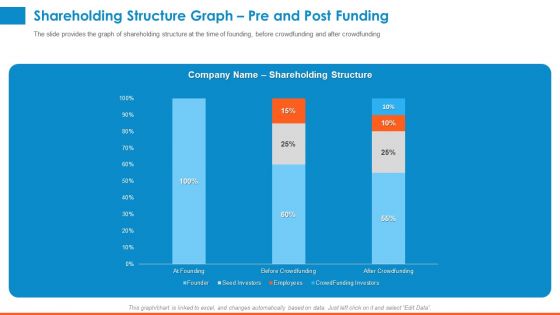
Raising Company Capital From Public Funding Sources Shareholding Structure Graph Pre And Post Funding Diagrams PDF
The slide provides the graph of shareholding structure at the time of founding, before crowdfunding and after crowdfunding. Deliver an awe-inspiring pitch with this creative raising company capital from public funding sources shareholding structure graph pre and post funding diagrams pdf bundle. Topics like founder, seed investors, employees, crowdfunding investors, before crowdfunding, after crowdfunding can be discussed with this completely editable template. It is available for immediate download depending on the needs and requirements of the user.

Bar Graph Showing Revenues Generated By Sales Department Ppt Portfolio Graphics Example PDF
This graph or chart is linked to excel, and changes automatically based on data. Just left click on it and select edit data. Showcasing this set of slides titled bar graph showing revenues generated by sales department ppt portfolio graphics example pdf. The topics addressed in these templates are yearly sales revenues, sales team, profits. All the content presented in this PPT design is completely editable. Download it and make adjustments in color, background, font etc. as per your unique business setting.
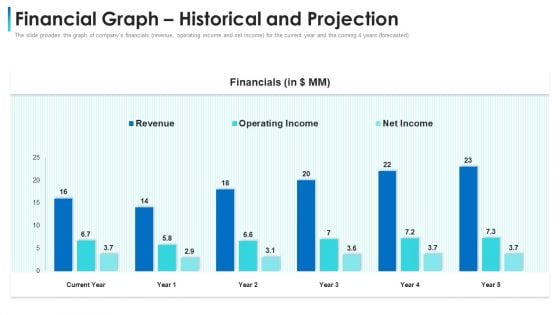
Convertible Bond Financing Pitch Deck Financial Graph Historical And Projection Slides PDF
The slide provides the graph of companys financials revenue, operating income and net income for the current year and the coming 4 years forecasted. Deliver an awe-inspiring pitch with this creative convertible bond financing pitch deck financial graph historical and projection slides pdf bundle. Topics like revenue, operating income, net income, financial can be discussed with this completely editable template. It is available for immediate download depending on the needs and requirements of the user.
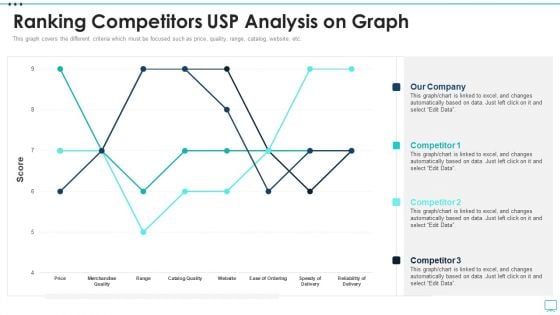
Strategic Business Plan Effective Tools Ranking Competitors USP Analysis On Graph Designs PDF
This graph covers the different criteria which must be focused such as price, quality, range, catalog, website, etc. Deliver and pitch your topic in the best possible manner with this strategic business plan effective tools ranking competitors usp analysis on graph designs pdf. Use them to share invaluable insights on price, merchandise quality, catalog quality, speedy delivery and impress your audience. This template can be altered and modified as per your expectations. So, grab it now.
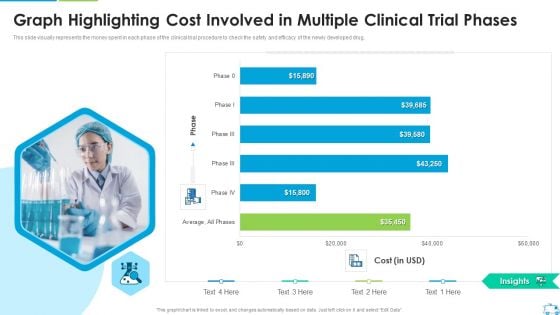
Graph Highlighting Cost Involved In Multiple Clinical Trial Phases Microsoft PDF
This slide visually represents the money spent in each phase of the clinical trial procedure to check the safety and efficacy of the newly developed drug.Deliver an awe inspiring pitch with this creative Graph Highlighting Cost Involved In Multiple Clinical Trial Phases Microsoft PDF bundle. Topics like Graph Highlighting Cost Involved In Multiple Clinical Trial Phases can be discussed with this completely editable template. It is available for immediate download depending on the needs and requirements of the user.
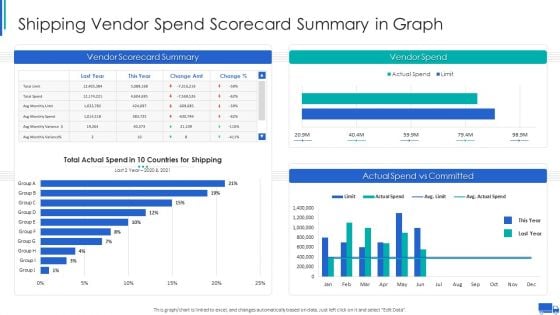
Shipping Vendor Spend Scorecard Summary In Graph Ppt Pictures Introduction PDF
This graph or chart is linked to excel, and changes automatically based on data. Just left click on it and select Edit Data. Deliver and pitch your topic in the best possible manner with this Shipping Vendor Spend Scorecard Summary In Graph Ppt Pictures Introduction PDF. Use them to share invaluable insights on Vendor Scorecard Summary, Vendor Spend Shipping, Actual Spend Vs and impress your audience. This template can be altered and modified as per your expectations. So, grab it now.
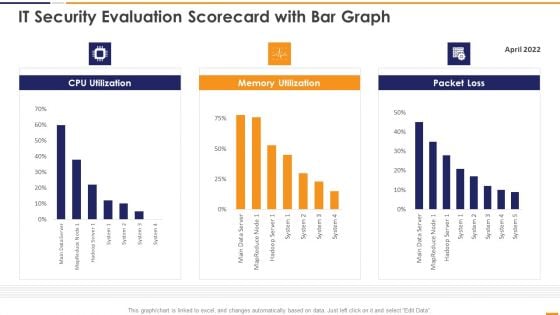
IT Security Evaluation Scorecard With Bar Graph Ppt Gallery Design Templates PDF
This graph or chart is linked to excel, and changes automatically based on data. Just left click on it and select Edit Data. Deliver and pitch your topic in the best possible manner with this IT Security Evaluation Scorecard With Bar Graph Ppt Gallery Design Templates PDF. Use them to share invaluable insights on CPU Utilization Memory, Utilization Packet Loss and impress your audience. This template can be altered and modified as per your expectations. So, grab it now.
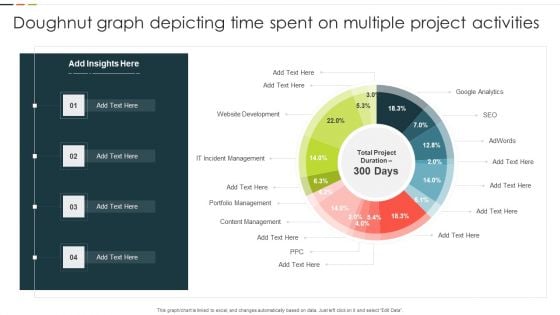
Doughnut Graph Depicting Time Spent On Multiple Project Activities Microsoft PDF
This graph or chart is linked to excel, and changes automatically based on data. Just left click on it and select Edit Data. Showcasing this set of slides titled Doughnut Graph Depicting Time Spent On Multiple Project Activities Microsoft PDF. The topics addressed in these templates are Website Development, IT Incident Management, Portfolio Management. All the content presented in this PPT design is completely editable. Download it and make adjustments in color, background, font etc. as per your unique business setting.
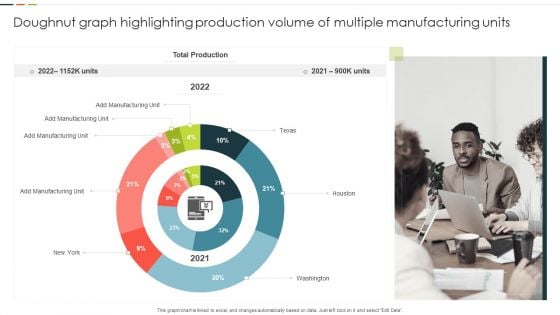
Doughnut Graph Highlighting Production Volume Of Multiple Manufacturing Units Guidelines PDF
This graph or chart is linked to excel, and changes automatically based on data. Just left click on it and select Edit Data. Showcasing this set of slides titled Doughnut Graph Highlighting Production Volume Of Multiple Manufacturing Units Guidelines PDF. The topics addressed in these templates are Total Production, Manufacturing Unit, Washington. All the content presented in this PPT design is completely editable. Download it and make adjustments in color, background, font etc. as per your unique business setting.
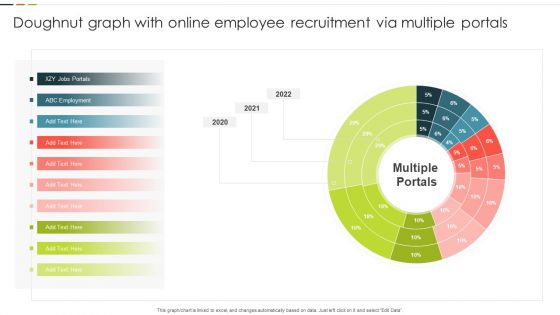
Doughnut Graph With Online Employee Recruitment Via Multiple Portals Mockup PDF
This graph or chart is linked to excel, and changes automatically based on data. Just left click on it and select Edit Data. Pitch your topic with ease and precision using this Doughnut Graph With Online Employee Recruitment Via Multiple Portals Mockup PDF. This layout presents information on ABC Employment, Multiple Portals, 2020 To 2022. It is also available for immediate download and adjustment. So, changes can be made in the color, design, graphics or any other component to create a unique layout.
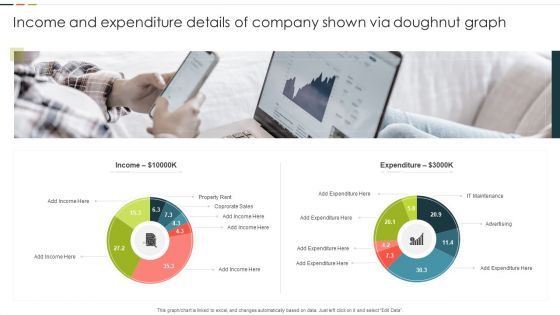
Income And Expenditure Details Of Company Shown Via Doughnut Graph Graphics PDF
This graph or chart is linked to excel, and changes automatically based on data. Just left click on it and select Edit Data. Pitch your topic with ease and precision using this Income And Expenditure Details Of Company Shown Via Doughnut Graph Graphics PDF. This layout presents information on Property Rent, Corporate Sales, Expenditure. It is also available for immediate download and adjustment. So, changes can be made in the color, design, graphics or any other component to create a unique layout.
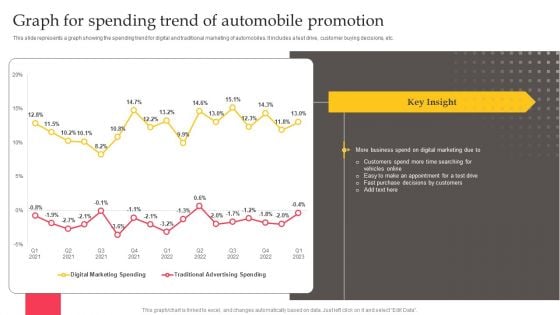
Executing Automotive Marketing Tactics For Sales Boost Graph For Spending Trend Information PDF
This slide represents a graph showing the spending trend for digital and traditional marketing of automobiles. It includes a test drive, customer buying decisions, etc. There are so many reasons you need a Executing Automotive Marketing Tactics For Sales Boost Graph For Spending Trend Information PDF. The first reason is you can not spend time making everything from scratch, Thus, Slidegeeks has made presentation templates for you too. You can easily download these templates from our website easily.
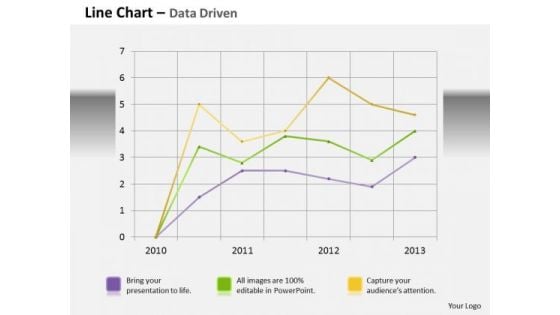
Data Analysis Template Driven Line Chart Business Graph PowerPoint Slides Templates
Bottle Your Thoughts In Our data analysis template driven line chart business graph powerpoint slides Templates . Pass It Around For Your Audience To Sip.
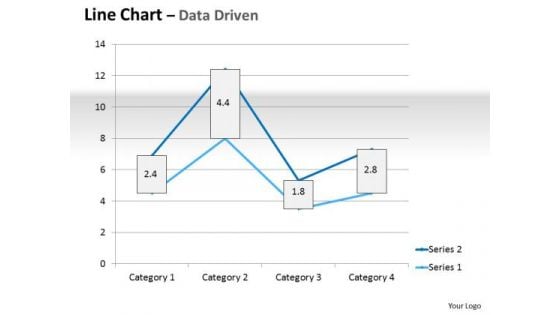
Multivariate Data Analysis Driven Line Chart Market Graph PowerPoint Slides Templates
Plan For All Contingencies With Our multivariate data analysis driven line chart market graph powerpoint slides Templates . Douse The Fire Before It Catches.

Micosoft Intensive Growth Microsoft Corporations Revenue Growth Graph Strategy SS V
This slide represents graph which ca be used to calculate the revenue growth of microsoft in last twenty years. Microsofts revenue has been growing continuously over the past 5 years since. Slidegeeks has constructed Micosoft Intensive Growth Microsoft Corporations Revenue Growth Graph Strategy SS V after conducting extensive research and examination. These presentation templates are constantly being generated and modified based on user preferences and critiques from editors. Here, you will find the most attractive templates for a range of purposes while taking into account ratings and remarks from users regarding the content. This is an excellent jumping-off point to explore our content and will give new users an insight into our top-notch PowerPoint Templates. This slide represents graph which ca be used to calculate the revenue growth of microsoft in last twenty years. Microsofts revenue has been growing continuously over the past 5 years since.

Arrow Around Bar Graph Business PowerPoint Templates And PowerPoint Themes 0712
Arrow Around Bar Graph Business PowerPoint Templates And PowerPoint Themes 0712-Microsoft Powerpoint Templates and Background with circular arrow placed around the bottom of a multi color bar chart Handle a delicate situation with our Arrow Around Bar Graph Business PowerPoint Templates And PowerPoint Themes 0712. Just download, type and present.
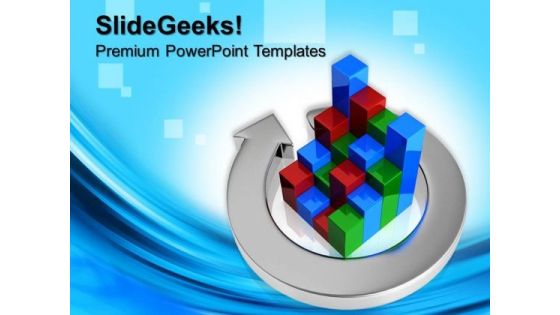
Metallic Arrow Around Bar Graph Finance PowerPoint Templates And PowerPoint Themes 0712
Metallic Arrow Around Bar Graph Finance PowerPoint Templates And PowerPoint Themes 0712-Microsoft Powerpoint Templates and Background with circular arrow placed around the bottom of a bar chart Count your blessings with our Metallic Arrow Around Bar Graph Finance PowerPoint Templates And PowerPoint Themes 0712. You will come out on top.
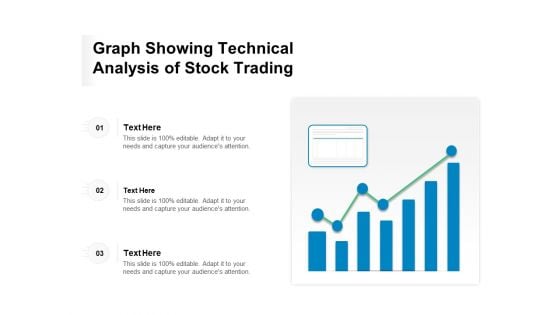
Graph Showing Technical Analysis Of Stock Trading Ppt PowerPoint Presentation Infographic Template Portrait PDF
Presenting this set of slides with name graph showing technical analysis of stock trading ppt powerpoint presentation infographic template portrait pdf. This is a three stage process. The stages in this process are graph showing technical analysis of stock trading. This is a completely editable PowerPoint presentation and is available for immediate download. Download now and impress your audience.
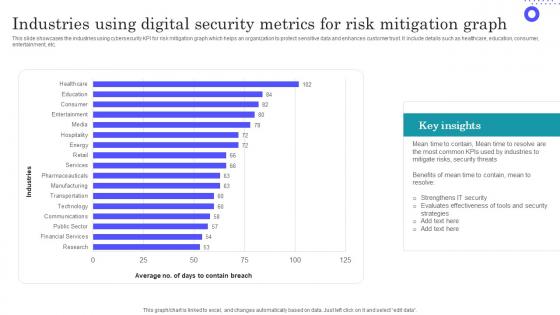
Industries Using Digital Security Metrics For Risk Mitigation Graph Inspiration Pdf
Showcasing this set of slides titled Industries Using Digital Security Metrics For Risk Mitigation Graph Inspiration Pdf The topics addressed in these templates are Evaluates Effectiveness, Most Common, Key Insights All the content presented in this PPT design is completely editable. Download it and make adjustments in color, background, font etc. as per your unique business setting. This slide showcases the industries using cybersecurity KPI for risk mitigation graph which helps an organization to protect sensitive data and enhances customer trust. It include details such as healthcare, education, consumer, entertainment, etc.
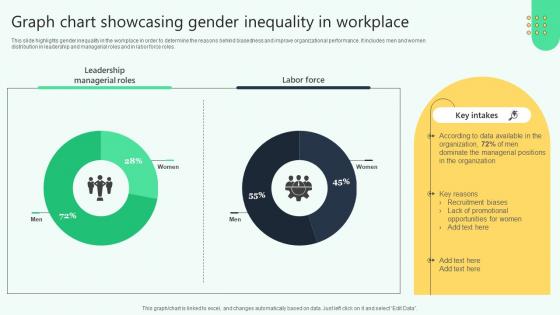
Graph Chart Showcasing Gender Inequality In Workplace Analysing Hr Data For Effective Decision Making
This slide highlights gender inequality in the workplace in order to determine the reasons behind biasedness and improve organizational performance. It includes men and women distribution in leadership and managerial roles and in labor force roles. This Graph Chart Showcasing Gender Inequality In Workplace Analysing Hr Data For Effective Decision Making is perfect for any presentation, be it in front of clients or colleagues. It is a versatile and stylish solution for organizing your meetings. The Graph Chart Showcasing Gender Inequality In Workplace Analysing Hr Data For Effective Decision Making features a modern design for your presentation meetings. The adjustable and customizable slides provide unlimited possibilities for acing up your presentation. Slidegeeks has done all the homework before launching the product for you. So, do not wait, grab the presentation templates today This slide highlights gender inequality in the workplace in order to determine the reasons behind biasedness and improve organizational performance. It includes men and women distribution in leadership and managerial roles and in labor force roles.
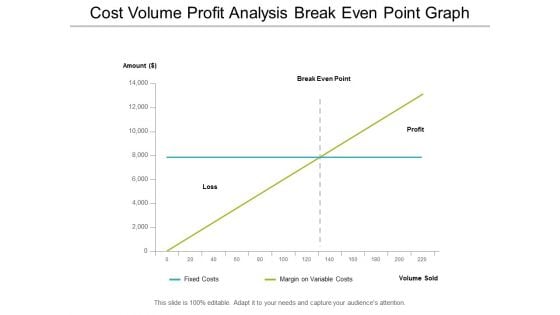
cost volume profit analysis break even point graph ppt powerpoint presentation professional shapes
This is a cost volume profit analysis break even point graph ppt powerpoint presentation professional shapes. This is a four stage process. The stages in this process are break even point,break even analysis,break even level.
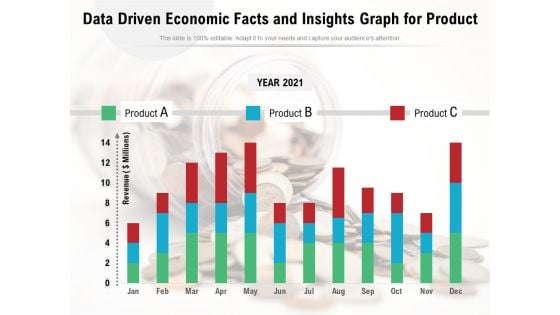
Data Driven Economic Facts And Insights Graph For Product Ppt PowerPoint Presentation Pictures Slide Download PDF
Pitch your topic with ease and precision using this data driven economic facts and insights graph for product ppt powerpoint presentation pictures slide download pdf. This layout presents information on year 2021, product, data driven economic. It is also available for immediate download and adjustment. So, changes can be made in the color, design, graphics or any other component to create a unique layout.
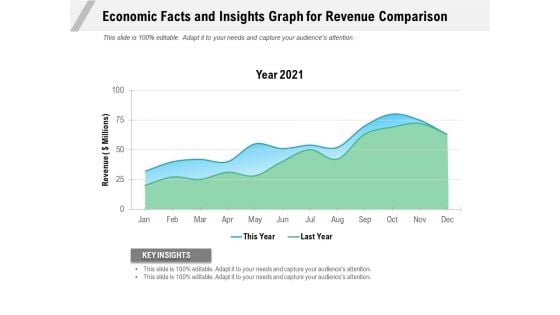
Economic Facts And Insights Graph For Revenue Comparison Ppt PowerPoint Presentation Gallery Portfolio PDF
Pitch your topic with ease and precision using this economic facts and insights graph for revenue comparison ppt powerpoint presentation gallery portfolio pdf. This layout presents information on year 2021, revenue, key insights. It is also available for immediate download and adjustment. So, changes can be made in the color, design, graphics or any other component to create a unique layout.
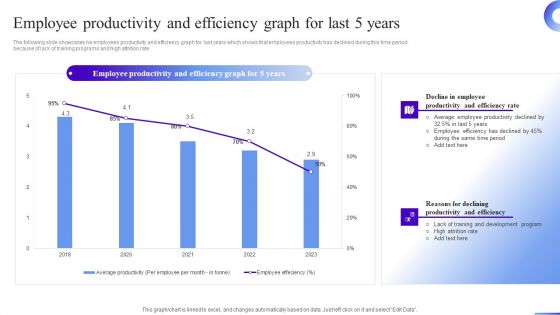
Business Development Program Employee Productivity And Efficiency Graph For Last 5 Years Ideas PDF
The following slide showcases he employees productivity and efficiency graph for last years which shows that employees productivity has declined during this time period because of lack of training programs and high attrition rate. Whether you have daily or monthly meetings, a brilliant presentation is necessary. Business Development Program Employee Productivity And Efficiency Graph For Last 5 Years Ideas PDF can be your best option for delivering a presentation. Represent everything in detail using Business Development Program Employee Productivity And Efficiency Graph For Last 5 Years Ideas PDF and make yourself stand out in meetings. The template is versatile and follows a structure that will cater to your requirements. All the templates prepared by Slidegeeks are easy to download and edit. Our research experts have taken care of the corporate themes as well. So, give it a try and see the results.
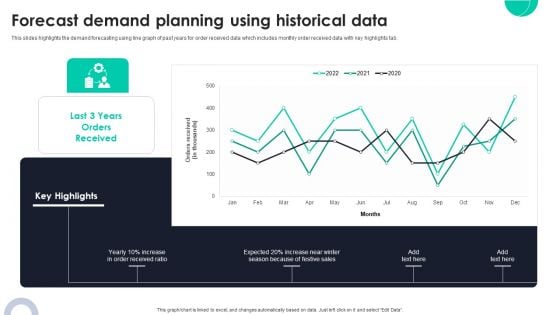
Forecast Demand Planning Using Historical Data Ppt PowerPoint Presentation Diagram Graph Charts PDF
This slides highlights the demand forecasting using line graph of past years for order received data which includes monthly order received data with key highlights tab. Crafting an eye catching presentation has never been more straightforward. Let your presentation shine with this tasteful yet straightforward Forecast Demand Planning Using Historical Data Ppt PowerPoint Presentation Diagram Graph Charts PDF template. It offers a minimalistic and classy look that is great for making a statement. The colors have been employed intelligently to add a bit of playfulness while still remaining professional. Construct the ideal Forecast Demand Planning Using Historical Data Ppt PowerPoint Presentation Diagram Graph Charts PDF that effortlessly grabs the attention of your audience. Begin now and be certain to wow your customers.
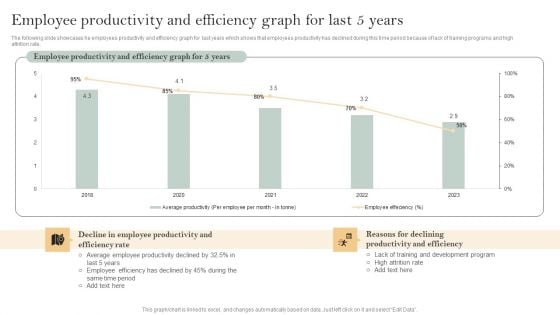
Skill Enhancement Plan Employee Productivity And Efficiency Graph For Last 5 Years Microsoft PDF
The following slide showcases he employees productivity and efficiency graph for last years which shows that employees productivity has declined during this time period because of lack of training programs and high attrition rate. Find highly impressive Skill Enhancement Plan Employee Productivity And Efficiency Graph For Last 5 Years Microsoft PDF on Slidegeeks to deliver a meaningful presentation. You can save an ample amount of time using these presentation templates. No need to worry to prepare everything from scratch because Slidegeeks experts have already done a huge research and work for you. You need to download Skill Enhancement Plan Employee Productivity And Efficiency Graph For Last 5 Years Microsoft PDF for your upcoming presentation. All the presentation templates are 100 percent editable and you can change the color and personalize the content accordingly. Download now

Microsoft Strategic Plan To Become Market Leader Microsoft Corporations Revenue Growth Graph Portrait PDF
This slide represents graph which ca be used to calculate the revenue growth of Microsoft in last twenty years. Microsofts revenue has been growing continuously over the past 5 years since. Whether you have daily or monthly meetings, a brilliant presentation is necessary. Microsoft Strategic Plan To Become Market Leader Microsoft Corporations Revenue Growth Graph Portrait PDF can be your best option for delivering a presentation. Represent everything in detail using Microsoft Strategic Plan To Become Market Leader Microsoft Corporations Revenue Growth Graph Portrait PDF and make yourself stand out in meetings. The template is versatile and follows a structure that will cater to your requirements. All the templates prepared by Slidegeeks are easy to download and edit. Our research experts have taken care of the corporate themes as well. So, give it a try and see the results.
Business Graph And Target Success PowerPoint Templates And PowerPoint Backgrounds 0311
Microsoft PowerPoint Template and Background with business graph and target Market your product with our Business Graph And Target Success PowerPoint Templates And PowerPoint Backgrounds 0311. Download without worries with our money back guaranteee.

Business Graph With Dollars Globe PowerPoint Templates And PowerPoint Backgrounds 0311
Microsoft PowerPoint Template and Background with bar graphs dollar sign and diagram Convincing an audience is no mean feat. Do it with ease with our Business Graph With Dollars Globe PowerPoint Templates And PowerPoint Backgrounds 0311.
Business Graph With Arrow Metaphor PowerPoint Templates And PowerPoint Backgrounds 0311
Microsoft PowerPoint Template and Background with business graph with arrow Watch your plans fall into place. Our Business Graph With Arrow Metaphor PowerPoint Templates And PowerPoint Backgrounds 0311 aid in completion.
Graph With Up Arrow Globe Business PowerPoint Templates And PowerPoint Backgrounds 0411
Microsoft PowerPoint Template and Background with business graph with arrow and globe Continue on your path to success with our Graph With Up Arrow Globe Business PowerPoint Templates And PowerPoint Backgrounds 0411. You will come out on top.
Statistique Of Business Graph Success PowerPoint Templates And PowerPoint Backgrounds 0411
Microsoft PowerPoint Template and Background with rainbow colored financial graph showing strong growth all the way up Our Statistique Of Business Graph Success PowerPoint Templates And PowerPoint Backgrounds 0411 are a complete customer delight. They deliver on every account.
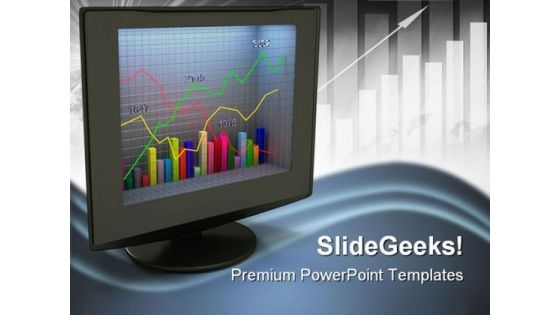
Business Graph On Monitor Success PowerPoint Templates And PowerPoint Backgrounds 0411
Microsoft PowerPoint Template and Background with a computer monitor with miscellaneous business graphs Put your thoughts on the anvil. Fashion them with our Business Graph On Monitor Success PowerPoint Templates And PowerPoint Backgrounds 0411.
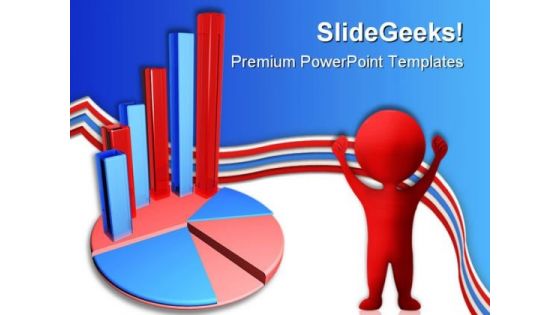
Business Graph On Pie Chart Finance PowerPoint Templates And PowerPoint Backgrounds 0411
Microsoft PowerPoint Template and Background with business graph on pie chart Engage our Business Graph On Pie Chart Finance PowerPoint Templates And PowerPoint Backgrounds 0411 and experience the difference. Get accustomed to consistent brilliance.
Person Installing The Graph Business PowerPoint Templates And PowerPoint Backgrounds 0411
Microsoft PowerPoint Template and Background with 3D puppet installing the business graph Leave a lasting impression with our Person Installing The Graph Business PowerPoint Templates And PowerPoint Backgrounds 0411. Make sure people remember your presentations.
Arrow Graph Going Up Success PowerPoint Templates And PowerPoint Backgrounds 0511
Microsoft PowerPoint Template and Background with arrow graph going up on a blue background Fix problems with our Arrow Graph Going Up Success PowerPoint Templates And PowerPoint Backgrounds 0511. Try us out and see what a difference our templates make.
Arrow Graph Going Up Global PowerPoint Templates And PowerPoint Backgrounds 0511
Microsoft PowerPoint Template and Background with arrow graph going up Expound your logic on our Arrow Graph Going Up Global PowerPoint Templates And PowerPoint Backgrounds 0511. Let them in on your chain of thought.

Businessman Holding Up Graph Marketing PowerPoint Templates And PowerPoint Backgrounds 0511
Microsoft PowerPoint Template and Background with young modern businessman holding up graph Get face to face with your audience. Put your thoughts and our Businessman Holding Up Graph Marketing PowerPoint Templates And PowerPoint Backgrounds 0511 right up front.
Business Bar Graph Arrow Success PowerPoint Templates And PowerPoint Backgrounds 0511
Microsoft PowerPoint Template and Background with a business chart/graph showing the decline of the financial money market Make the event with our Business Bar Graph Arrow Success PowerPoint Templates And PowerPoint Backgrounds 0511. Your thoughts will be really happening.
Business Graph With Check Metaphor PowerPoint Templates And PowerPoint Backgrounds 0511
Microsoft PowerPoint Template and Background with a combination of a check mark and financial graph Our Business Graph With Check Metaphor PowerPoint Templates And PowerPoint Backgrounds 0511 are very falcon like. They keep a sharp eye on the target.

Dices On Financial Graph Business PowerPoint Templates And PowerPoint Backgrounds 0511
Microsoft PowerPoint Template and Background with dices on financial graph Enliven the discussion with our Dices On Financial Graph Business PowerPoint Templates And PowerPoint Backgrounds 0511. The audience will get all animated.

Man Drawing A Graph Marketing PowerPoint Templates And PowerPoint Backgrounds 0511
Microsoft PowerPoint Template and Background with business man drawing a growth graph Start driving performance improvement with our Man Drawing A Graph Marketing PowerPoint Templates And PowerPoint Backgrounds 0511. They will make you look good.
Success Graph With Dollar Business PowerPoint Templates And PowerPoint Backgrounds 0511
Microsoft PowerPoint Template and Background with business graph from dollar coins with arrow showing profits Let new ideas filter in with our Success Graph With Dollar Business PowerPoint Templates And PowerPoint Backgrounds 0511. They will be acceptable to any audience.

Man With A Graph Business PowerPoint Templates And PowerPoint Backgrounds 0611
Microsoft PowerPoint Template and Background with successful business man with a graph Our Man With A Graph Business PowerPoint Templates And PowerPoint Backgrounds 0611 will boost even a faint hope. They build up the belief in positive action.
Yellow And Blue Graph Business PowerPoint Templates And PowerPoint Backgrounds 0611
Microsoft PowerPoint Template and Background with business graph with arrow Exercise your mind with our Yellow And Blue Graph Business PowerPoint Templates And PowerPoint Backgrounds 0611. Pump the cells and generate ideas.
Graph With World Map Business PowerPoint Templates And PowerPoint Backgrounds 0611
Microsoft PowerPoint Template and Background with graph with world map and grid in background Our Graph With World Map Business PowerPoint Templates And PowerPoint Backgrounds 0611 are clear to even the farthest. They are designed for distance.
Growth Graph With Arrow01 Business PowerPoint Templates And PowerPoint Backgrounds 0611
Microsoft PowerPoint Template and Background with growth graph with red arrow pointing upwards Construct an enviable career for yourself. Lay the foundation with our Growth Graph With Arrow01 Business PowerPoint Templates And PowerPoint Backgrounds 0611.
Graph Growth Of Dollars Finance PowerPoint Templates And PowerPoint Backgrounds 0711
Microsoft PowerPoint Template and Background with graph representing growth sign of money Have nothing to fear with our Graph Growth Of Dollars Finance PowerPoint Templates And PowerPoint Backgrounds 0711. Just download, type and present.
Person Standing On Graph Success PowerPoint Templates And PowerPoint Backgrounds 0711
Microsoft PowerPoint Template and Background with number one bar graph Our Person Standing On Graph Success PowerPoint Templates And PowerPoint Backgrounds 0711 will get their cravings going. Feed their desires with your thoughts.
Profit Graph With Green Arrow Business PowerPoint Templates And PowerPoint Backgrounds 0811
Microsoft PowerPoint Template and Background with profit graph with green arrows Don't let it drag with our Profit Graph With Green Arrow Business PowerPoint Templates And PowerPoint Backgrounds 0811. They help you keep it crisp and concise.
Graph With Up Arrow Globe Business PowerPoint Themes And PowerPoint Slides 0411
Microsoft PowerPoint Theme and Slide with business graph with arrow and globe End all differences with our Graph With Up Arrow Globe Business PowerPoint Themes And PowerPoint Slides 0411. They encourage achieving consensus.
Statistique Of Business Graph Success PowerPoint Themes And PowerPoint Slides 0411
Microsoft PowerPoint Theme and Slide with rainbow colored financial graph showing strong growth all the way up Our Statistique Of Business Graph Success PowerPoint Themes And PowerPoint Slides 0411 are clear to even the farthest. They are designed for distance.
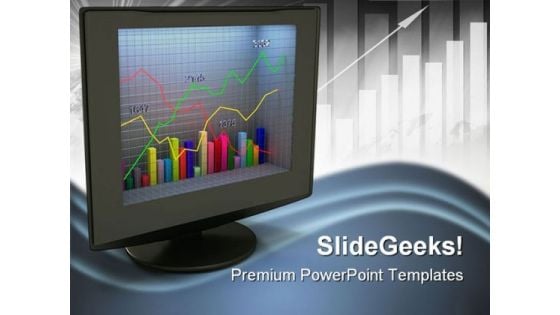
Business Graph On Monitor Success PowerPoint Themes And PowerPoint Slides 0411
Microsoft PowerPoint Theme and Slide with a computer monitor with miscellaneous business graphs When in doubt fall back on our Business Graph On Monitor Success PowerPoint Themes And PowerPoint Slides 0411. All your apprehensions will fall away.
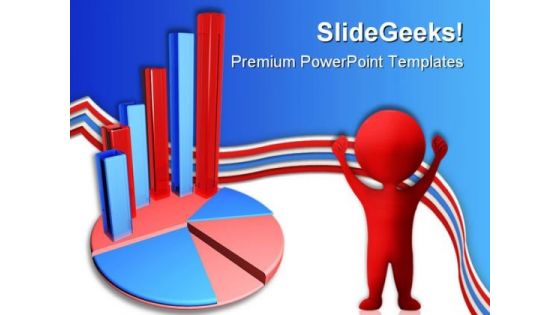
Business Graph On Pie Chart Finance PowerPoint Themes And PowerPoint Slides 0411
Microsoft PowerPoint Theme and Slide with business graph on pie chart Analyse the effect of different factors. Our Business Graph On Pie Chart Finance PowerPoint Themes And PowerPoint Slides 0411 will give them equal attention.
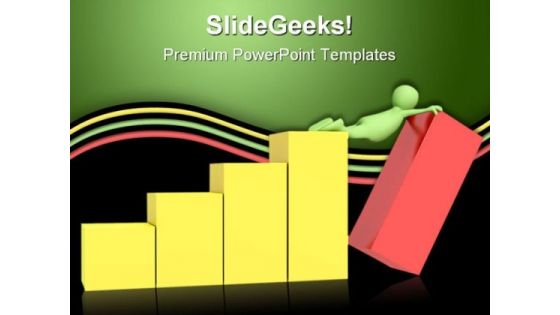
Person Installing The Graph Business PowerPoint Themes And PowerPoint Slides 0411
Microsoft PowerPoint Theme and Slide with 3D puppet installing the business graph Paint the canvas with our Person Installing The Graph Business PowerPoint Themes And PowerPoint Slides 0411. Just download, type and present.


 Continue with Email

 Home
Home


