Hierarchy Chart Organizational
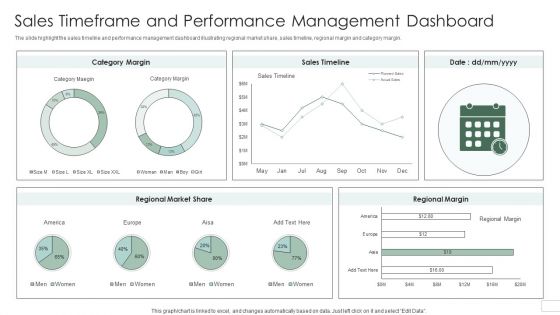
Sales Timeframe And Performance Management Dashboard Introduction PDF
The slide highlight the sales timeline and performance management dashboard illustrating regional market share, sales timeline, regional margin and category margin. Pitch your topic with ease and precision using this Sales Timeframe And Performance Management Dashboard Introduction PDF. This layout presents information on Regional Market Share, Category Margin, Sales Timeline. It is also available for immediate download and adjustment. So, changes can be made in the color, design, graphics or any other component to create a unique layout.
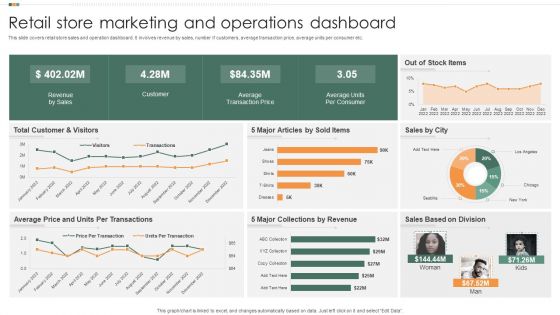
Retail Store Marketing And Operations Dashboard Mockup PDF
This slide covers retail store sales and operation dashboard. It involves revenue by sales, number if customers, average transaction price, average units per consumer etc. Pitch your topic with ease and precision using this Retail Store Marketing And Operations Dashboard Mockup PDF. This layout presents information on Revenue By Sales, Customer, Average Transaction Price. It is also available for immediate download and adjustment. So, changes can be made in the color, design, graphics or any other component to create a unique layout.
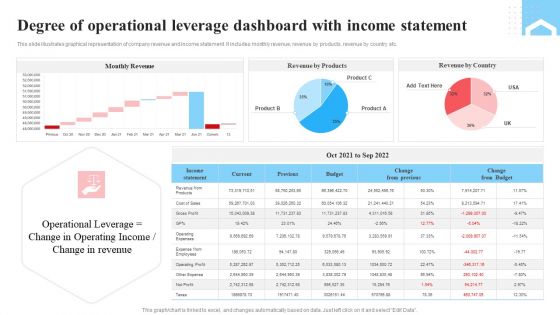
Degree Of Operational Leverage Dashboard With Income Statement Ppt Infographics Layout PDF
This slide illustrates graphical representation of company revenue and income statement. It includes monthly revenue, revenue by products, revenue by country etc. Pitch your topic with ease and precision using this Degree Of Operational Leverage Dashboard With Income Statement Ppt Infographics Layout PDF. This layout presents information on Monthly Revenue, Income Statement, Product. It is also available for immediate download and adjustment. So, changes can be made in the color, design, graphics or any other component to create a unique layout.
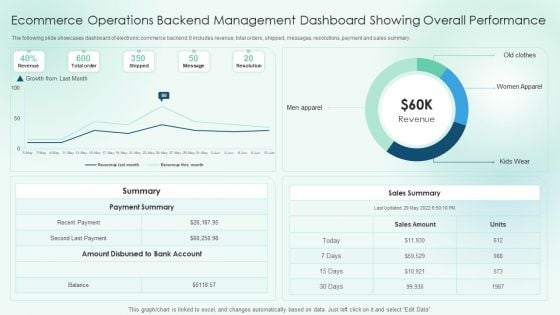
Ecommerce Operations Backend Management Dashboard Showing Overall Performance Slides PDF
The following slide showcases dashboard of electronic commerce backend. It includes revenue, total orders, shipped, messages, resolutions, payment and sales summary.Pitch your topic with ease and precision using this Ecommerce Operations Backend Management Dashboard Showing Overall Performance Slides PDF. This layout presents information on Payment Summary, Amount Disbursed, Sales Summary. It is also available for immediate download and adjustment. So, changes can be made in the color, design, graphics or any other component to create a unique layout.

Impact Of Personnel Workplace Conflict Stats Rules PDF
This slide illustrates the outcome of conflict among employees at workplace. It includes personal insults, absence, departmental arguments, bullying, resignations, terminations, project failure and change in departments.Pitch your topic with ease and precision using this Impact Of Personnel Workplace Conflict Stats Rules PDF. This layout presents information on Personal Attacks, Training Is Advantageous, Conflict Resolution. It is also available for immediate download and adjustment. So, changes can be made in the color, design, graphics or any other component to create a unique layout.
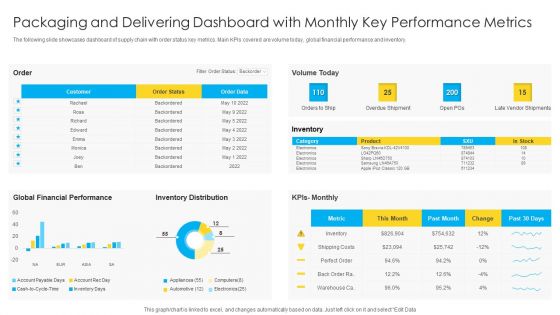
Packaging And Delivering Dashboard With Monthly Key Performance Metrics Microsoft PDF
The following slide showcases dashboard of supply chain with order status key metrics. Main KPIs covered are volume today, global financial performance and inventory. Pitch your topic with ease and precision using this Packaging And Delivering Dashboard With Monthly Key Performance Metrics Microsoft PDF. This layout presents information on Customer, Global Financial Performance, Inventory Distribution. It is also available for immediate download and adjustment. So, changes can be made in the color, design, graphics or any other component to create a unique layout.
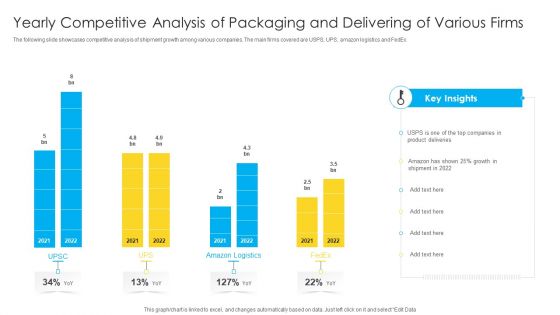
Yearly Competitive Analysis Of Packaging And Delivering Of Various Firms Professional PDF
The following slide showcases competitive analysis of shipment growth among various companies. The main firms covered are USPS, UPS, amazon logistics and FedEx. Pitch your topic with ease and precision using this Yearly Competitive Analysis Of Packaging And Delivering Of Various Firms Professional PDF. This layout presents information on Product Deliveries, Growth. It is also available for immediate download and adjustment. So, changes can be made in the color, design, graphics or any other component to create a unique layout.
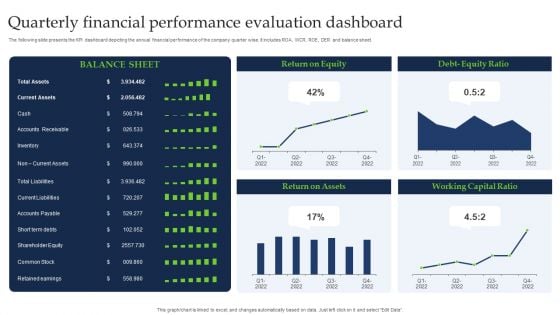
Quarterly Financial Performance Evaluation Dashboard Guidelines PDF
The following slide presents the KPI dashboard depicting the annual financial performance of the company quarter wise. It includes ROA, WCR, ROE, DER and balance sheet. Pitch your topic with ease and precision using this Quarterly Financial Performance Evaluation Dashboard Guidelines PDF. This layout presents information on Current Assets, Shareholder Equity, Common Stock. It is also available for immediate download and adjustment. So, changes can be made in the color, design, graphics or any other component to create a unique layout.
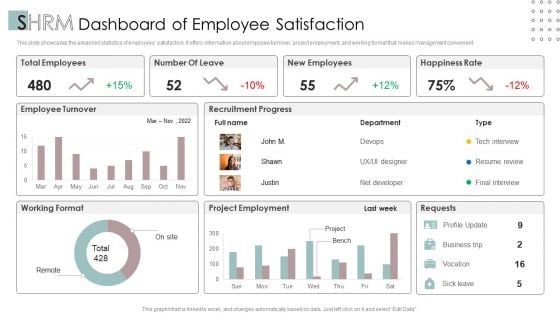
SHRM Dashboard Of Employee Satisfaction Ppt PowerPoint Presentation Styles Example File PDF
This slide showcases the advanced statistics of employees satisfaction. It offers information about employee turnover, project employment, and working format that makes management convenient.Pitch your topic with ease and precision using this SHRM Dashboard Of Employee Satisfaction Ppt PowerPoint Presentation Styles Example File PDF. This layout presents information on Total Employees, Happiness Rate, Project Employment. It is also available for immediate download and adjustment. So, changes can be made in the color, design, graphics or any other component to create a unique layout.
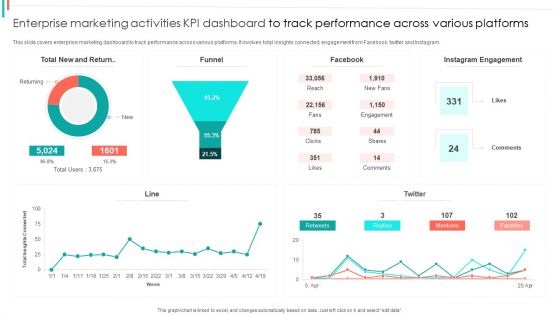
Enterprise Marketing Activities KPI Dashboard To Track Performance Across Various Platforms Ideas PDF
This slide covers enterprise marketing dashboard to track performance across various platforms. It involves total insights connected, engagement from Facebook, twitter and Instagram.Pitch your topic with ease and precision using this Enterprise Marketing Activities KPI Dashboard To Track Performance Across Various Platforms Ideas PDF. This layout presents information on Instagram Engagement, Comments, Returning. It is also available for immediate download and adjustment. So, changes can be made in the color, design, graphics or any other component to create a unique layout.
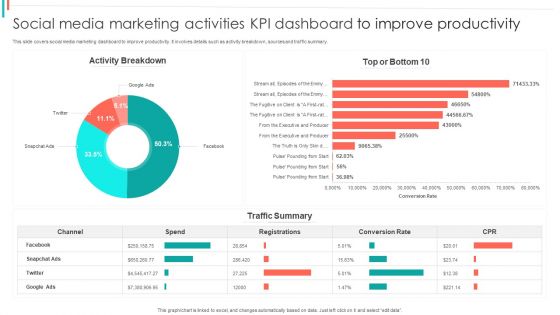
Social Media Marketing Activities KPI Dashboard To Improve Productivity Summary PDF
This slide covers social media marketing dashboard to improve productivity. It involves details such as activity breakdown, sources and traffic summary.Pitch your topic with ease and precision using this Social Media Marketing Activities KPI Dashboard To Improve Productivity Summary PDF. This layout presents information on Activity Breakdown, Conversion Rate, Traffic Summary. It is also available for immediate download and adjustment. So, changes can be made in the color, design, graphics or any other component to create a unique layout.
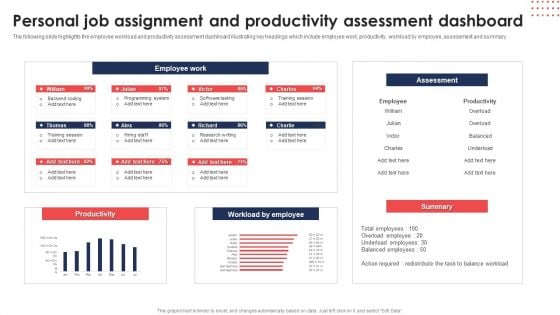
Personal Job Assignment And Productivity Assessment Dashboard Sample PDF
The following slide highlights the employee workload and productivity assessment dashboard illustrating key headings which include employee work, productivity, workload by employee, assessment and summary. Pitch your topic with ease and precision using this Personal Job Assignment And Productivity Assessment Dashboard Sample PDF. This layout presents information on Employee Work, Assessment, Productivity. It is also available for immediate download and adjustment. So, changes can be made in the color, design, graphics or any other component to create a unique layout.
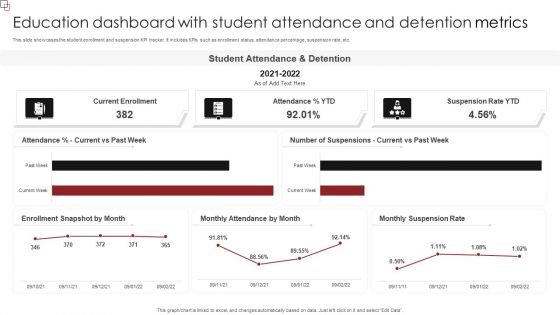
Education Dashboard With Student Attendance And Detention Metrics Inspiration PDF
This slide showcases the student enrollment and suspension KPI tracker. It includes KPIs such as enrollment status, attendance percentage, suspension rate, etc. Pitch your topic with ease and precision using this Education Dashboard With Student Attendance And Detention Metrics Inspiration PDF. This layout presents information on Student Attendance, Suspension Rate YTD, Current Enrollment. It is also available for immediate download and adjustment. So, changes can be made in the color, design, graphics or any other component to create a unique layout.
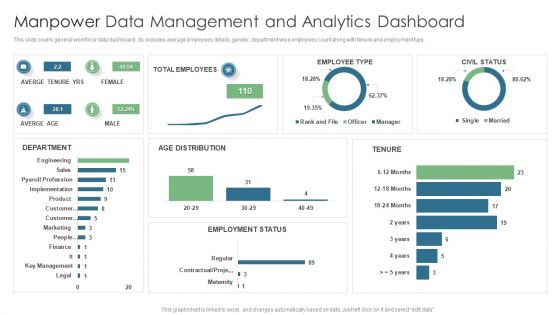
Manpower Data Management And Analytics Dashboard Topics PDF
This slide covers general workforce data dashboard . Its includes average employees details, gender, department wise employees count along with tenure and employment type. Pitch your topic with ease and precision using this Manpower Data Management And Analytics Dashboard Topics PDF. This layout presents information on Total Employees, Averge Tenure Yrs, Employee Type. It is also available for immediate download and adjustment. So, changes can be made in the color, design, graphics or any other component to create a unique layout.
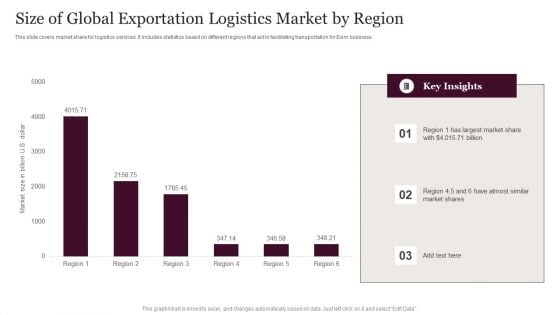
Size Of Global Exportation Logistics Market By Region Information PDF
This slide covers market share for logistics services. It includes statistics based on different regions that aid in facilitating transportation for Exim business. Pitch your topic with ease and precision using this Size Of Global Exportation Logistics Market By Region Information PDF. This layout presents information on Global Exportation Logistics, Market By Region. It is also available for immediate download and adjustment. So, changes can be made in the color, design, graphics or any other component to create a unique layout.
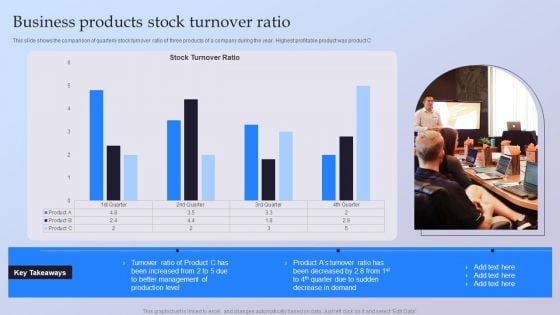
Business Products Stock Turnover Ratio Ppt File Aids PDF
This slide shows the comparison of quarterly stock turnover ratio of three products of a company during the year. Highest profitable product was product C Pitch your topic with ease and precision using this Business Products Stock Turnover Ratio Ppt File Aids PDF. This layout presents information on Better Management, Production Level, Turnover Ratio. It is also available for immediate download and adjustment. So, changes can be made in the color, design, graphics or any other component to create a unique layout.
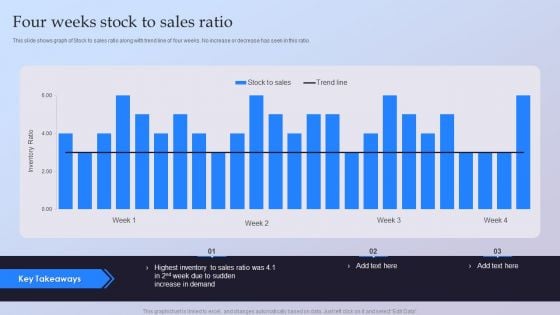
Four Weeks Stock To Sales Ratio Ppt Ideas Guide PDF
This slide shows graph of Stock to sales ratio along with trend line of four weeks. No increase or decrease has seen in this ratio. Pitch your topic with ease and precision using this Four Weeks Stock To Sales Ratio Ppt Ideas Guide PDF. This layout presents information on Highest Inventory, Sales Ratio, Increase Demand. It is also available for immediate download and adjustment. So, changes can be made in the color, design, graphics or any other component to create a unique layout.

Communication Barriers Manager Dashboard For Analyzing Ppt PowerPoint Presentation Inspiration Grid PDF
This slide represents the dashboard of communication manager. It includes KPIs such as current conversation, performance, customers and opportunities.Pitch your topic with ease and precision using this Communication Barriers Manager Dashboard For Analyzing Ppt PowerPoint Presentation Inspiration Grid PDF. This layout presents information on Current Conversation, Economic Indicator, Conversation Calls. It is also available for immediate download and adjustment. So, changes can be made in the color, design, graphics or any other component to create a unique layout.
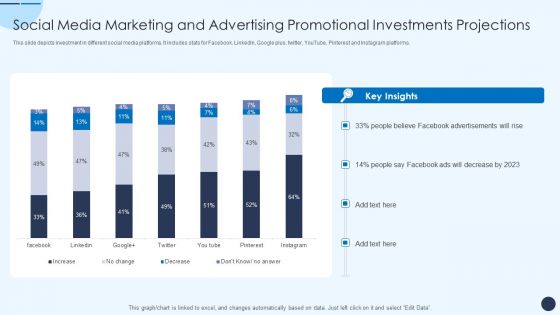
Social Media Marketing And Advertising Promotional Investments Projections Sample PDF
This slide depicts investment in different social media platforms. It includes stats for Facebook, LinkedIn, Google plus, twitter, YouTube, Pinterest and Instagram platforms.Pitch your topic with ease and precision using this Social Media Marketing And Advertising Promotional Investments Projections Sample PDF. This layout presents information on Advertisements, People Facebook, People Believe. It is also available for immediate download and adjustment. So, changes can be made in the color, design, graphics or any other component to create a unique layout.
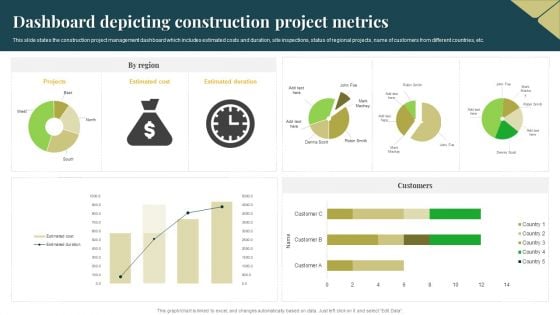
Dashboard Depicting Construction Project Metrics Inspiration PDF
This slide states the construction project management dashboard which includes estimated costs and duration, site inspections, status of regional projects, name of customers from different countries, etc. Pitch your topic with ease and precision using this Dashboard Depicting Construction Project Metrics Inspiration PDF. This layout presents information on Estimated Cost, Estimated Duration, Projects. It is also available for immediate download and adjustment. So, changes can be made in the color, design, graphics or any other component to create a unique layout.
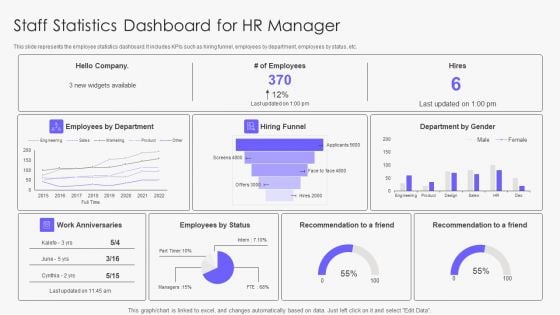
Staff Statistics Dashboard For Hr Manager Rules PDF
This slide represents the employee statistics dashboard. It includes KPIs such as hiring funnel, employees by department, employees by status, etc. Pitch your topic with ease and precision using this Staff Statistics Dashboard For Hr Manager Rules PDF. This layout presents information on Hiring Funnel, Employees By Status, Employees By Department. It is also available for immediate download and adjustment. So, changes can be made in the color, design, graphics or any other component to create a unique layout.
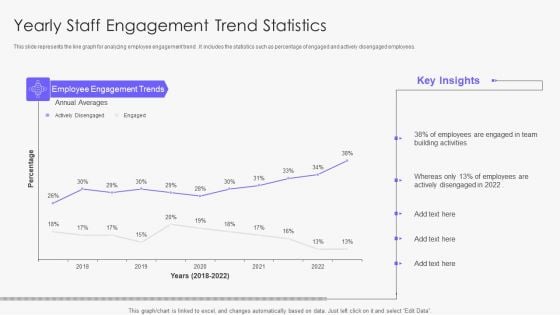
Yearly Staff Engagement Trend Statistics Demonstration PDF
This slide represents the line graph for analyzing employee engagement trend . It includes the statistics such as percentage of engaged and actively disengaged employees. Pitch your topic with ease and precision using this Yearly Staff Engagement Trend Statistics Demonstration PDF. This layout presents information on Team, Employees, Average. It is also available for immediate download and adjustment. So, changes can be made in the color, design, graphics or any other component to create a unique layout.
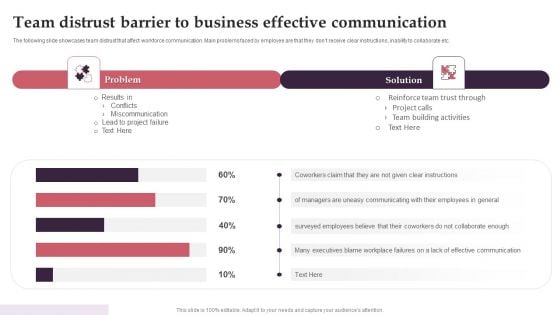
Team Distrust Barrier To Business Effective Communication Infographics PDF
The following slide showcases team distrust that affect workforce communication. Main problems faced by employee are that they dont receive clear instructions, inability to collaborate etc. Pitch your topic with ease and precision using this Team Distrust Barrier To Business Effective Communication Infographics PDF. This layout presents information on Team Distrust Barrier, Business Effective Communication. It is also available for immediate download and adjustment. So, changes can be made in the color, design, graphics or any other component to create a unique layout.
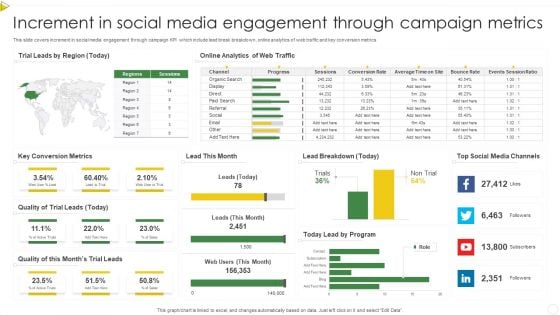
Increment In Social Media Engagement Through Campaign Metrics Professional PDF
This slide covers increment in social media engagement through campaign KPI which include lead break breakdown, online analytics of web traffic and key conversion metrics. Pitch your topic with ease and precision using this Increment In Social Media Engagement Through Campaign Metrics Professional PDF. This layout presents information on Quality, Key Conversion Metrics, Social Media. It is also available for immediate download and adjustment. So, changes can be made in the color, design, graphics or any other component to create a unique layout.
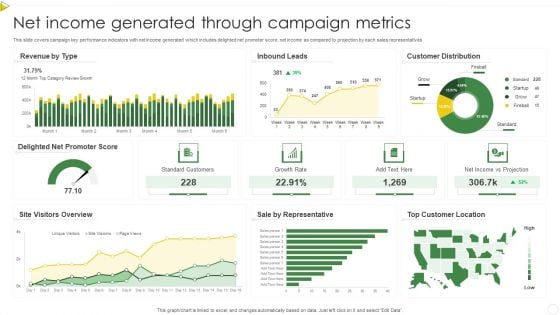
Net Income Generated Through Campaign Metrics Summary PDF
This slide covers campaign key performance indicators with net income generated which includes delighted net promoter score, net income as compared to projection by each sales representatives. Pitch your topic with ease and precision using this Net Income Generated Through Campaign Metrics Summary PDF. This layout presents information on Standard Customers, Growth Rate, Net Income. It is also available for immediate download and adjustment. So, changes can be made in the color, design, graphics or any other component to create a unique layout.
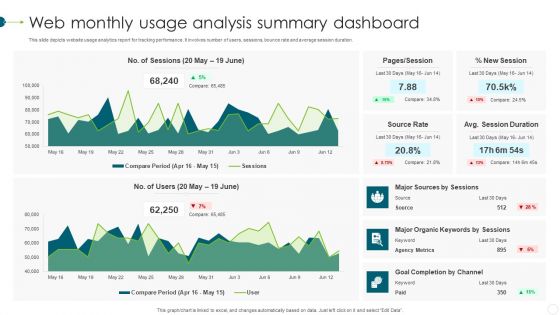
Web Monthly Usage Analysis Summary Dashboard Clipart PDF
This slide depicts website usage analytics report for tracking performance. It involves number of users, sessions, bounce rate and average session duration. Pitch your topic with ease and precision using this Web Monthly Usage Analysis Summary Dashboard Clipart PDF. This layout presents information on Agency Metrics, Source Rate, Goal. It is also available for immediate download and adjustment. So, changes can be made in the color, design, graphics or any other component to create a unique layout.
Insurance Claim Procedure Tracking Dashboard Ppt PowerPoint Presentation Show Samples PDF
This slide showcases the insurance claim process tracking dashboard. It includes elements such as claim amount, payout and denied claims and status analysis.Pitch your topic with ease and precision using this Insurance Claim Procedure Tracking Dashboard Ppt PowerPoint Presentation Show Samples PDF. This layout presents information on Amount Comparison, Claim Expense, Assured Amount. It is also available for immediate download and adjustment. So, changes can be made in the color, design, graphics or any other component to create a unique layout.
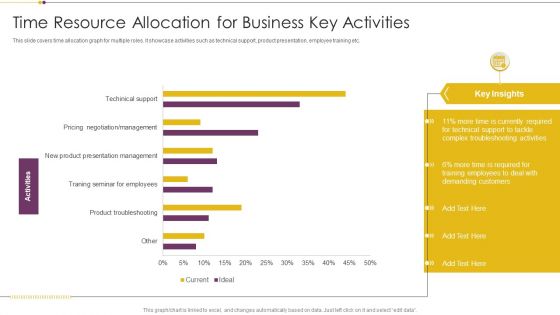
Time Resource Allocation For Business Key Activities Infographics PDF
This slide covers time allocation graph for multiple roles. It showcase activities such as technical support, product presentation, employee training etc. Pitch your topic with ease and precision using this Time Resource Allocation For Business Key Activities Infographics PDF. This layout presents information on Currently Required, Demanding Customers, Training Employees. It is also available for immediate download and adjustment. So, changes can be made in the color, design, graphics or any other component to create a unique layout.
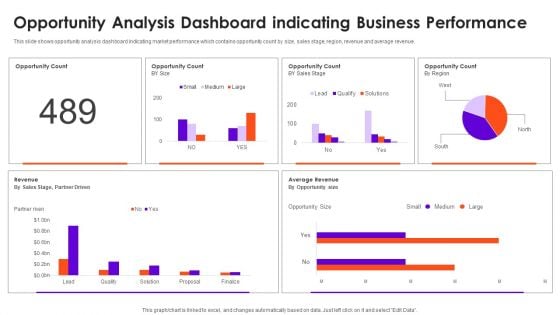
Opportunity Analysis Dashboard Indicating Business Performance Information Rules PDF
This slide shows opportunity analysis dashboard indicating market performance which contains opportunity count by size, sales stage, region, revenue and average revenue. Pitch your topic with ease and precision using this Opportunity Analysis Dashboard Indicating Business Performance Information Rules PDF. This layout presents information on Opportunity Count, Revenue, Sales. It is also available for immediate download and adjustment. So, changes can be made in the color, design, graphics or any other component to create a unique layout.
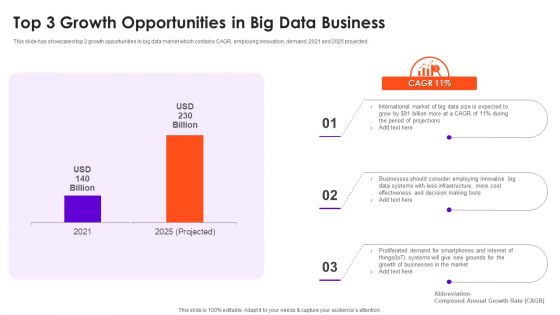
Top 3 Growth Opportunities In Big Data Business Download PDF
This slide has showcased top 3 growth opportunities in big data market which contains CAGR, employing innovation, demand, 2021 and 2025 projected. Pitch your topic with ease and precision using this Top 3 Growth Opportunities In Big Data Business Download PDF. This layout presents information on Cost, Businesses, Data Systems. It is also available for immediate download and adjustment. So, changes can be made in the color, design, graphics or any other component to create a unique layout.
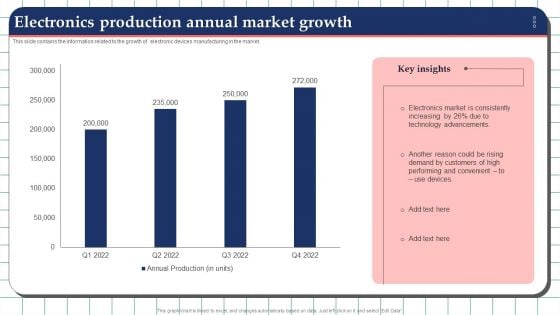
Electronics Production Annual Market Growth Graphics PDF
This slide contains the information related to the growth of electronic devices manufacturing in the market. Pitch your topic with ease and precision using this Electronics Production Annual Market Growth Graphics PDF. This layout presents information on hnology Advancements, Electronics Market, Demand. It is also available for immediate download and adjustment. So, changes can be made in the color, design, graphics or any other component to create a unique layout.
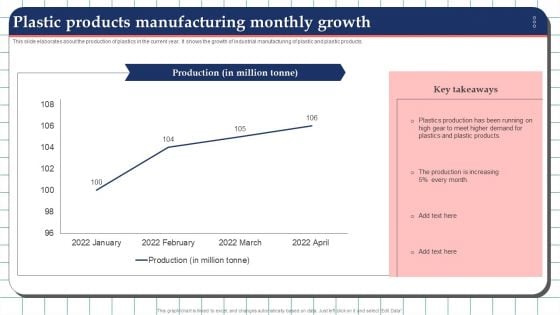
Plastic Products Manufacturing Monthly Growth Guidelines PDF
This slide elaborates about the production of plastics in the current year. It shows the growth of industrial manufacturing of plastic and plastic products. Pitch your topic with ease and precision using this Plastic Products Manufacturing Monthly Growth Guidelines PDF. This layout presents information on Production, Demand, Manufacturing Monthly Growth. It is also available for immediate download and adjustment. So, changes can be made in the color, design, graphics or any other component to create a unique layout.
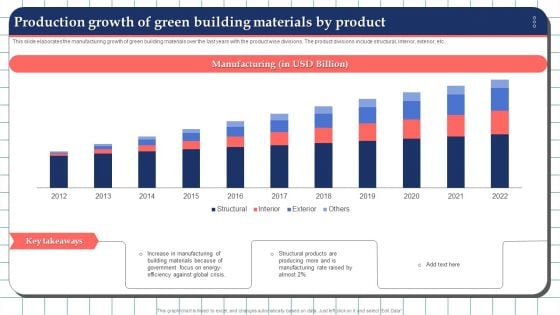
Production Growth Of Green Building Materials By Product Formats PDF
This slide elaborates the manufacturing growth of green building materials over the last years with the product wise divisions. The product divisions include structural, interior, exterior, etc. Pitch your topic with ease and precision using this Production Growth Of Green Building Materials By Product Formats PDF. This layout presents information on Manufacturing, Materials, Global Crisis. It is also available for immediate download and adjustment. So, changes can be made in the color, design, graphics or any other component to create a unique layout.
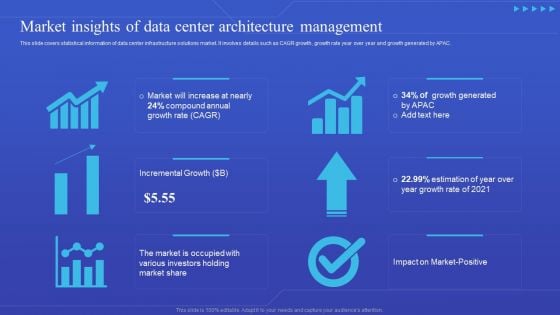
Market Insights Of Data Center Architecture Management Elements PDF
This slide covers statistical information of data center infrastructure solutions market. It involves details such as CAGR growth, growth rate year over year and growth generated by APAC. Pitch your topic with ease and precision using this Market Insights Of Data Center Architecture Management Elements PDF. This layout presents information on Growth Rate, Market, Investors. It is also available for immediate download and adjustment. So, changes can be made in the color, design, graphics or any other component to create a unique layout.
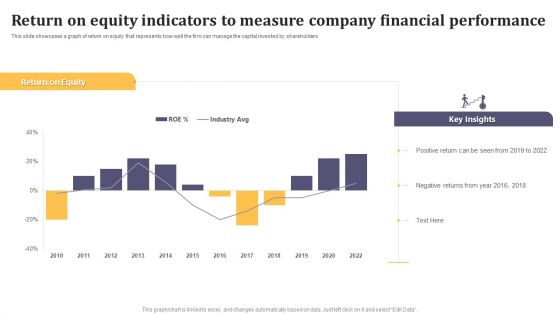
Return On Equity Indicators To Measure Company Financial Performance Mockup PDF
This slide showcases a graph of return on equity that represents how well the firm can manage the capital invested by shareholders. Pitch your topic with ease and precision using this Return On Equity Indicators To Measure Company Financial Performance Mockup PDF. This layout presents information on Return On Equity, Key Insights, Positive Return. It is also available for immediate download and adjustment. So, changes can be made in the color, design, graphics or any other component to create a unique layout.
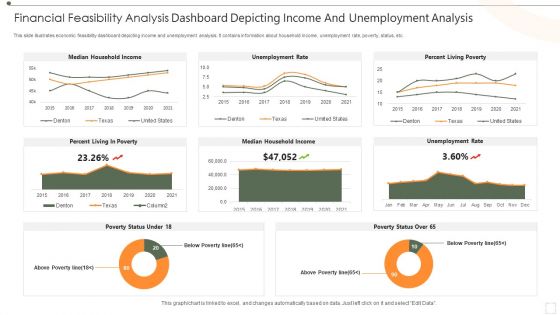
Financial Feasibility Analysis Dashboard Depicting Income And Unemployment Analysis Download PDF
This slide illustrates economic feasibility dashboard depicting income and unemployment analysis. It contains information about household income, unemployment rate, poverty, status, etc. Pitch your topic with ease and precision using this Financial Feasibility Analysis Dashboard Depicting Income And Unemployment Analysis Download PDF. This layout presents information on Median Household Income, Unemployment Rate, Percent Living Poverty. It is also available for immediate download and adjustment. So, changes can be made in the color, design, graphics or any other component to create a unique layout.
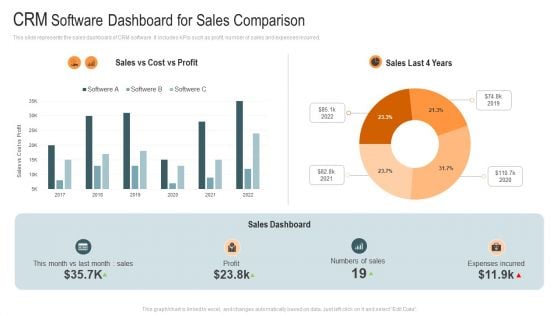
CRM Software Dashboard For Sales Comparison Mockup PDF
This slide represents the sales dashboard of CRM software. It includes KPIs such as profit, number of sales and expenses incurred. Pitch your topic with ease and precision using this CRM Software Dashboard For Sales Comparison Mockup PDF. This layout presents information on Profit, Sales Dashboard, Expenses Incurred. It is also available for immediate download and adjustment. So, changes can be made in the color, design, graphics or any other component to create a unique layout.
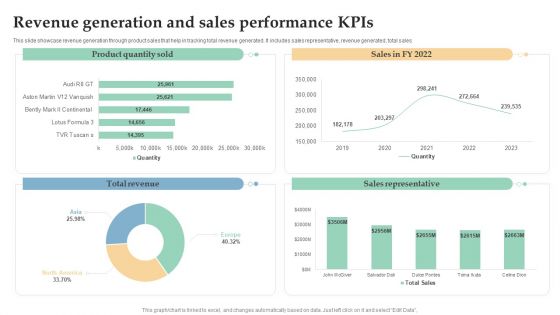
Revenue Generation And Sales Performance Kpis Ppt Inspiration Background Image PDF
This slide showcase revenue generation through product sales that help in tracking total revenue generated. It includes sales representative, revenue generated, total sales. Pitch your topic with ease and precision using this Revenue Generation And Sales Performance Kpis Ppt Inspiration Background Image PDF. This layout presents information on Total Revenue, Sales Representative, Product Quantity Sold. It is also available for immediate download and adjustment. So, changes can be made in the color, design, graphics or any other component to create a unique layout.
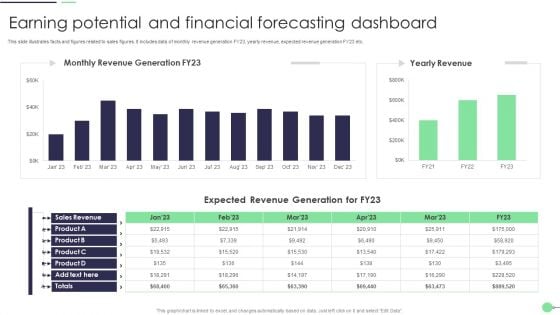
Earning Potential And Financial Forecasting Dashboard Summary PDF
This slide illustrates facts and figures related to sales figures. It includes data of monthly revenue generation FY23, yearly revenue, expected revenue generation FY23 etc. Pitch your topic with ease and precision using this Earning Potential And Financial Forecasting Dashboard Summary PDF. This layout presents information on Sales Revenue, Expected Revenue, Product. It is also available for immediate download and adjustment. So, changes can be made in the color, design, graphics or any other component to create a unique layout.
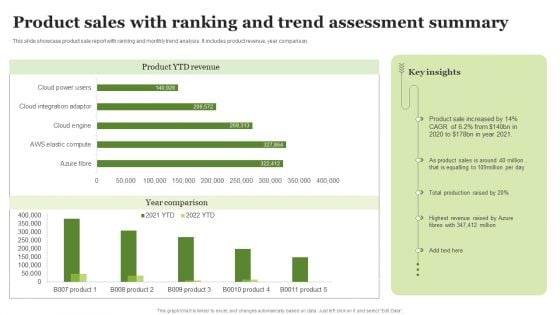
Product Sales With Ranking And Trend Assessment Summary Ppt PowerPoint Presentation Portfolio Images PDF
This slide showcase product sale report with ranking and monthly trend analysis. It includes product revenue, year comparison.Pitch your topic with ease and precision using this Product Sales With Ranking And Trend Assessment Summary Ppt PowerPoint Presentation Portfolio Images PDF. This layout presents information on Highest Revenue, Total Production, Product Sales. It is also available for immediate download and adjustment. So, changes can be made in the color, design, graphics or any other component to create a unique layout.
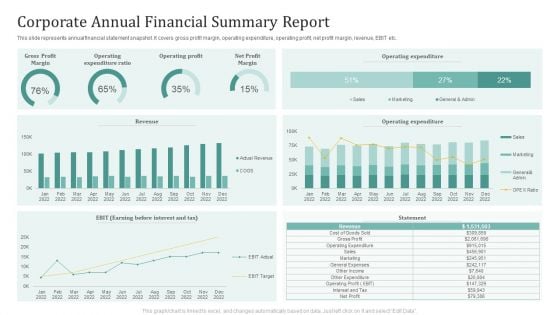
Corporate Annual Financial Summary Report Ppt Portfolio Skills PDF
This slide represents annual financial statement snapshot. It covers gross profit margin, operating expenditure, operating profit, net profit margin, revenue, EBIT etc. Pitch your topic with ease and precision using this Corporate Annual Financial Summary Report Ppt Portfolio Skills PDF. This layout presents information on Operating Expenditure Ratio, Operating Profit, Net Profit Margin. It is also available for immediate download and adjustment. So, changes can be made in the color, design, graphics or any other component to create a unique layout.
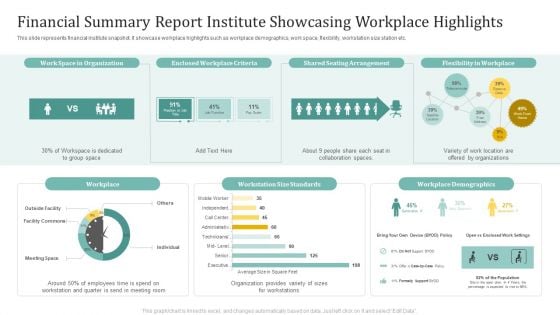
Financial Summary Report Institute Showcasing Workplace Highlights Ppt Infographics Inspiration PDF
This slide represents financial institute snapshot. It showcase workplace highlights such as workplace demographics, work space, flexibility, workstation size station etc. Pitch your topic with ease and precision using this Financial Summary Report Institute Showcasing Workplace Highlights Ppt Infographics Inspiration PDF. This layout presents information on Shared Seating Arrangement, Flexibility Workplace, Workplace. It is also available for immediate download and adjustment. So, changes can be made in the color, design, graphics or any other component to create a unique layout.
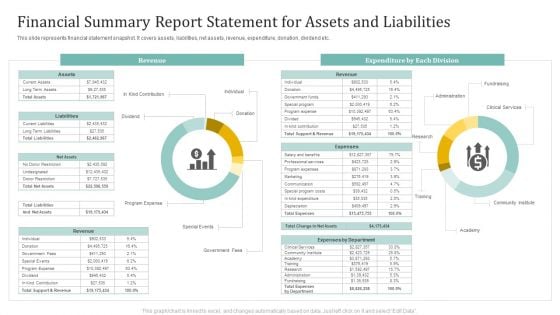
Financial Summary Report Statement For Assets And Liabilities Ppt Slides Guide PDF
This slide represents financial statement snapshot. It covers assets, liabilities, net assets, revenue, expenditure, donation, dividend etc. Pitch your topic with ease and precision using this Financial Summary Report Statement For Assets And Liabilities Ppt Slides Guide PDF. This layout presents information on Revenue, Expenditure Each Division, Fundraising. It is also available for immediate download and adjustment. So, changes can be made in the color, design, graphics or any other component to create a unique layout.
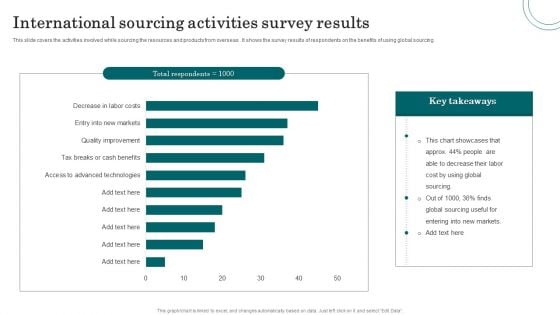
International Sourcing Activities Survey Results Microsoft PDF
This slide covers the activities involved while sourcing the resources and products from overseas . It shows the survey results of respondents on the benefits of using global sourcing. Pitch your topic with ease and precision using this International Sourcing Activities Survey Results Microsoft PDF. This layout presents information on Global Sourcing, Labor Cost, Markets. It is also available for immediate download and adjustment. So, changes can be made in the color, design, graphics or any other component to create a unique layout.
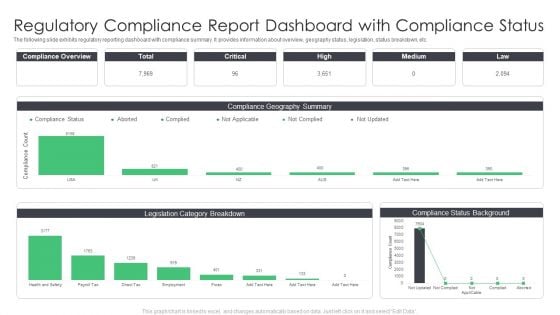
Regulatory Compliance Report Dashboard With Compliance Status Infographics PDF
The following slide exhibits regulatory reporting dashboard with compliance summary. It provides information about overview, geography status, legislation, status breakdown, etc. Pitch your topic with ease and precision using this Regulatory Compliance Report Dashboard With Compliance Status Infographics PDF. This layout presents information on Dashboard With Compliance Status, Regulatory Compliance Report. It is also available for immediate download and adjustment. So, changes can be made in the color, design, graphics or any other component to create a unique layout.
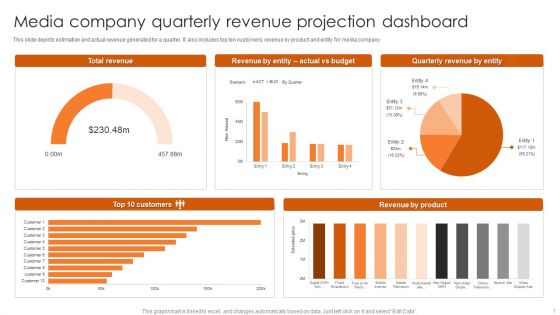
Media Company Quarterly Revenue Projection Dashboard Mockup PDF
This slide depicts estimation and actual revenue generated for a quarter. It also includes top ten customers, revenue by product and entity for media company. Pitch your topic with ease and precision using this Media Company Quarterly Revenue Projection Dashboard Mockup PDF. This layout presents information on Total Revenue, Quarterly Revenue Entity, Top 10 Customers. It is also available for immediate download and adjustment. So, changes can be made in the color, design, graphics or any other component to create a unique layout.
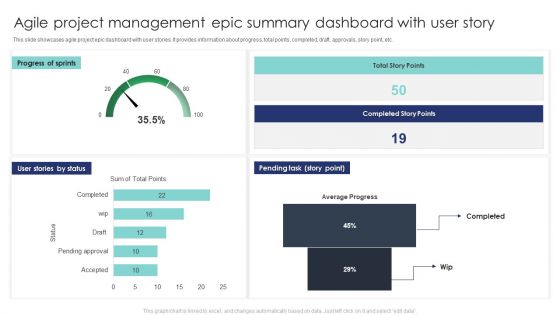
Agile Project Management Epic Summary Dashboard With User Story Formats PDF
This slide showcases agile project epic dashboard with user stories. It provides information about progress, total points, completed, draft, approvals, story point, etc. Pitch your topic with ease and precision using this Agile Project Management Epic Summary Dashboard With User Story Formats PDF. This layout presents information on Pending Tast, Progress Sprints, User Stories Status. It is also available for immediate download and adjustment. So, changes can be made in the color, design, graphics or any other component to create a unique layout.
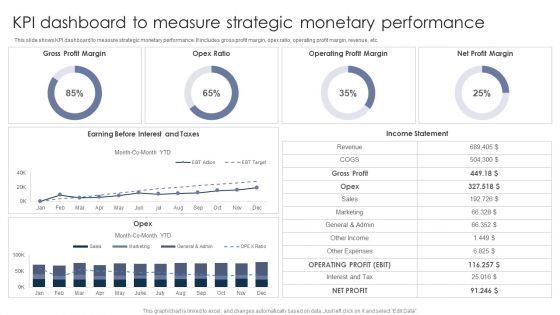
KPI Dashboard To Measure Strategic Monetary Performance Graphics PDF
This slide shows KPI dashboard to measure strategic monetary performance. It includes gross profit margin, opex ratio, operating profit margin, revenue, etc. Pitch your topic with ease and precision using this KPI Dashboard To Measure Strategic Monetary Performance Graphics PDF. This layout presents information on Gross Profit Margin, Opex Ratio, Operating Profit Margin. It is also available for immediate download and adjustment. So, changes can be made in the color, design, graphics or any other component to create a unique layout.
Workforce Productivity Tracking Report Slide2 Professional PDF
The following slide highlights the KPIs of work streams to identify the threats and formulate strategies to mitigate its effect. It includes elements such as summary, health report etc. Pitch your topic with ease and precision using this Workforce Productivity Tracking Report Slide2 Professional PDF. This layout presents information on Sales, Issues, Budget, Workforce. It is also available for immediate download and adjustment. So, changes can be made in the color, design, graphics or any other component to create a unique layout.
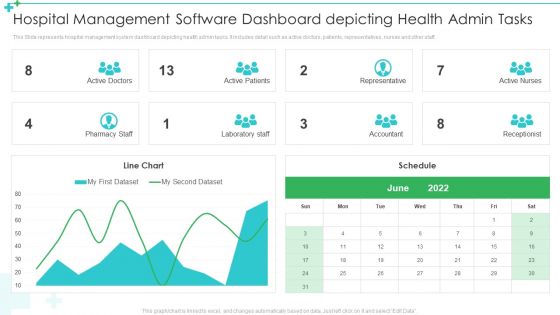
Hospital Management Software Dashboard Depicting Health Admin Tasks Ppt Pictures Inspiration PDF
This Slide represents hospital management system dashboard depicting health admin tasks. It includes detail such as active doctors, patients, representatives, nurses and other staff. Pitch your topic with ease and precision using this Hospital Management Software Dashboard Depicting Health Admin Tasks Ppt Pictures Inspiration PDF. This layout presents information on Active Doctors, Active Patients, Representative. It is also available for immediate download and adjustment. So, changes can be made in the color, design, graphics or any other component to create a unique layout.
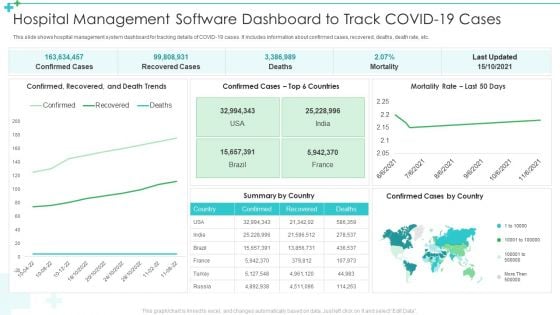
Hospital Management Software Dashboard To Track Covid 19 Cases Ppt Professional Inspiration PDF
This slide shows hospital management system dashboard for tracking details of COVID-19 cases. It includes information about confirmed cases, recovered, deaths, death rate, etc. Pitch your topic with ease and precision using this Hospital Management Software Dashboard To Track Covid 19 Cases Ppt Professional Inspiration PDF. This layout presents information on Recovered Cases, Deaths, Mortality. It is also available for immediate download and adjustment. So, changes can be made in the color, design, graphics or any other component to create a unique layout.
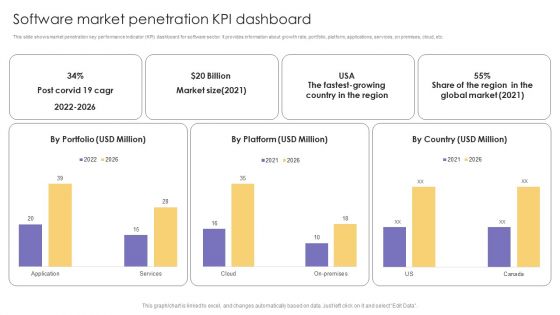
Software Market Penetration KPI Dashboard Ppt Outline Aids PDF
This slide shows market penetration key performance indicator KPI dashboard for software sector. It provides information about growth rate, portfolio, platform, applications, services, on premises, cloud, etc. Pitch your topic with ease and precision using this Software Market Penetration KPI Dashboard Ppt Outline Aids PDF. This layout presents information on Market Size, Global Market, Cloud. It is also available for immediate download and adjustment. So, changes can be made in the color, design, graphics or any other component to create a unique layout.
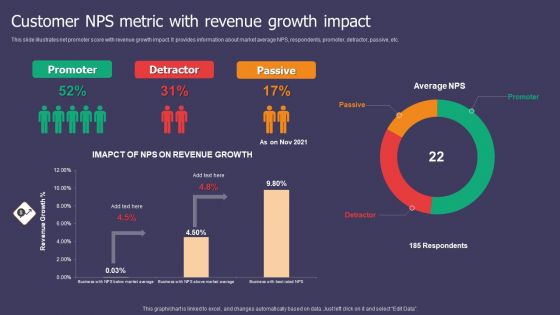
Customer NPS Metric With Revenue Growth Impact Ppt Show Portrait PDF
This slide illustrates net promoter score with revenue growth impact. It provides information about market average NPS, respondents, promoter, detractor, passive, etc. Pitch your topic with ease and precision using this Customer NPS Metric With Revenue Growth Impact Ppt Show Portrait PDF. This layout presents information on Promoter, Detractor, Passive. It is also available for immediate download and adjustment. So, changes can be made in the color, design, graphics or any other component to create a unique layout.
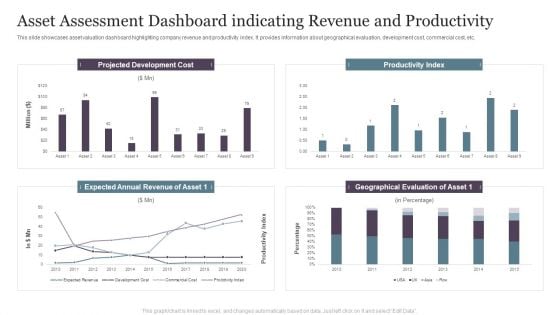
Asset Assessment Dashboard Indicating Revenue And Productivity Infographics PDF
This slide showcases asset valuation dashboard highlighting company revenue and productivity index. It provides information about geographical evaluation, development cost, commercial cost, etc.Pitch your topic with ease and precision using this Asset Assessment Dashboard Indicating Revenue And Productivity Infographics PDF. This layout presents information on Projected Development, Productivity Index, Geographical Evaluation. It is also available for immediate download and adjustment. So, changes can be made in the color, design, graphics or any other component to create a unique layout.
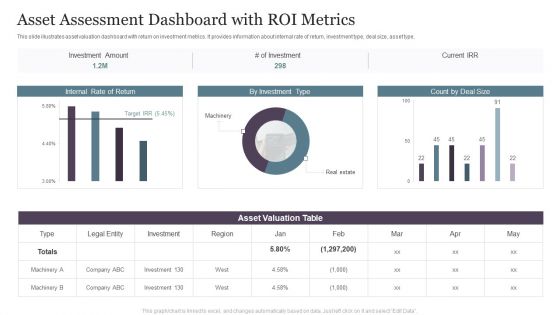
Asset Assessment Dashboard With ROI Metrics Topics PDF
This slide illustrates asset valuation dashboard with return on investment metrics. It provides information about internal rate of return, investment type, deal size, asset type, Pitch your topic with ease and precision using this Asset Assessment Dashboard With ROI Metrics Topics PDF. This layout presents information on Investment Amount, Asset Valuation, Internal Return. It is also available for immediate download and adjustment. So, changes can be made in the color, design, graphics or any other component to create a unique layout.
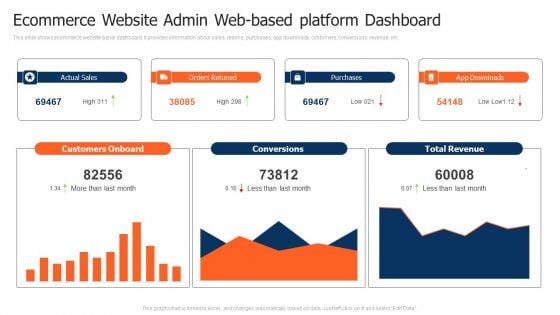
Ecommerce Website Admin Web Based Platform Dashboard Pictures PDF
This slide shows ecommerce website panel dashboard. It provides information about sales, returns, purchases, app downloads, customers, conversions, revenue, etc. Pitch your topic with ease and precision using this Ecommerce Website Admin Web Based Platform Dashboard Pictures PDF. This layout presents information on Customers Onboard, Purchases, Total Revenue. It is also available for immediate download and adjustment. So, changes can be made in the color, design, graphics or any other component to create a unique layout.
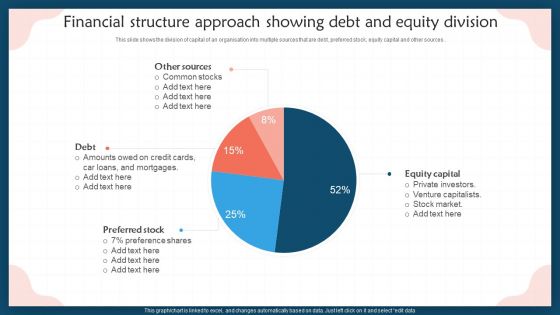
Financial Structure Approach Showing Debt And Equity Division Introduction PDF
This slide shows the division of capital of an organisation into multiple sources that are debt, preferred stock, equity capital and other sources . Pitch your topic with ease and precision using this Financial Structure Approach Showing Debt And Equity Division Introduction PDF. This layout presents information on Other Sources, Preferred Stock, Equity Capital, Debt. It is also available for immediate download and adjustment. So, changes can be made in the color, design, graphics or any other component to create a unique layout.
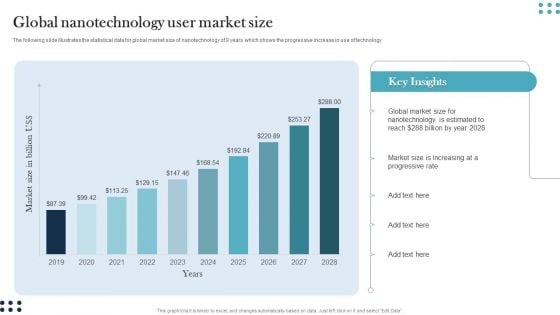
Global Nanotechnology User Market Size Guidelines PDF
The following slide illustrates the statistical data for global market size of nanotechnology of 9 years which shows the progressive increase in use of technology. Pitch your topic with ease and precision using this Global Nanotechnology User Market Size Guidelines PDF. This layout presents information on Global Market Size, Nanotechnology, Estimated To Reach. It is also available for immediate download and adjustment. So, changes can be made in the color, design, graphics or any other component to create a unique layout.
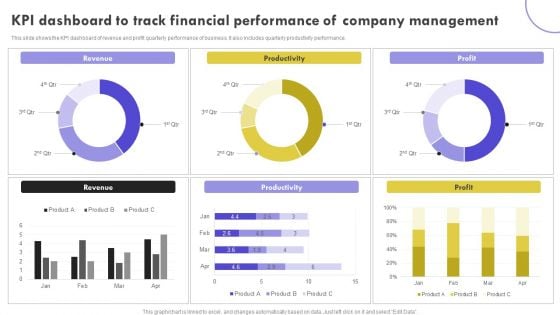
KPI Dashboard To Track Financial Performance Of Company Management Clipart PDF
This slide shows the KPI dashboard of revenue and profit quarterly performance of business. It also includes quarterly productivity performance. Pitch your topic with ease and precision using this KPI Dashboard To Track Financial Performance Of Company Management Clipart PDF. This layout presents information on Revenue, Productivity, Profit. It is also available for immediate download and adjustment. So, changes can be made in the color, design, graphics or any other component to create a unique layout.

KPI Dashboard Of Customer And Product Sales Performance Comparison Information PDF
This slide shows the KPI dashboard of client and product sales comparison. It also includes sales by location and total sales. Pitch your topic with ease and precision using this KPI Dashboard Of Customer And Product Sales Performance Comparison Information PDF. This layout presents information on Product Sales, Client Sales, Tim Santana. It is also available for immediate download and adjustment. So, changes can be made in the color, design, graphics or any other component to create a unique layout.


 Continue with Email

 Home
Home


