Hierarchy Chart Organizational
Service Desk Tracker Sheet To Monitor Status Of Ticket Professional PDF
This slide showcases tracker sheet that includes ticket details. It includes ticket number, priority, description, reported date and responsible person. Pitch your topic with ease and precision using this Service Desk Tracker Sheet To Monitor Status Of Ticket Professional PDF. This layout presents information on Ticket Number, Description, Responsible Person. It is also available for immediate download and adjustment. So, changes can be made in the color, design, graphics or any other component to create a unique layout.
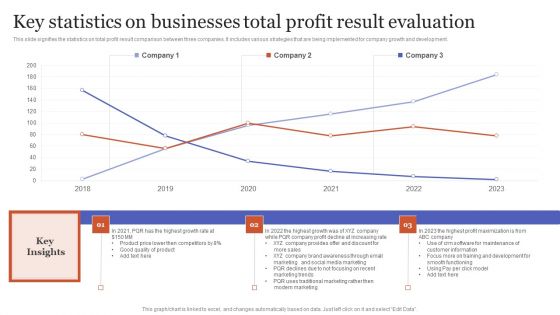
Key Statistics On Businesses Total Profit Result Evaluation Rules PDF
This slide signifies the statistics on total profit result comparison between three companies. It includes various strategies that are being implemented for company growth and development.Pitch your topic with ease and precision using this Key Statistics On Businesses Total Profit Result Evaluation Rules PDF. This layout presents information on Traditional Marketing, Modern Marketing, Training Development. It is also available for immediate download and adjustment. So, changes can be made in the color, design, graphics or any other component to create a unique layout.
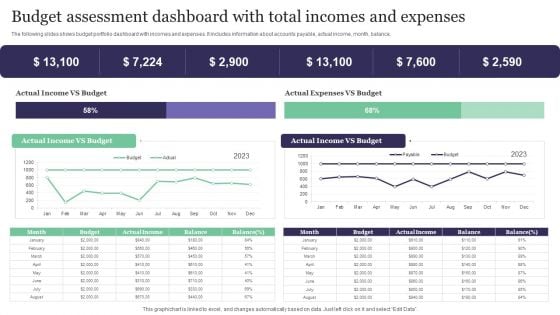
Budget Assessment Dashboard With Total Incomes And Expenses Information PDF
The following slides shows budget portfolio dashboard with incomes and expenses. It includes information about accounts payable, actual income, month, balance, Pitch your topic with ease and precision using this Budget Assessment Dashboard With Total Incomes And Expenses Information PDF. This layout presents information on Actual Income, Actual Expenses. It is also available for immediate download and adjustment. So, changes can be made in the color, design, graphics or any other component to create a unique layout.
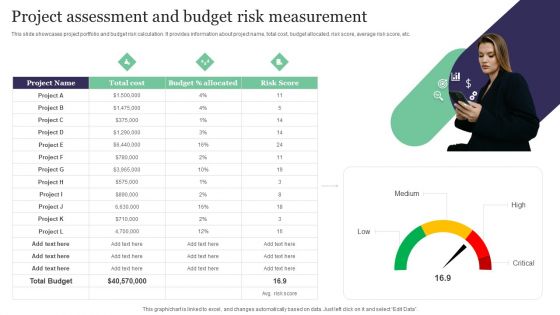
Project Assessment And Budget Risk Measurement Pictures PDF
This slide showcases project portfolio and budget risk calculation. It provides information about project name, total cost, budget allocated, risk score, average risk score, etc. Pitch your topic with ease and precision using this Project Assessment And Budget Risk Measurement Pictures PDF. This layout presents information on Project Assessment, Budget Risk, Measurement. It is also available for immediate download and adjustment. So, changes can be made in the color, design, graphics or any other component to create a unique layout.
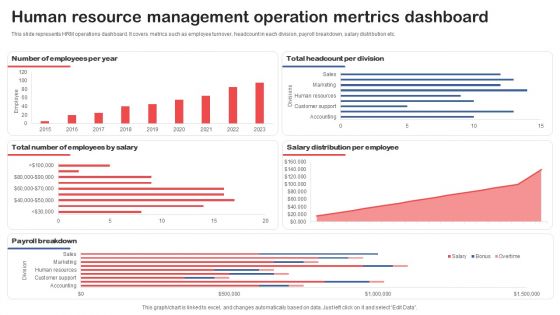
Human Resource Management Operation Mertrics Dashboard Background PDF
This slide represents HRM operations dashboard. It covers metrics such as employee turnover, headcount in each division, payroll breakdown, salary distribution etc. Pitch your topic with ease and precision using thisHuman Resource Management Operation Mertrics Dashboard Background PDF. This layout presents information on Number Of Employees, Headcount Per Division, Employees By Salary. It is also available for immediate download and adjustment. So, changes can be made in the color, design, graphics or any other component to create a unique layout.
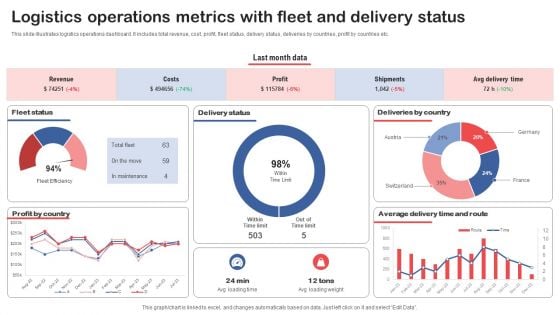
Logistics Operations Metrics With Fleet And Delivery Status Slides PDF
This slide illustrates logistics operations dashboard. It includes total revenue, cost, profit, fleet status, delivery status, deliveries by countries, profit by countries etc. Pitch your topic with ease and precision using this Logistics Operations Metrics With Fleet And Delivery Status Slides PDF. This layout presents information on Fleet Status, Delivery Status, Deliveries By Country. It is also available for immediate download and adjustment. So, changes can be made in the color, design, graphics or any other component to create a unique layout.
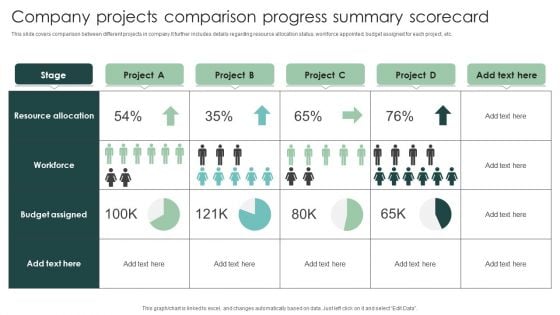
Company Projects Comparison Progress Summary Scorecard Portrait PDF
This slide covers comparison between different projects in company.It further includes details regarding resource allocation status, workforce appointed, budget assigned for each project, etc. Pitch your topic with ease and precision using this Company Projects Comparison Progress Summary Scorecard Portrait PDF. This layout presents information on Resource Allocation, Budget Assigned, Workforce. It is also available for immediate download and adjustment. So, changes can be made in the color, design, graphics or any other component to create a unique layout.
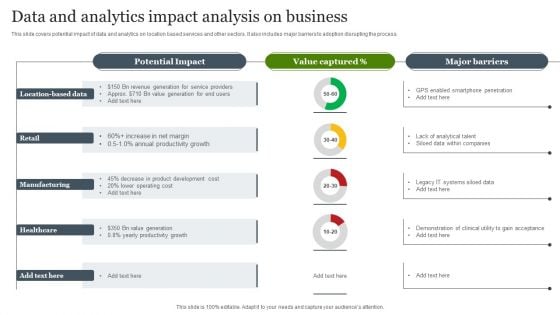
Data And Analytics Impact Analysis On Business Slides PDF
This slide covers potential impact of data and analytics on location based services and other sectors. It also includes major barriers to adoption disrupting the process. Pitch your topic with ease and precision using this Data And Analytics Impact Analysis On Business Slides PDF. This layout presents information on Retail, Manufacturing, Location Based Data. It is also available for immediate download and adjustment. So, changes can be made in the color, design, graphics or any other component to create a unique layout.
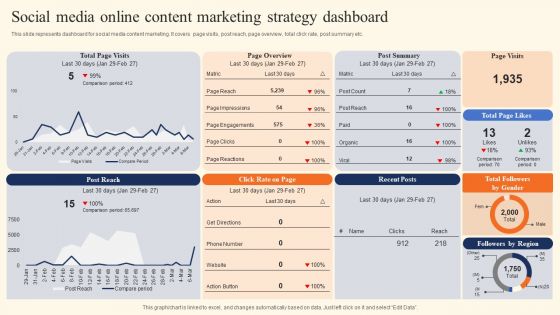
Social Media Online Content Marketing Strategy Dashboard Clipart PDF
This slide represents dashboard for social media content marketing. It covers page visits, post reach, page overview, total click rate, post summary etc. Pitch your topic with ease and precision using this Social Media Online Content Marketing Strategy Dashboard Clipart PDF. This layout presents information on Social Media, Online Content Marketing, Strategy Dashboard. It is also available for immediate download and adjustment. So, changes can be made in the color, design, graphics or any other component to create a unique layout.
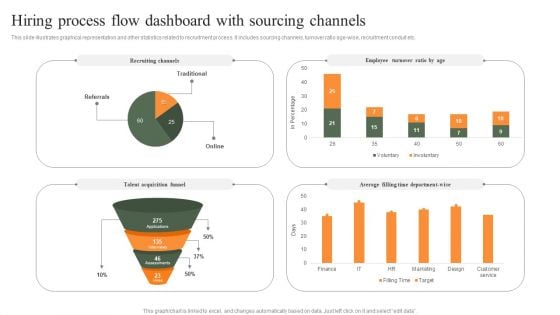
Hiring Process Flow Dashboard With Sourcing Channels Professional PDF
This slide illustrates graphical representation and other statistics related to recruitment process. It includes sourcing channels, turnover ratio age-wise, recruitment conduit etc. Pitch your topic with ease and precision using this Hiring Process Flow Dashboard With Sourcing Channels Professional PDF. This layout presents information on Employee Turnover Ratio, Recruiting Channels, Average. It is also available for immediate download and adjustment. So, changes can be made in the color, design, graphics or any other component to create a unique layout.
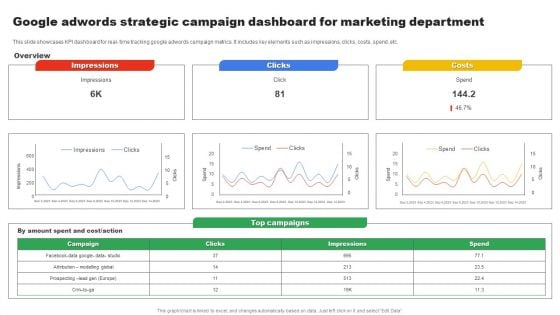
Google Adwords Strategic Campaign Dashboard For Marketing Department Download PDF
This slide showcases KPI dashboard for real time tracking google adwords campaign metrics. It includes key elements such as impressions, clicks, costs, spend, etc. Pitch your topic with ease and precision using this Google Adwords Strategic Campaign Dashboard For Marketing Department Download PDF. This layout presents information on Impressions, Clicks, Costs. It is also available for immediate download and adjustment. So, changes can be made in the color, design, graphics or any other component to create a unique layout.
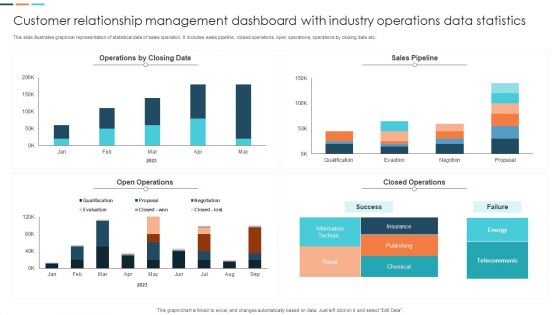
Customer Relationship Management Dashboard With Industry Operations Data Statistics Pictures PDF
This slide illustrates graphical representation of statistical data of sales operation. It includes sales pipeline, closed operations, open operations, operations by closing date etc. Pitch your topic with ease and precision using this Customer Relationship Management Dashboard With Industry Operations Data Statistics Pictures PDF. This layout presents information on Sales Pipeline, Insurance, Telecommunic. It is also available for immediate download and adjustment. So, changes can be made in the color, design, graphics or any other component to create a unique layout.
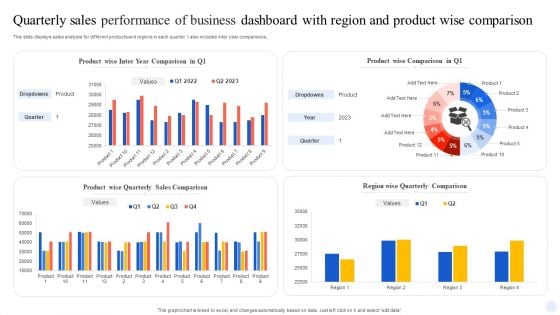
Quarterly Sales Performance Of Business Dashboard With Region And Product Wise Comparison Guidelines PDF
This slide displays sales analysis for different products and regions in each quarter. t also includes inter year comparisons. Pitch your topic with ease and precision using this Quarterly Sales Performance Of Business Dashboard With Region And Product Wise Comparison Guidelines PDF. This layout presents information on Product Wise Quarterly Sales, Comparison. It is also available for immediate download and adjustment. So, changes can be made in the color, design, graphics or any other component to create a unique layout.
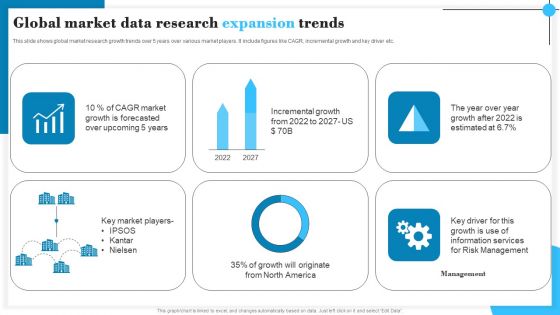
Global Market Data Research Expansion Trends Graphics PDF
This slide shows global market research growth trends over 5 years over various market players. It include figures like CAGR, incremental growth and key driver etc. Pitch your topic with ease and precision using this Global Market Data Research Expansion Trends Graphics PDF. This layout presents information on CAGR Market, Incremental Growth, Management. It is also available for immediate download and adjustment. So, changes can be made in the color, design, graphics or any other component to create a unique layout.
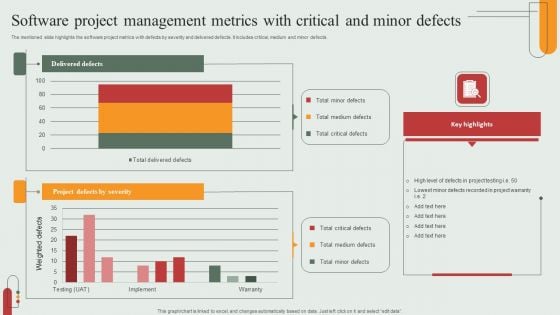
Software Project Management Metrics With Critical And Minor Defects Rules PDF
The mentioned slide highlights the software project metrics with defects by severity and delivered defects. It includes critical, medium and minor defects. Pitch your topic with ease and precision using this Software Project Management Metrics With Critical And Minor Defects Rules PDF. This layout presents information on Delivered Defects, Project Defects Severity, Critical Defects. It is also available for immediate download and adjustment. So, changes can be made in the color, design, graphics or any other component to create a unique layout.
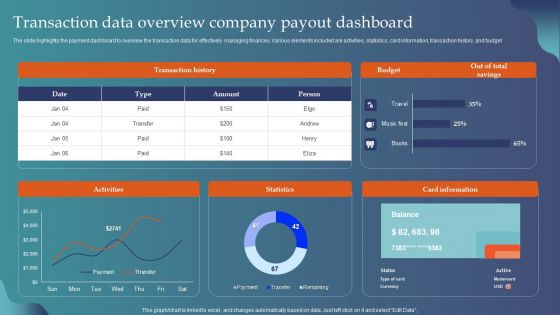
Transaction Data Overview Company Payout Dashboard Guidelines PDF
The slide highlights the payment dashboard to overview the transaction data for effectively managing finances. Various elements included are activities, statistics, card information, transaction history, and budget. Pitch your topic with ease and precision using this Transaction Data Overview Company Payout Dashboard Guidelines PDF. This layout presents information on Transaction History, Budget, Card Information, Statistics. It is also available for immediate download and adjustment. So, changes can be made in the color, design, graphics or any other component to create a unique layout.

Private Wealth Administration Business In Different Countries Mockup PDF
The following slide showcases statistical data about different countries for managing wealth based on investor. It presents information related to north America, Europe, etc. Pitch your topic with ease and precision using this Private Wealth Administration Business In Different Countries Mockup PDF. This layout presents information on Private Wealth Administration Business, Wealth Management. It is also available for immediate download and adjustment. So, changes can be made in the color, design, graphics or any other component to create a unique layout.
Project Management Tracking Dashboard To Review Decision Download PDF
The below slide depicts the key performing indicators in project decision making. It includes elements such as overall status, progress, progress, time, cost and work volume. Pitch your topic with ease and precision using this Project Management Tracking Dashboard To Review Decision Download PDF. This layout presents information on Progress, Activity Status, Overall Status. It is also available for immediate download and adjustment. So, changes can be made in the color, design, graphics or any other component to create a unique layout.
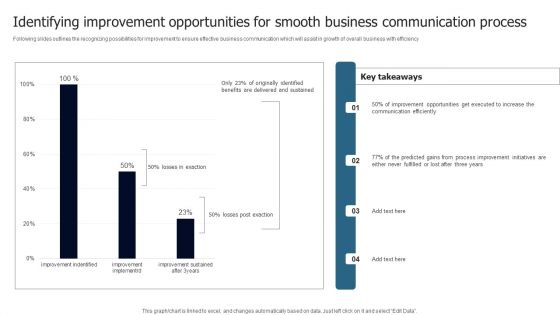
Identifying Improvement Opportunities For Smooth Business Communication Process Introduction PDF
Following slides outlines the recognizing possibilities for improvement to ensure effective business communication which will assist in growth of overall business with efficiency Pitch your topic with ease and precision using this Identifying Improvement Opportunities For Smooth Business Communication Process Introduction PDF. This layout presents information on Key Takeaways, Three Years, Efficiently. It is also available for immediate download and adjustment. So, changes can be made in the color, design, graphics or any other component to create a unique layout.
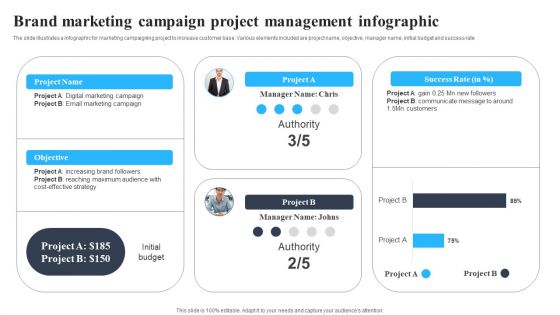
Brand Marketing Campaign Project Management Infographic Demonstration PDF
The slide illustrates a infographic for marketing campaigning project to increase customer base. Various elements included are project name, objective, manager name, initial budget and success rate Pitch your topic with ease and precision using this Brand Marketing Campaign Project Management Infographic Demonstration PDF. This layout presents information on Project Name, Objective, Infographic. It is also available for immediate download and adjustment. So, changes can be made in the color, design, graphics or any other component to create a unique layout.
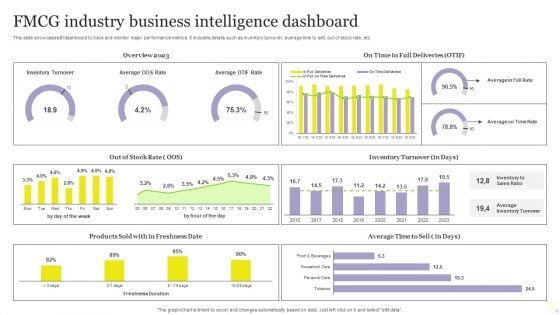
FMCG Industry Business Intelligence Dashboard Mockup PDF
This slide showcases BI dashboard to track and monitor major performance metrics. It includes details such as inventory turnover, average time to sell, out of stock rate, etc. Pitch your topic with ease and precision using this FMCG Industry Business Intelligence Dashboard Mockup PDF. This layout presents information on Average, Inventory Turnover, Business Intelligence Dashboard. It is also available for immediate download and adjustment. So, changes can be made in the color, design, graphics or any other component to create a unique layout.
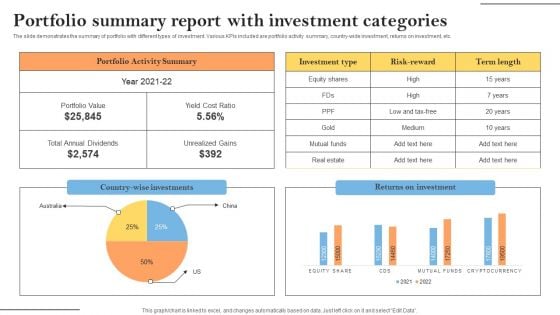
Portfolio Summary Report With Investment Categories Elements PDF
The slide demonstrates the summary of portfolio with different types of investment. Various KPIs included are portfolio activity summary, country-wide investment, returns on investment, etc. Pitch your topic with ease and precision using this Portfolio Summary Report With Investment Categories Elements PDF. This layout presents information on Portfolio Activity Summary, Investment, Risk Reward. It is also available for immediate download and adjustment. So, changes can be made in the color, design, graphics or any other component to create a unique layout.
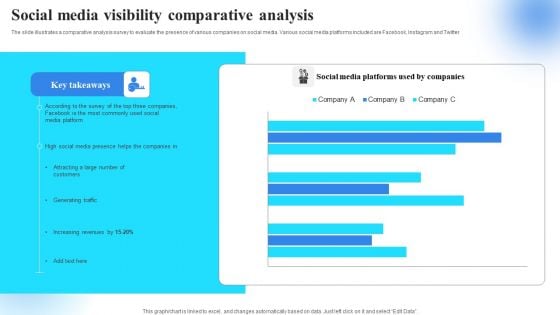
Social Media Visibility Comparative Analysis Brochure PDF
The slide illustrates a comparative analysis survey to evaluate the presence of various companies on social media. Various social media platforms included are Facebook, Instagram and Twitter Pitch your topic with ease and precision using this Social Media Visibility Comparative Analysis Brochure PDF. This layout presents information on YYYYYYYYYYYYYYYYYYYYYYYYYYYYYYYYYYYYYYYYY. It is also available for immediate download and adjustment. So, changes can be made in the color, design, graphics or any other component to create a unique layout.
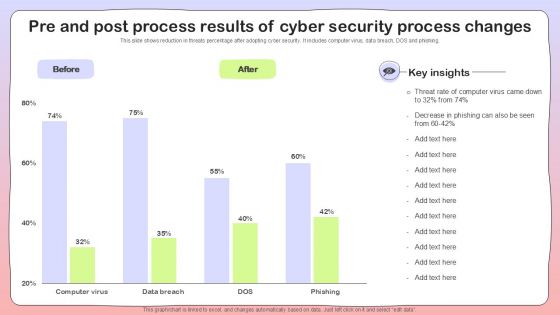
Pre And Post Process Results Of Cyber Security Process Changes Sample PDF
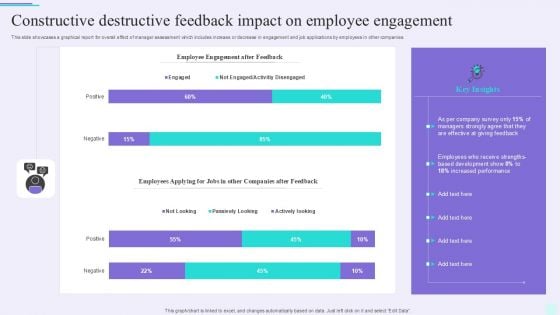
Constructive Destructive Feedback Impact On Employee Engagement Pictures PDF
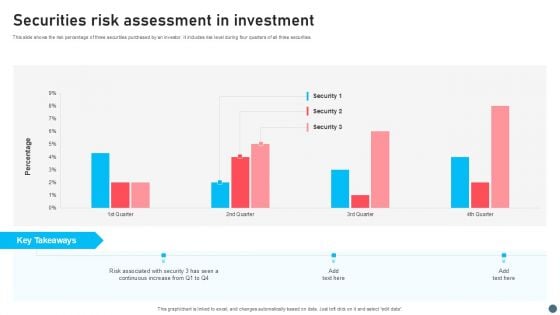
Securities Risk Assessment In Investment Topics PDF
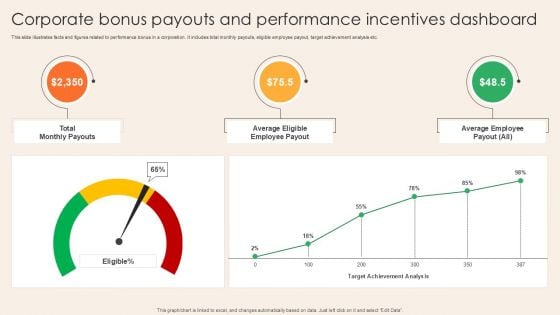
Corporate Bonus Payouts And Performance Incentives Dashboard Mockup PDF
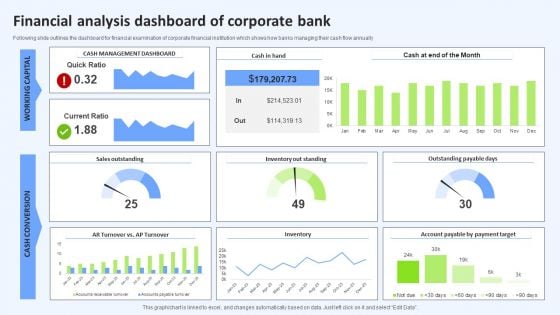
Financial Analysis Dashboard Of Corporate Bank Mockup PDF
Following slide outlines the dashboard for financial examination of corporate financial institution which shows how banks managing their cash flow annually Pitch your topic with ease and precision using this Financial Analysis Dashboard Of Corporate Bank Mockup PDF. This layout presents information on Month, Current Ratio, Inventory. It is also available for immediate download and adjustment. So, changes can be made in the color, design, graphics or any other component to create a unique layout.
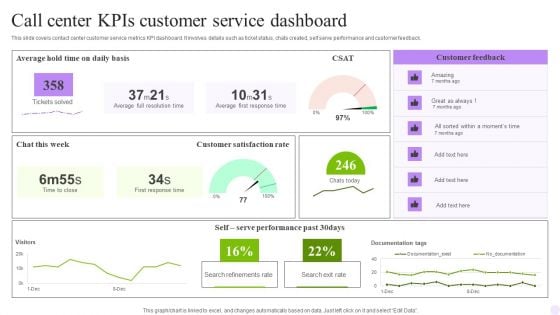
Call Center Kpis Customer Service Dashboard Pictures PDF
This slide covers contact center customer service metrics KPI dashboard. It involves details such as ticket status, chats created, self serve performance and customer feedback. Pitch your topic with ease and precision using this Call Center Kpis Customer Service Dashboard Pictures PDF. This layout presents information on Response Time, Customer, Dashboard. It is also available for immediate download and adjustment. So, changes can be made in the color, design, graphics or any other component to create a unique layout.
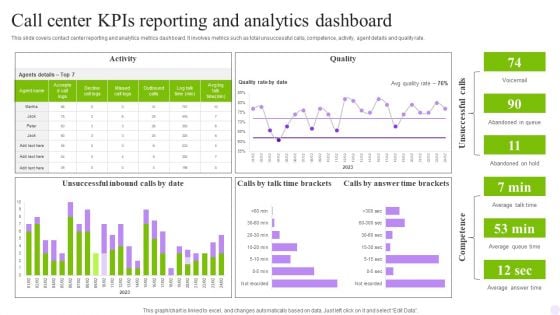
Call Center Kpis Reporting And Analytics Dashboard Download PDF
This slide covers contact center reporting and analytics metrics dashboard. It involves metrics such as total unsuccessful calls, competence, activity, agent details and quality rate. Pitch your topic with ease and precision using this Call Center Kpis Reporting And Analytics Dashboard Download PDF. This layout presents information on Activity, Quality, Dashboard. It is also available for immediate download and adjustment. So, changes can be made in the color, design, graphics or any other component to create a unique layout.
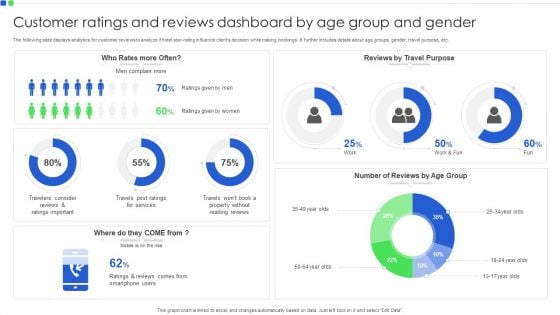
Customer Ratings And Reviews Dashboard By Age Group And Gender Introduction PDF
The following slide displays analytics for customer reviews to analyze if hotel star rating influence clients decision while making bookings. It further includes details about age groups, gender, travel purpose, etc. Pitch your topic with ease and precision using this Customer Ratings And Reviews Dashboard By Age Group And Gender Introduction PDF. This layout presents information on Customer Ratings And Reviews, Age Group And Gender. It is also available for immediate download and adjustment. So, changes can be made in the color, design, graphics or any other component to create a unique layout.
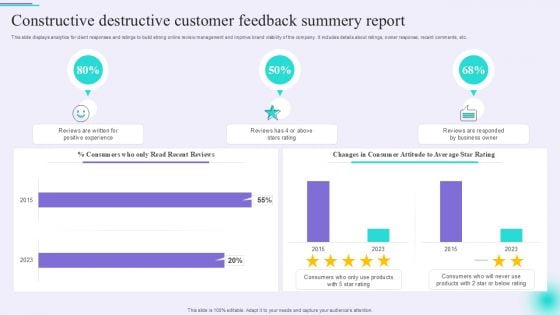
Constructive Destructive Customer Feedback Summery Report Inspiration PDF
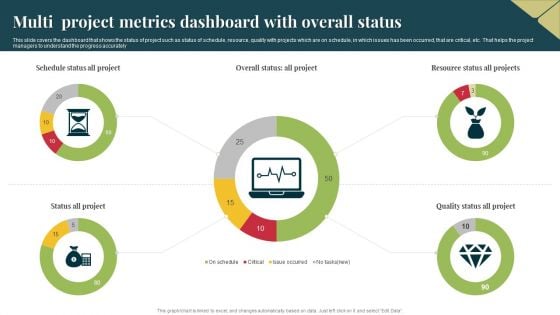
Multi Project Metrics Dashboard With Overall Status Pictures PDF
This slide covers the dashboard that shows the status of project such as status of schedule, resource, quality with projects which are on schedule, in which issues has been occurred, that are critical, etc. That helps the project managers to understand the progress accurately. Pitch your topic with ease and precision using this Multi Project Metrics Dashboard With Overall Status Pictures PDF. This layout presents information on Multi Project, Metrics Dashboard. It is also available for immediate download and adjustment. So, changes can be made in the color, design, graphics or any other component to create a unique layout.
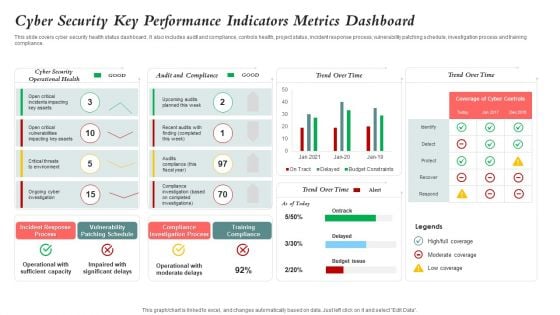
Cyber Security Key Performance Indicators Metrics Dashboard Mockup PDF
This slide covers cyber security health status dashboard . It also includes audit and compliance, controls health, project status, incident response process, vulnerability patching schedule, investigation process and training compliance. Pitch your topic with ease and precision using this Cyber Security Key Performance Indicators Metrics Dashboard Mockup PDF. This layout presents information on Cyber Security, Vulnerability Patching Schedule, Compliance Investigation Process. It is also available for immediate download and adjustment. So, changes can be made in the color, design, graphics or any other component to create a unique layout.
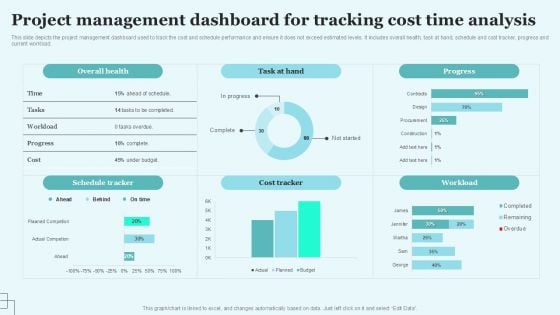
Project Management Dashboard For Tracking Cost Time Analysis Background PDF
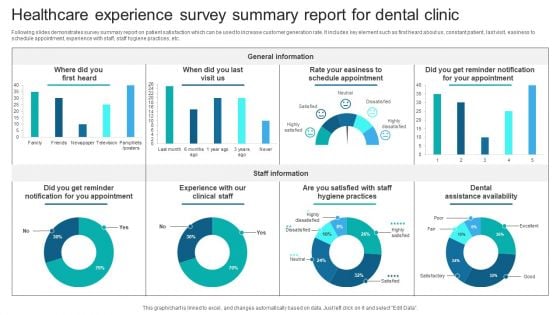
Healthcare Experience Survey Summary Report For Dental Clinic Survey SS
Following slides demonstrates survey summary report on patient satisfaction which can be used to increase customer generation rate. It includes key element such as first heard about us, constant patient, last visit, easiness to schedule appointment, experience with staff, staff hygiene practices, etc. Pitch your topic with ease and precision using this Healthcare Experience Survey Summary Report For Dental Clinic Survey SS. This layout presents information on General Information, Staff Information, Easiness To Schedule Appointment, Dental Assistance Availability, Staff Hygiene Practices. It is also available for immediate download and adjustment. So, changes can be made in the color, design, graphics or any other component to create a unique layout.
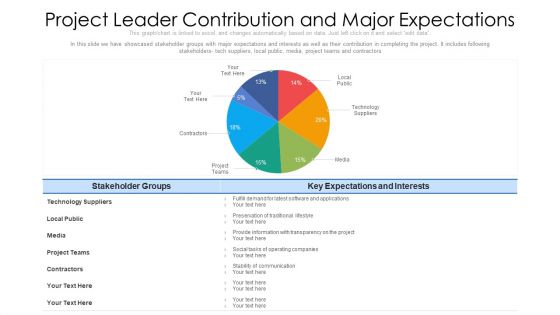
Project Leader Contribution And Major Expectations Ppt PowerPoint Presentation File Diagrams PDF
In this slide we have showcased stakeholder groups with major expectations and interests as well as their contribution in completing the project. It includes following stakeholders- tech suppliers, local public, media, project teams and contractors. Pitch your topic with ease and precision using this project leader contribution and major expectations ppt powerpoint presentation file diagrams pdf. This layout presents information on technology, media, contractors. It is also available for immediate download and adjustment. So, changes can be made in the color, design, graphics or any other component to create a unique layout.
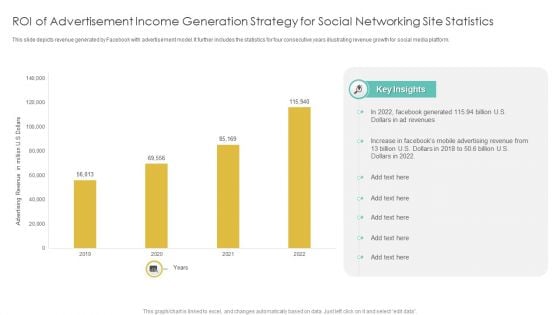
Roi Of Advertisement Income Generation Strategy For Social Networking Site Statistics Diagrams PDF
This slide depicts revenue generated by Facebook with advertisement model. It further includes the statistics for four consecutive years illustrating revenue growth for social media platform. Pitch your topic with ease and precision using this Roi Of Advertisement Income Generation Strategy For Social Networking Site Statistics Diagrams PDF. This layout presents information on Advertisement Income, Generation Strategy, Social Networking Site Statistics. It is also available for immediate download and adjustment. So, changes can be made in the color, design, graphics or any other component to create a unique layout.
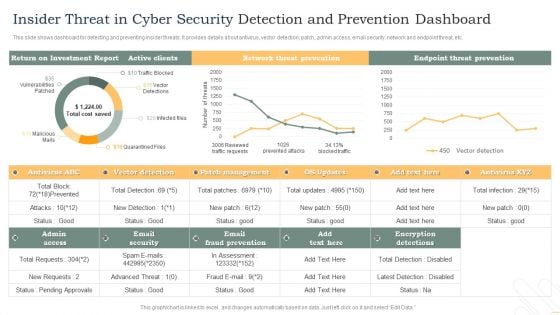
Insider Threat In Cyber Security Detection And Prevention Dashboard Diagrams PDF
This slide shows dashboard for detecting and preventing insider threats. It provides details about antivirus, vector detection, patch, admin access, email security, network and endpoint threat, etc. Pitch your topic with ease and precision using this Insider Threat In Cyber Security Detection And Prevention Dashboard Diagrams PDF. This layout presents information on Active Clients, Network Threat Prevention, Endpoint Threat Prevention. It is also available for immediate download and adjustment. So, changes can be made in the color, design, graphics or any other component to create a unique layout.
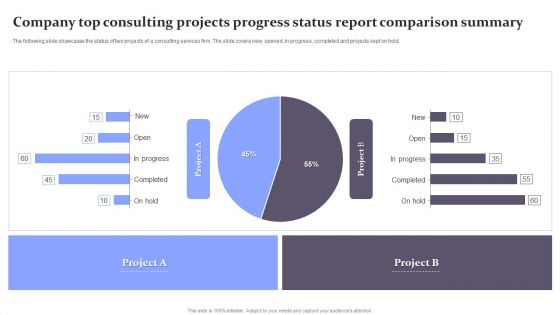
Company Top Consulting Projects Progress Status Report Comparison Summary Diagrams PDF
The following slide showcases the status of two projects of a consulting services firm. The slide covers new, opened, in progress, completed and projects kept on hold. Pitch your topic with ease and precision using this Company Top Consulting Projects Progress Status Report Comparison Summary Diagrams PDF. This layout presents information on Company Top Consulting Projects Progress, Status Report Comparison Summary. It is also available for immediate download and adjustment. So, changes can be made in the color, design, graphics or any other component to create a unique layout.
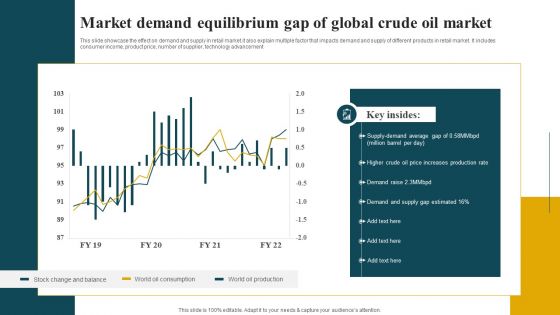
Market Demand Equilibrium Gap Of Global Crude Oil Market Diagrams PDF
This slide showcase the effect on demand and supply in retail market.it also explain multiple factor that impacts demand and supply of different products in retail market. It includes consumer income, product price, number of supplier, technology advancement. Pitch your topic with ease and precision using this Market Demand Equilibrium Gap Of Global Crude Oil Market Diagrams PDF. This layout presents information on Demand And Supply, Production Rate, Average. It is also available for immediate download and adjustment. So, changes can be made in the color, design, graphics or any other component to create a unique layout.
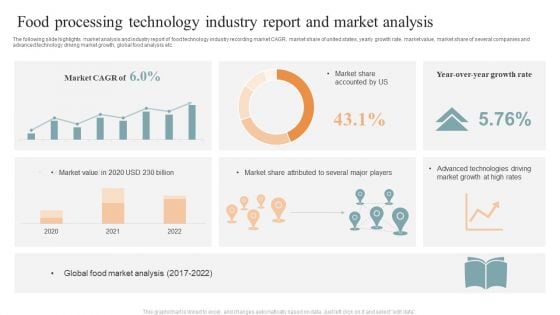
Food Processing Technology Industry Report And Market Analysis Brochure PDF
The following slide highlights market analysis and industry report of food technology industry recording market CAGR, market share of united states, yearly growth rate, market value, market share of several companies and advanced technology driving market growth, global food analysis etc. Pitch your topic with ease and precision using this Food Processing Technology Industry Report And Market Analysis Brochure PDF. This layout presents information on Market CAGR, Market Share Accounted, Global Food, Market Analysis. It is also available for immediate download and adjustment. So, changes can be made in the color, design, graphics or any other component to create a unique layout.
Safety And Health Kpis For Tracking Performance Graph Mockup PDF
This slide represents graph showing key performance indicators tracked by companies for assessment of safety and health performance of their workplace. It includes key metrics such as workforce awareness, safety meetings held, recordable injuries, lost work days, compliance, severity rates etc. Pitch your topic with ease and precision using this Safety And Health Kpis For Tracking Performance Graph Mockup PDF. This layout presents information on Safety And Health, Kpis For Tracking, Performance Graph. It is also available for immediate download and adjustment. So, changes can be made in the color, design, graphics or any other component to create a unique layout.

Quarterly Sales Performance Of Business Analysis With Key Insights Information PDF
In this slide sales performance of each product is recorded as their percentage share in total sales first quarter of company. The goods include headphones, joystick, mouse pad, bluetooth speaker, etc. Pitch your topic with ease and precision using this Quarterly Sales Performance Of Business Analysis With Key Insights Information PDF. This layout presents information on Wireless Mouse, Keyboard, Mouse Pad, Joystick, Headsets. It is also available for immediate download and adjustment. So, changes can be made in the color, design, graphics or any other component to create a unique layout.
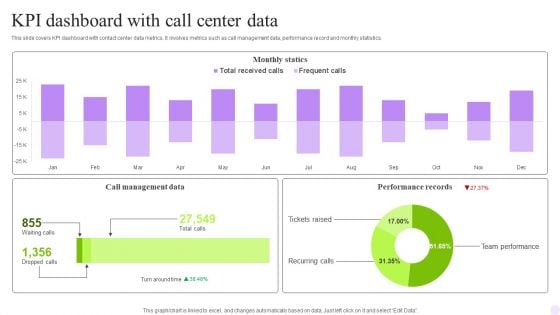
KPI Dashboard With Call Center Data Rules PDF
This slide covers contact center performance metrics KPI dashboard. It involves details such as number of total calls, average answer speed, abandon rate, data of agents performance and call abandon rate by departments. Pitch your topic with ease and precision using this KPI Dashboard With Call Center Data Rules PDF. This layout presents information on Monthly Statics, Management Data, Performance Records. It is also available for immediate download and adjustment. So, changes can be made in the color, design, graphics or any other component to create a unique layout.
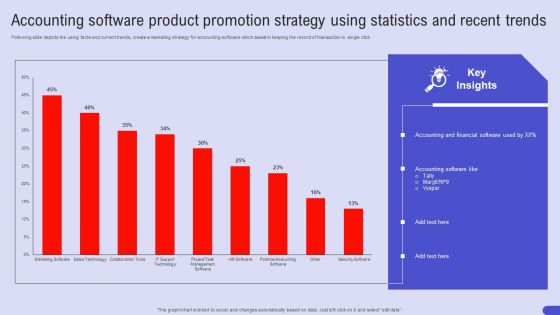
Accounting Software Product Promotion Strategy Using Statistics And Recent Trends Sample PDF
Following slide depicts the using facts and current trends, create a marketing strategy for accounting software which assist in keeping the record of transaction in single click. Pitch your topic with ease and precision using this Accounting Software Product Promotion Strategy Using Statistics And Recent Trends Sample PDF. This layout presents information on Accounting Software Product, Promotion Strategy, Statistics And Recent Trends. It is also available for immediate download and adjustment. So, changes can be made in the color, design, graphics or any other component to create a unique layout.
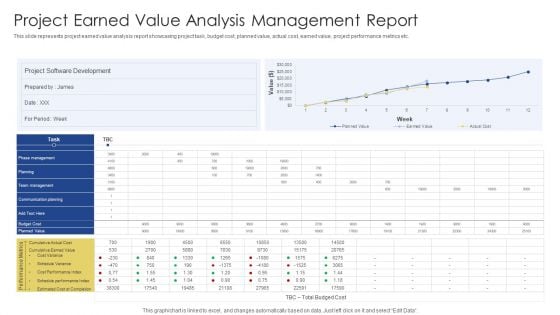
Project Earned Value Analysis Management Report Ppt PowerPoint Presentation Gallery Outline PDF
This slide represents project earned value analysis report showcasing project task, budget cost, planned value, actual cost, earned value, project performance metrics etc. Pitch your topic with ease and precision using this Project Earned Value Analysis Management Report Ppt PowerPoint Presentation Gallery Outline PDF. This layout presents information on Project Software Development, Phase Management, Communication Planning. It is also available for immediate download and adjustment. So, changes can be made in the color, design, graphics or any other component to create a unique layout.
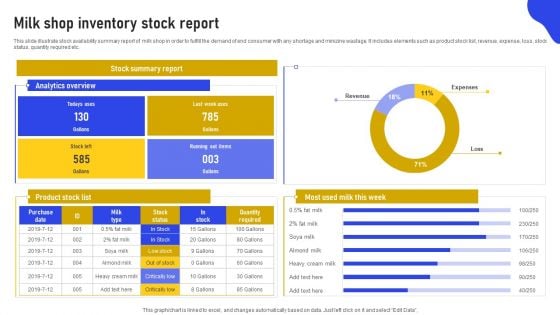
Milk Shop Inventory Stock Report Structure PDF
This slide illustrate stock availability summary report of milk shop in order to fulfill the demand of end consumer with any shortage and minizine wastage. It includes elements such as product stock list, revenue, expense, loss, stock status, quantity required etc. Pitch your topic with ease and precision using this Milk Shop Inventory Stock Report Structure PDF. This layout presents information on Stock Summary Report, Analytics Overview, Product Stock List. It is also available for immediate download and adjustment. So, changes can be made in the color, design, graphics or any other component to create a unique layout.
Project Tracking Planned Vs Actual Project Progress Tracker Pictures PDF
The following slide highlights the variations in the project progress to manage the its and ensure timely delivery. It includes KPIs such as completion percentage and the gap in the planned versus actual hours. Pitch your topic with ease and precision using this Project Tracking Planned Vs Actual Project Progress Tracker Pictures PDF. This layout presents information on Project Tracking Planned, Project Progress Tracker. It is also available for immediate download and adjustment. So, changes can be made in the color, design, graphics or any other component to create a unique layout.
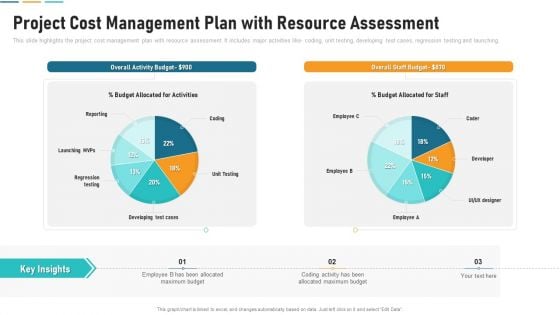
Project Cost Management Plan With Resource Assessment Download PDF
This slide highlights the project cost management plan with resource assessment. It includes major activities like coding, unit testing, developing test cases, regression testing and launching. Pitch your topic with ease and precision using this project cost management plan with resource assessment download pdf. This layout presents information on overall activity budget, overall staff budget, budget allocated for staff. It is also available for immediate download and adjustment. So, changes can be made in the color, design, graphics or any other component to create a unique layout.
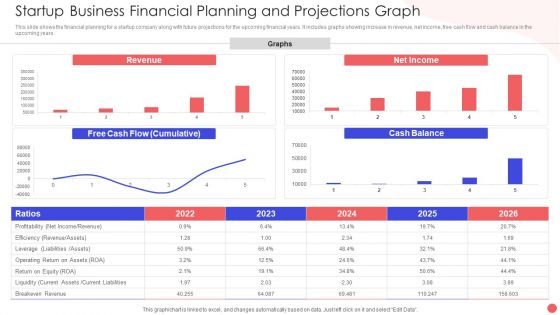
Startup Business Financial Planning And Projections Graph Slides PDF
This slide shows the financial planning for a startup company along with future projections for the upcoming financial years. It includes graphs showing increase in revenue, net income, free cash flow and cash balance in the upcoming years. Pitch your topic with ease and precision using this Startup Business Financial Planning And Projections Graph Slides PDF. This layout presents information on Revenue Graphs Operating, Free Cash Flow, Net Income Ration. It is also available for immediate download and adjustment. So, changes can be made in the color, design, graphics or any other component to create a unique layout.
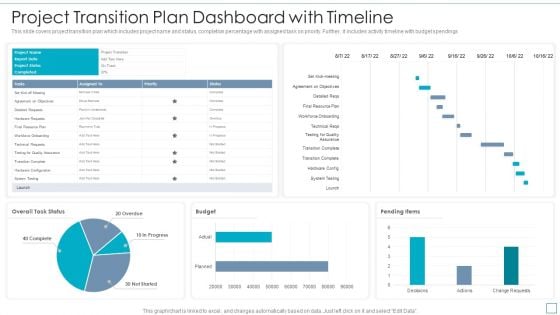
Project Transition Plan Dashboard With Timeline Topics PDF
This slide covers project transition plan which includes project name and status, completion percentage with assigned task on priority. Further, it includes activity timeline with budget spendings. Pitch your topic with ease and precision using this Project Transition Plan Dashboard With Timeline Topics PDF. This layout presents information on Budget, System Testing, Testing For Quality Assurance. It is also available for immediate download and adjustment. So, changes can be made in the color, design, graphics or any other component to create a unique layout.
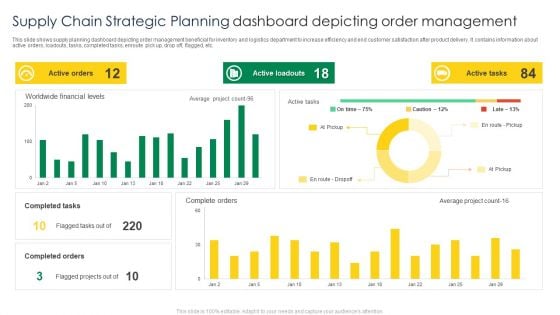
Supply Chain Strategic Planning Dashboard Depicting Order Management Mockup PDF
This slide shows supply planning dashboard depicting order management beneficial for inventory and logistics department to increase efficiency and end customer satisfaction after product delivery. It contains information about active orders, loadouts, tasks, completed tasks, enroute pick up, drop off, flagged, etc. Pitch your topic with ease and precision using this Supply Chain Strategic Planning Dashboard Depicting Order Management Mockup PDF. This layout presents information on Active Orders, Active Loadouts, Active Tasks. It is also available for immediate download and adjustment. So, changes can be made in the color, design, graphics or any other component to create a unique layout.
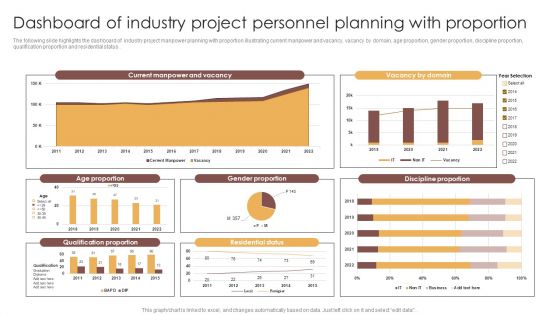
Dashboard Of Industry Project Personnel Planning With Proportion Professional PDF
The following slide highlights the dashboard of industry project manpower planning with proportion illustrating current manpower and vacancy, vacancy by domain, age proportion, gender proportion, discipline proportion, qualification proportion and residential status. Pitch your topic with ease and precision using this Dashboard Of Industry Project Personnel Planning With Proportion Professional PDF. This layout presents information on Current Manpower And Vacancy, Gender Proportion, Qualification Proportion. It is also available for immediate download and adjustment. So, changes can be made in the color, design, graphics or any other component to create a unique layout.
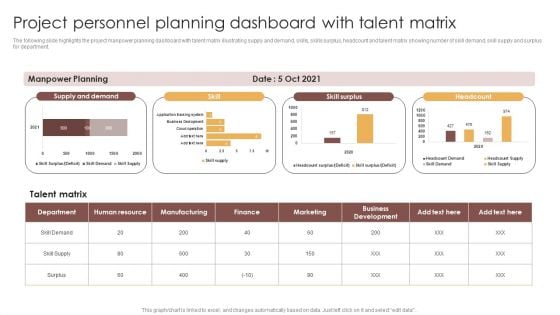
Project Personnel Planning Dashboard With Talent Matrix Demonstration Structure PDF
The following slide highlights the project manpower planning dashboard with talent matrix illustrating supply and demand, skills, skills surplus, headcount and talent matrix showing number of skill demand, skill supply and surplus for department. Pitch your topic with ease and precision using this Project Personnel Planning Dashboard With Talent Matrix Demonstration Structure PDF. This layout presents information on Supply And Demand, Skill Surplus, Headcount. It is also available for immediate download and adjustment. So, changes can be made in the color, design, graphics or any other component to create a unique layout.
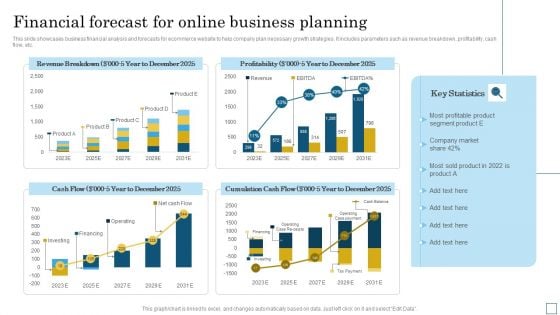
Financial Forecast For Online Business Planning Pictures PDF
This slide showcases business financial analysis and forecasts for ecommerce website to help company plan necessary growth strategies. It includes parameters such as revenue breakdown, profitability, cash flow, etc. Pitch your topic with ease and precision using this Financial Forecast For Online Business Planning Pictures PDF. This layout presents information on Cumulation Cash Flow, Profitability, Revenue Breakdown. It is also available for immediate download and adjustment. So, changes can be made in the color, design, graphics or any other component to create a unique layout.
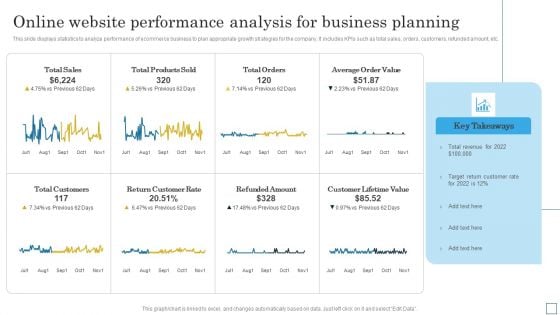
Online Website Performance Analysis For Business Planning Slides PDF
This slide displays statistics to analyze performance of ecommerce business to plan appropriate growth strategies for the company. It includes KPIs such as total sales, orders, customers, refunded amount, etc. Pitch your topic with ease and precision using this Online Website Performance Analysis For Business Planning Slides PDF. This layout presents information on Revenue, Customer Rate, Target. It is also available for immediate download and adjustment. So, changes can be made in the color, design, graphics or any other component to create a unique layout.
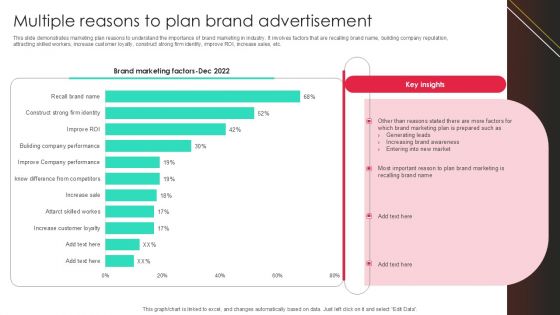
Multiple Reasons To Plan Brand Advertisement Clipart PDF
Emerging Trends In Integrated Solid Waste Administration Icons PDF
This slide represents the statistical data of the upcoming trends in the management of solid waste of different areas. It shows millions of tonnes collected for the current year and forecast of future years. Pitch your topic with ease and precision using this Emerging Trends In Integrated Solid Waste Administration Icons PDF. This layout presents information on Emerging, Integrated, Administration. It is also available for immediate download and adjustment. So, changes can be made in the color, design, graphics or any other component to create a unique layout.
Yearly Outcomes Summary Of Profit And Loss Trends Icons PDF
This slide shows the graphical representation of result summary of profit and loss trends for five consecutive years that shows revenues, cost of goods sold, selling, general and administrative expenses, net income, etc.Pitch your topic with ease and precision using this Yearly Outcomes Summary Of Profit And Loss Trends Icons PDF This layout presents information on Earned Maximum, Selling General, Administrative Expenses It is also available for immediate download and adjustment. So, changes can be made in the color, design, graphics or any other component to create a unique layout.


 Continue with Email

 Home
Home


