Hierarchy Chart Organizational
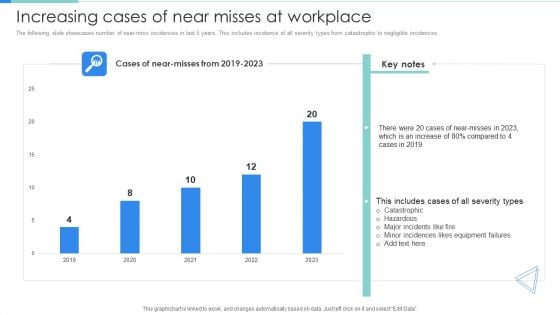
Deployment Of Workplace Safety Management Program Increasing Cases Of Near Misses At Workplace Clipart PDF
The following slide showcases number of near-miss incidences in last 5 years. This includes incidence of all severity types from catastrophic to negligible incidences. This Deployment Of Workplace Safety Management Program Increasing Cases Of Near Misses At Workplace Clipart PDF from Slidegeeks makes it easy to present information on your topic with precision. It provides customization options, so you can make changes to the colors, design, graphics, or any other component to create a unique layout. It is also available for immediate download, so you can begin using it right away. Slidegeeks has done good research to ensure that you have everything you need to make your presentation stand out. Make a name out there for a brilliant performance.
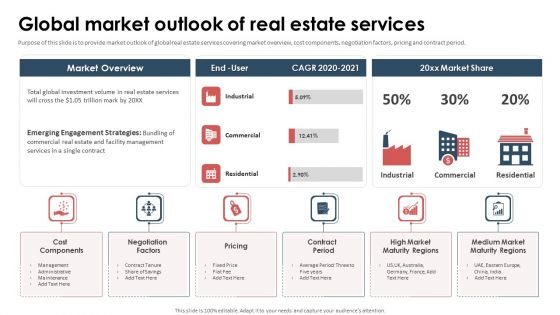
Series A Capital Funding Elevator Global Market Outlook Of Real Estate Services Microsoft PDF
Purpose of this slide is to provide market outlook of global real estate services covering market overview, cost components, negotiation factors, pricing and contract period. Do you know about Slidesgeeks Series A Capital Funding Elevator Global Market Outlook Of Real Estate Services Microsoft PDF These are perfect for delivering any kind od presentation. Using it, create PowerPoint presentations that communicate your ideas and engage audiences. Save time and effort by using our pre-designed presentation templates that are perfect for a wide range of topic. Our vast selection of designs covers a range of styles, from creative to business, and are all highly customizable and easy to edit. Download as a PowerPoint template or use them as Google Slides themes.
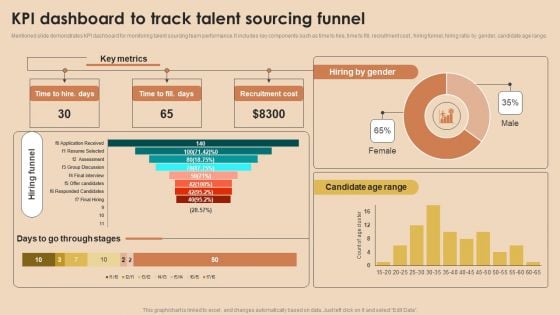
Detailed Guide For Talent Acquisition KPI Dashboard To Track Talent Sourcing Funnel Elements PDF
Mentioned slide demonstrates KPI dashboard for monitoring talent sourcing team performance. It includes key components such as time to hire, time to fill, recruitment cost , hiring funnel, hiring ratio by gender, candidate age range. Do you know about Slidesgeeks Detailed Guide For Talent Acquisition KPI Dashboard To Track Talent Sourcing Funnel Elements PDF These are perfect for delivering any kind od presentation. Using it, create PowerPoint presentations that communicate your ideas and engage audiences. Save time and effort by using our pre designed presentation templates that are perfect for a wide range of topic. Our vast selection of designs covers a range of styles, from creative to business, and are all highly customizable and easy to edit. Download as a PowerPoint template or use them as Google Slides themes.
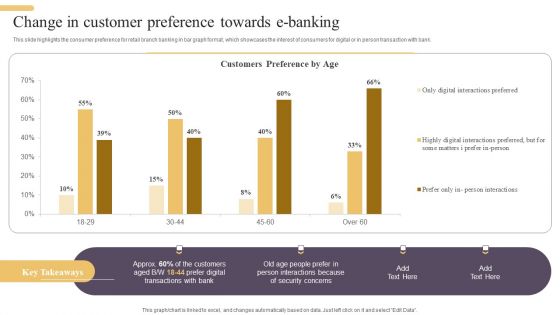
Change In Customer Preference Towards E Banking Inspiration PDF
This slide highlights the consumer preference for retail branch banking in bar graph format, which showcases the interest of consumers for digital or in person transaction with bank. This Change In Customer Preference Towards E Banking Inspiration PDF from Slidegeeks makes it easy to present information on your topic with precision. It provides customization options, so you can make changes to the colors, design, graphics, or any other component to create a unique layout. It is also available for immediate download, so you can begin using it right away. Slidegeeks has done good research to ensure that you have everything you need to make your presentation stand out. Make a name out there for a brilliant performance.
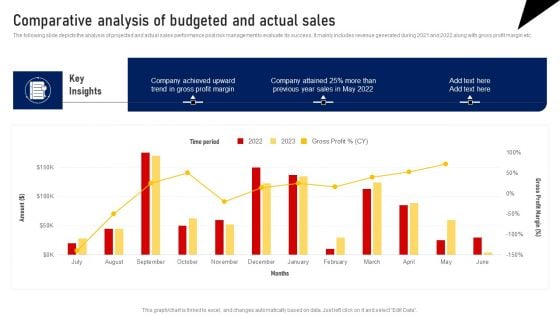
Comparative Analysis Of Budgeted And Actual Sales Template PDF
The following slide depicts the analysis of projected and actual sales performance post risk management to evaluate its success. It mainly includes revenue generated during 2021 and 2022 along with gross profit margin etc. This Comparative Analysis Of Budgeted And Actual Sales Template PDF from Slidegeeks makes it easy to present information on your topic with precision. It provides customization options, so you can make changes to the colors, design, graphics, or any other component to create a unique layout. It is also available for immediate download, so you can begin using it right away. Slidegeeks has done good research to ensure that you have everything you need to make your presentation stand out. Make a name out there for a brilliant performance.
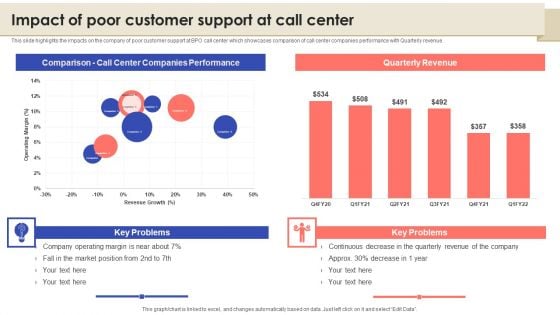
Call Center Quality Enhancement Plan Impact Of Poor Customer Support At Call Center Diagrams PDF
This slide highlights the impacts on the company of poor customer support at BPO call center which showcases comparison of call center companies performance with Quarterly revenue. This Call Center Quality Enhancement Plan Impact Of Poor Customer Support At Call Center Diagrams PDF from Slidegeeks makes it easy to present information on your topic with precision. It provides customization options, so you can make changes to the colors, design, graphics, or any other component to create a unique layout. It is also available for immediate download, so you can begin using it right away. Slidegeeks has done good research to ensure that you have everything you need to make your presentation stand out. Make a name out there for a brilliant performance.
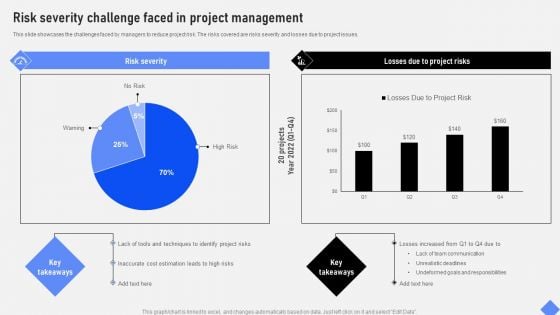
Effective Business Project Risk Mitigation Plan Risk Severity Challenge Faced In Project Management Diagrams PDF
This slide showcases the challenges faced by managers to reduce project risk. The risks covered are risks severity and losses due to project issues. This Effective Business Project Risk Mitigation Plan Risk Severity Challenge Faced In Project Management Diagrams PDF from Slidegeeks makes it easy to present information on your topic with precision. It provides customization options, so you can make changes to the colors, design, graphics, or any other component to create a unique layout. It is also available for immediate download, so you can begin using it right away. Slidegeeks has done good research to ensure that you have everything you need to make your presentation stand out. Make a name out there for a brilliant performance.
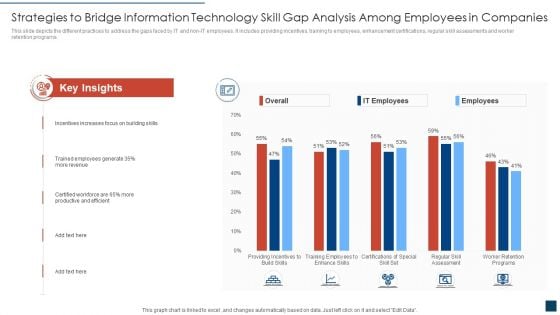
Strategies To Bridge Information Technology Skill Gap Analysis Among Employees In Companies Formats PDF
This slide depicts the different practices to address the gaps faced by IT and non-IT employees. It includes providing incentives, training to employees, enhancement certifications, regular skill assessments and worker retention programs. Pitch your topic with ease and precision using this strategies to bridge information technology skill gap analysis among employees in companies formats pdf. This layout presents information on strategies to bridge information technology skill gap analysis among employees in companies. It is also available for immediate download and adjustment. So, changes can be made in the color, design, graphics or any other component to create a unique layout.
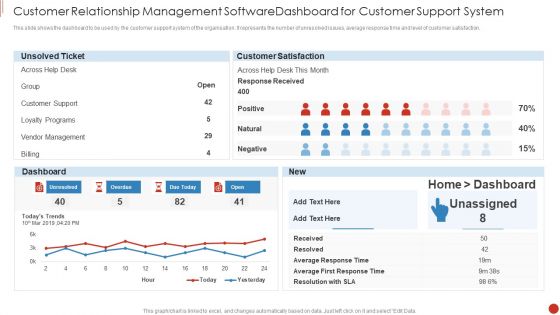
Customer Relationship Management Software Dashboard For Customer Support System Demonstration PDF
This slide shows the dashboard to be used by the customer support system of the organisation. It represents the number of unresolved issues, average response time and level of customer satisfaction.Pitch your topic with ease and precision using this Customer Relationship Management Software Dashboard For Customer Support System Demonstration PDF This layout presents information on Customer Support, Vendor Management, Loyalty Programs It is also available for immediate download and adjustment. So, changes can be made in the color, design, graphics or any other component to create a unique layout.

Incident Response Rate By Employees Post Cybersecurity Awareness Training Demonstration PDF
This slide illustrates impact of security training programs on workforces incident report rate. It includes mass mailed phishing , targeted mails, malware and social media scams.Pitch your topic with ease and precision using this Incident Response Rate By Employees Post Cybersecurity Awareness Training Demonstration PDF. This layout presents information on Training Sessions, Phishing Identification, Malware Reporting. It is also available for immediate download and adjustment. So, changes can be made in the color, design, graphics or any other component to create a unique layout.
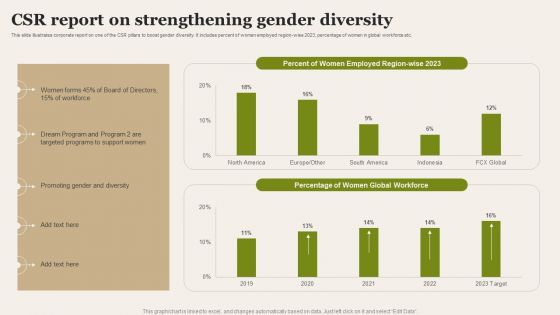
CSR Report On Strengthening Gender Diversity Introduction PDF
This slide illustrates corporate report on one of the CSR pillars to boost gender diversity. It includes percent of women employed region wise 2023, percentage of women in global workforce etc. Pitch your topic with ease and precision using this CSR Report On Strengthening Gender Diversity Introduction PDF. This layout presents information on Targeted Programs, Strengthening Gender Diversity. It is also available for immediate download and adjustment. So, changes can be made in the color, design, graphics or any other component to create a unique layout.
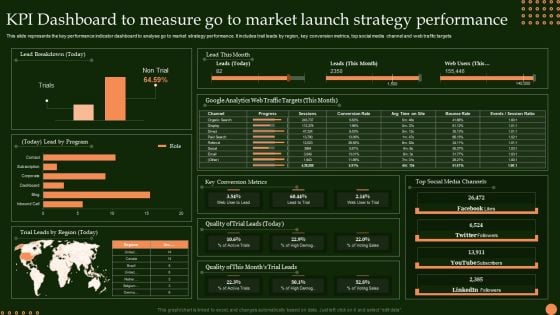
KPI Dashboard To Measure Go To Market Launch Strategy Performance Sample PDF
This slide represents the key performance indicator dashboard to analyse go to market strategy performance. It includes trail leads by region, key conversion metrics, top social media channel and web traffic targets Pitch your topic with ease and precision using this KPI Dashboard To Measure Go To Market Launch Strategy Performance Sample PDF. This layout presents information on Lead Breakdown, Lead By Program, Trial Leads Region. It is also available for immediate download and adjustment. So, changes can be made in the color, design, graphics or any other component to create a unique layout.

Actual Time Marketing Advantages For Companies And Agencies Ppt PowerPoint Presentation File Information PDF
The slide illustrates a company report highlighting the benefits from investing in a real-time marketing program for responding quickly to the trends. Various advantages included are increases customer experience, boosts customer retention rate, better conversion rates, etc. Pitch your topic with ease and precision using this Actual Time Marketing Advantages For Companies And Agencies Ppt PowerPoint Presentation File Information PDF. This layout presents information on Increases Customer Experience, Better Conversion Rates, Improved Brand Perception, Facilitates Personalization. It is also available for immediate download and adjustment. So, changes can be made in the color, design, graphics or any other component to create a unique layout.
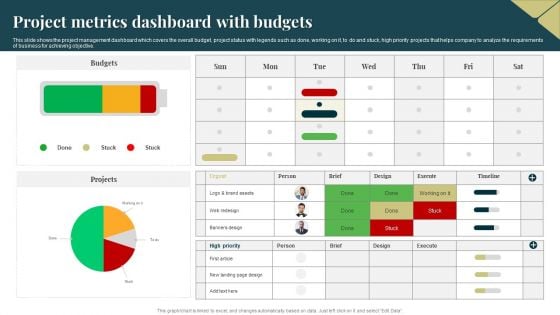
Project Metrics Dashboard With Budgets Topics PDF
This slide shows the project management dashboard which covers the overall budget, project status with legends such as done, working on it, to do and stuck, high priority projects that helps company to analyze the requirements of business for achieving objective. Pitch your topic with ease and precision using this Project Metrics Dashboard With Budgets Topics PDF. This layout presents information on Budgets, Projects, Banners Design. It is also available for immediate download and adjustment. So, changes can be made in the color, design, graphics or any other component to create a unique layout.
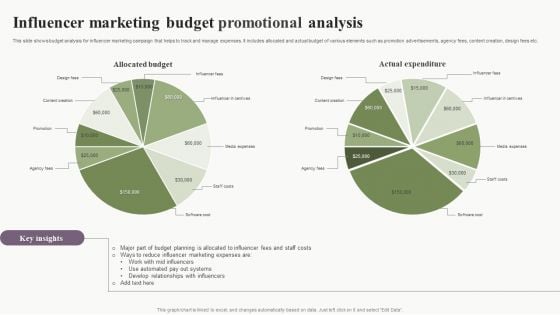
Influencer Marketing Budget Promotional Analysis Download PDF
This slide shows budget analysis for influencer marketing campaign that helps to track and manage expenses. It includes allocated and actual budget of various elements such as promotion advertisements, agency fees, content creation, design fees etc. Pitch your topic with ease and precision using this Influencer Marketing Budget Promotional Analysis Download PDF. This layout presents information on Influencer Marketing, Budget Promotional Analysis. It is also available for immediate download and adjustment. So, changes can be made in the color, design, graphics or any other component to create a unique layout.
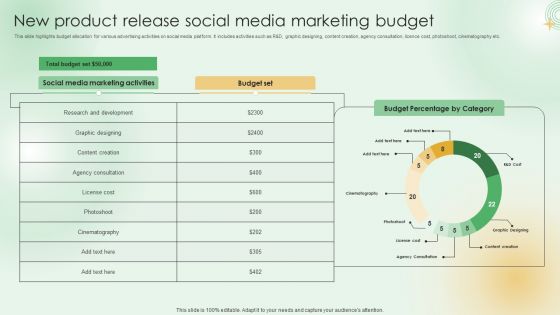
New Product Release Social Media Marketing Budget Clipart PDF
This slide highlights budget allocation for various advertising activities on social media platform. It includes activities such as R and D, graphic designing, content creation, agency consultation, licence cost, photoshoot, cinematography etc. Pitch your topic with ease and precision using this New Product Release Social Media Marketing Budget Clipart PDF. This layout presents information on Total Budget Set, Social Media Marketing Activities, Budget Percentage Category. It is also available for immediate download and adjustment. So, changes can be made in the color, design, graphics or any other component to create a unique layout.
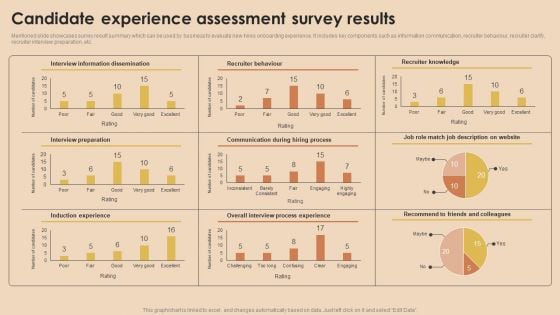
Detailed Guide For Talent Acquisition Candidate Experience Assessment Survey Results Clipart PDF
Mentioned slide showcases survey result summary which can be used by business to evaluate new hires onboarding experience. It includes key components such as information communication, recruiter behaviour, recruiter clarify, recruiter interview preparation, etc. Take your projects to the next level with our ultimate collection of Detailed Guide For Talent Acquisition Candidate Experience Assessment Survey Results Clipart PDF. Slidegeeks has designed a range of layouts that are perfect for representing task or activity duration, keeping track of all your deadlines at a glance. Tailor these designs to your exact needs and give them a truly corporate look with your own brand colors they will make your projects stand out from the rest.
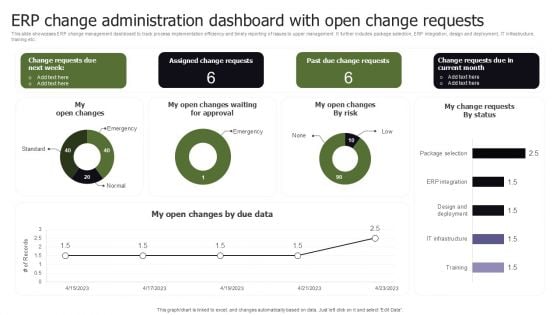
ERP Change Administration Dashboard With Open Change Requests Wd Topics PDF
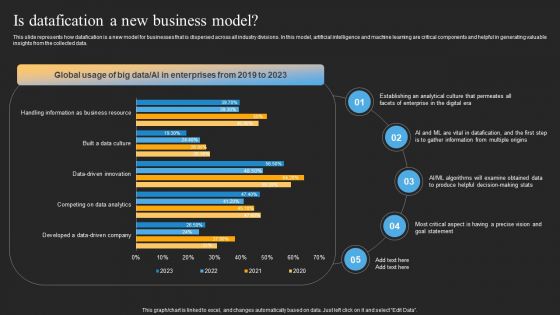
Datafy Is Datafication A New Business Model Rules PDF
This slide represents how datafication is a new model for businesses that is dispersed across all industry divisions. In this model, artificial intelligence and machine learning are critical components and helpful in generating valuable insights from the collected data. Coming up with a presentation necessitates that the majority of the effort goes into the content and the message you intend to convey. The visuals of a PowerPoint presentation can only be effective if it supplements and supports the story that is being told. Keeping this in mind our experts created Datafy Is Datafication A New Business Model Rules PDF to reduce the time that goes into designing the presentation. This way, you can concentrate on the message while our designers take care of providing you with the right template for the situation.
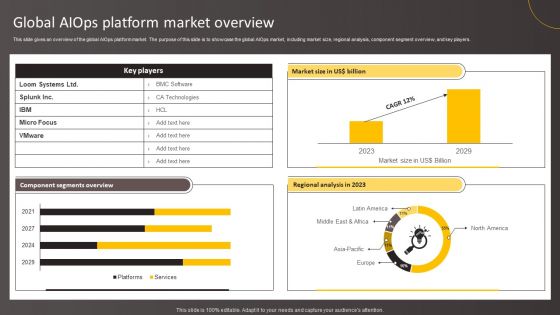
Global Aiops Platform Market Overview Brochure PDF
This slide gives an overview of the global AIOps platform market. The purpose of this slide is to showcase the global AIOps market, including market size, regional analysis, component segment overview, and key players. Coming up with a presentation necessitates that the majority of the effort goes into the content and the message you intend to convey. The visuals of a PowerPoint presentation can only be effective if it supplements and supports the story that is being told. Keeping this in mind our experts created Global Aiops Platform Market Overview Brochure PDF to reduce the time that goes into designing the presentation. This way, you can concentrate on the message while our designers take care of providing you with the right template for the situation.
Monthly Sales Performance Tracking And Monitoring Dashboard Inspiration PDF
This slide showcases a dashboard presenting various metrics to measure and analyze sales performance for revenue growth. It includes key components such as number of sales, revenue, profit, cost, sales revenue, sales increment, cost analysis and cross sell. Coming up with a presentation necessitates that the majority of the effort goes into the content and the message you intend to convey. The visuals of a PowerPoint presentation can only be effective if it supplements and supports the story that is being told. Keeping this in mind our experts created Monthly Sales Performance Tracking And Monitoring Dashboard Inspiration PDF to reduce the time that goes into designing the presentation. This way, you can concentrate on the message while our designers take care of providing you with the right template for the situation.
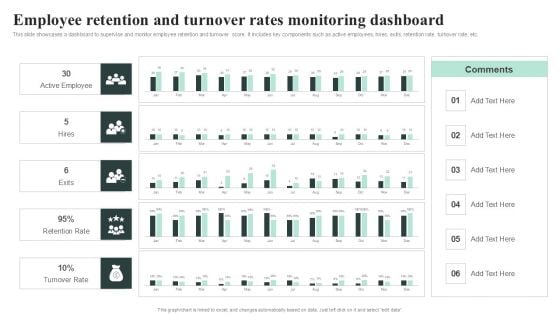
Employee Retention And Turnover Rates Monitoring Dashboard Professional PDF
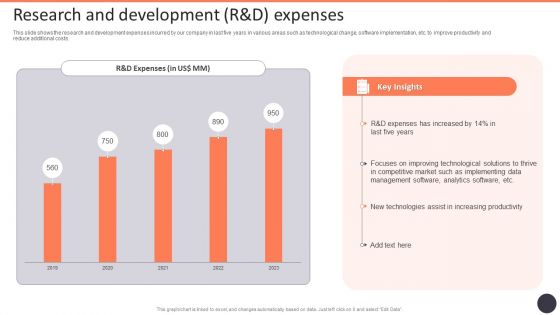
Business Strategy Consulting Solutions Company Outline Research And Development R And D Expenses Template PDF
This slide shows the research and development expenses incurred by our company in last five years in various areas such as technological change, software implementation, etc. to improve productivity and reduce additional costs. This Business Strategy Consulting Solutions Company Outline Research And Development R And D Expenses Template PDF from Slidegeeks makes it easy to present information on your topic with precision. It provides customization options, so you can make changes to the colors, design, graphics, or any other component to create a unique layout. It is also available for immediate download, so you can begin using it right away. Slidegeeks has done good research to ensure that you have everything you need to make your presentation stand out. Make a name out there for a brilliant performance.

Data Quality Dashboard For Linked Data Integrating Linked Data To Enhance Operational Template PDF
This slide describes the data quality dashboard for linked data by covering details of account information quality, contact details quality, financial data quality, and missing account information.This Data Quality Dashboard For Linked Data Integrating Linked Data To Enhance Operational Template PDF from Slidegeeks makes it easy to present information on your topic with precision. It provides customization options, so you can make changes to the colors, design, graphics, or any other component to create a unique layout. It is also available for immediate download, so you can begin using it right away. Slidegeeks has done good research to ensure that you have everything you need to make your presentation stand out. Make a name out there for a brilliant performance.
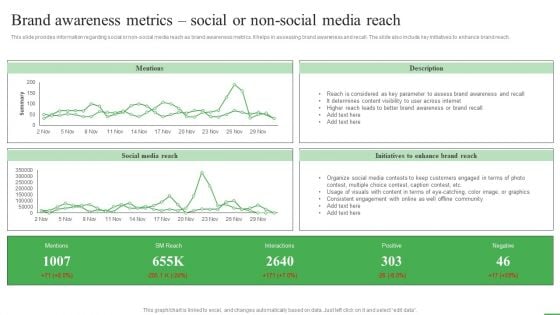
How To Boost Brand Recognition Brand Awareness Metrics Social Or Non Social Media Template PDF
This slide provides information regarding social or non-social media reach as brand awareness metrics. It helps in assessing brand awareness and recall. The slide also include key initiatives to enhance brand reach. This How To Boost Brand Recognition Brand Awareness Metrics Social Or Non Social Media Template PDF from Slidegeeks makes it easy to present information on your topic with precision. It provides customization options, so you can make changes to the colors, design, graphics, or any other component to create a unique layout. It is also available for immediate download, so you can begin using it right away. Slidegeeks has done good research to ensure that you have everything you need to make your presentation stand out. Make a name out there for a brilliant performance.
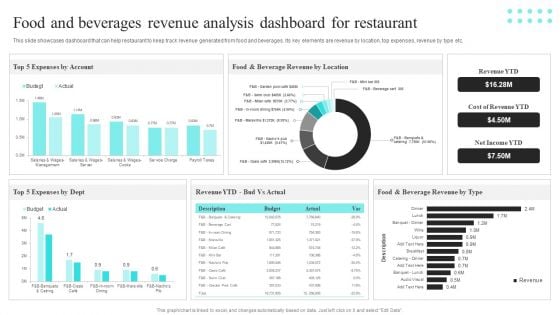
Strategic Promotional Guide For Restaurant Business Advertising Food And Beverages Revenue Analysis Dashboard Template PDF
This slide showcases dashboard that can help restaurant to keep track revenue generated from food and beverages. Its key elements are revenue by location, top expenses, revenue by type etc. This Strategic Promotional Guide For Restaurant Business Advertising Food And Beverages Revenue Analysis Dashboard Template PDF from Slidegeeks makes it easy to present information on your topic with precision. It provides customization options, so you can make changes to the colors, design, graphics, or any other component to create a unique layout. It is also available for immediate download, so you can begin using it right away. Slidegeeks has done good research to ensure that you have everything you need to make your presentation stand out. Make a name out there for a brilliant performance.
Definitive Guide To Conduct Digital Marketing Inspection Content Performance Tracking Dashboard For Social Media Template PDF
This slide indicates the content performance tracking dashboard for social media channels providing information regarding the total number of posts, engagement rate, audience sentiments and multiple hashtags performance. This Definitive Guide To Conduct Digital Marketing Inspection Content Performance Tracking Dashboard For Social Media Template PDF from Slidegeeks makes it easy to present information on your topic with precision. It provides customization options, so you can make changes to the colors, design, graphics, or any other component to create a unique layout. It is also available for immediate download, so you can begin using it right away. Slidegeeks has done good research to ensure that you have everything you need to make your presentation stand out. Make a name out there for a brilliant performance.
10 Interrelated Components Of Process Ppt Business Plan Form PowerPoint Slides
We present our 10 interrelated components of process ppt business plan form PowerPoint Slides.Download and present our Process and Flows PowerPoint Templates because You have a driving passion to excel in your field. Our PowerPoint Templates and Slides will prove ideal vehicles for your ideas. Download our Marketing PowerPoint Templates because It will mark the footprints of your journey. Illustrate how they will lead you to your desired destination. Download our Circle Charts PowerPoint Templates because You should Throw the gauntlet with our PowerPoint Templates and Slides. They are created to take up any challenge. Use our Business PowerPoint Templates because Our PowerPoint Templates and Slides team portray an attitude of elegance. Personify this quality by using them regularly. Download and present our Shapes PowerPoint Templates because You can Be the star of the show with our PowerPoint Templates and Slides. Rock the stage with your ideas.Use these PowerPoint slides for presentations relating to Spiral, steps,ten, concentric, standard, tile, print, sample, chromatic, spectrum, pantone, bright, tone, circle, guide, graphic, abstract, palette, fan, collection, design, swirl, process, set, offset, variation, example, effect, background, mix, image, pigment, swatch, circle charts, circle process . The prominent colors used in the PowerPoint template are Gray, Blue light, Black. Educate them on the basics of fatherhood . Prepare them well with our 10 Interrelated Components Of Process Ppt Business Plan Form PowerPoint Slides.
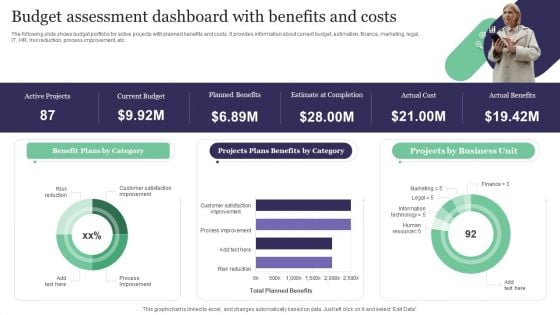
Budget Assessment Dashboard With Benefits And Costs Demonstration PDF
The following slide shows budget portfolio for active projects with planned benefits and costs. It provides information about current budget, estimation, finance, marketing, legal, IT, HR, risk reduction, process improvement, etc. Pitch your topic with ease and precision using this Budget Assessment Dashboard With Benefits And Costs Demonstration PDF. This layout presents information on Benefit Plans By Category, Projects Plans, Benefits Category. It is also available for immediate download and adjustment. So, changes can be made in the color, design, graphics or any other component to create a unique layout.
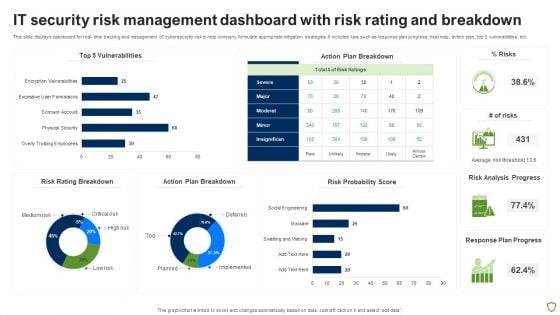
IT Security Risk Management Dashboard With Risk Rating And Breakdown Pictures PDF
This slide displays dashboard for real- time tracking and management of cybersecurity risk to help company formulate appropriate mitigation strategies. It includes kpis such as response plan progress, heat map, action plan, top 5 vulnerabilities, etc. Pitch your topic with ease and precision using this IT Security Risk Management Dashboard With Risk Rating And Breakdown Pictures PDF. This layout presents information on Risk Rating Breakdown, Action Plan Breakdown, Risk Probability Score, Risk Analysis Progress. It is also available for immediate download and adjustment. So, changes can be made in the color, design, graphics or any other component to create a unique layout.

Internal Audit Metrics Analysis Dashboard Ppt Ideas Clipart Images PDF
This slide depicts the key performance indicator dashboard and status for internal audit. It includes information related to the audit observations and plan status. Pitch your topic with ease and precision using this Internal Audit Metrics Analysis Dashboard Ppt Ideas Clipart Images PDF. This layout presents information on Quarterly Audit Observations, Financial Year Internal, Audit Plan Status. It is also available for immediate download and adjustment. So, changes can be made in the color, design, graphics or any other component to create a unique layout.

KPI Dashboard To Track Sales And Operations Process Of Manufacturing Enterprise Brochure PDF
This slide depicts a dashboard to track the key performance metrics in sales and operations process of a manufacturing enterprise to analyze deviations in the actual and planned output. The key performing indicators are percentage deviation, dollar deviation, inventory in hand etc.Pitch your topic with ease and precision using this KPI Dashboard To Track Sales And Operations Process Of Manufacturing Enterprise Brochure PDF. This layout presents information on Planned Output, Yearly Growth, Inventory Hand. It is also available for immediate download and adjustment. So, changes can be made in the color, design, graphics or any other component to create a unique layout.

Monthly Analysis For Actual And Budget Financials Metrics Professional PDF
The following slide shows review report to compare difference in actually spend and planned budget for cost planning in future. It further includes details about maintenance and repairs, supplies, rent, mortgage, etc. Pitch your topic with ease and precision using this Monthly Analysis For Actual And Budget Financials Metrics Professional PDF. This layout presents information on Budget Totals, Expenses, Budget Overview. It is also available for immediate download and adjustment. So, changes can be made in the color, design, graphics or any other component to create a unique layout.
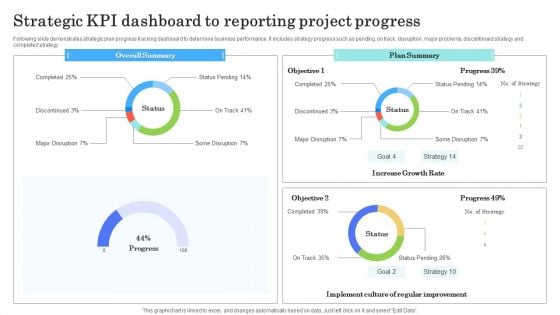
Strategic Kpi Dashboard To Reporting Project Progress Sample PDF
Following slide demonstrates strategic plan progress tracking dashboard to determine business performance. It includes strategy progress such as pending, on track, disruption, major problems, discontinued strategy and completed strategy Pitch your topic with ease and precision using this Strategic Kpi Dashboard To Reporting Project Progress Sample PDF. This layout presents information on Overall Summary, Plan Summary, Growth Rate. It is also available for immediate download and adjustment. So, changes can be made in the color, design, graphics or any other component to create a unique layout.
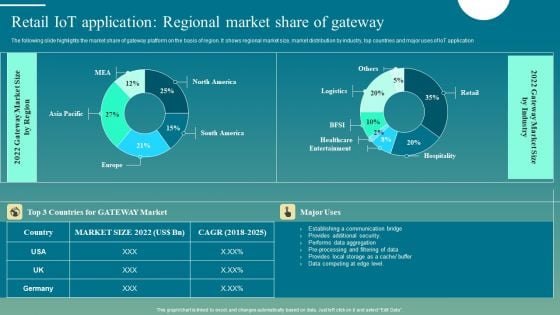
Deploying Iot Solutions In The Retail Market Retail Iot Application Regional Market Share Of Gateway Brochure PDF
The following slide highlights the market share of beacon on the basis of region. It shows regional market size, market distribution by industry, top countries and major uses of IoT component. Retrieve professionally designed Deploying Iot Solutions In The Retail Market Retail Iot Application Regional Market Share Of Gateway Brochure PDF to effectively convey your message and captivate your listeners. Save time by selecting pre-made slideshows that are appropriate for various topics, from business to educational purposes. These themes come in many different styles, from creative to corporate, and all of them are easily adjustable and can be edited quickly. Access them as PowerPoint templates or as Google Slides themes. You do not have to go on a hunt for the perfect presentation because Slidegeeks got you covered from everywhere.

Coffee Cafe Company Profile Revenue Earned By Business Per Employee Formats PDF
Following slide includes information about revenue earned by business by every employee. It includes key components such as revenue in US dollars and years. Retrieve professionally designed Coffee Cafe Company Profile Revenue Earned By Business Per Employee Formats PDF to effectively convey your message and captivate your listeners. Save time by selecting pre made slideshows that are appropriate for various topics, from business to educational purposes. These themes come in many different styles, from creative to corporate, and all of them are easily adjustable and can be edited quickly. Access them as PowerPoint templates or as Google Slides themes. You do not have to go on a hunt for the perfect presentation because Slidegeeks got you covered from everywhere.
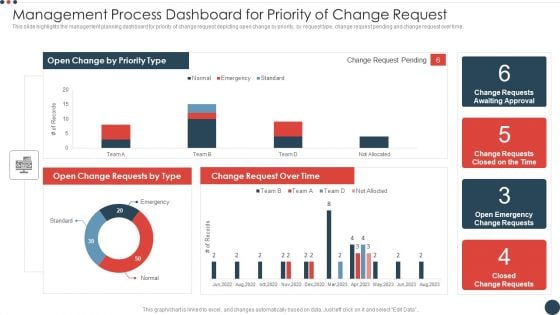
Management Process Dashboard For Priority Of Change Request Demonstration PDF
This slide highlights the management planning dashboard for priority of change request depicting open change by priority, by request type, change request pending and change request over time. Pitch your topic with ease and precision using this management process dashboard for priority of change request demonstration pdf. This layout presents information on management process dashboard for priority of change request. It is also available for immediate download and adjustment. So, changes can be made in the color, design, graphics or any other component to create a unique layout.
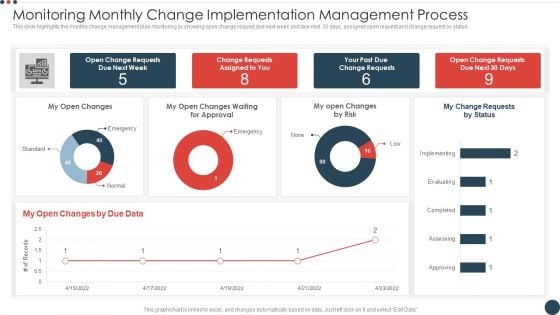
Monitoring Monthly Change Implementation Management Process Summary PDF
This slide highlights the monthly change management plan monitoring by showing open change request due next week and due next 30 days, assigned open request and change request by status. Pitch your topic with ease and precision using this monitoring monthly change implementation management process summary pdf. This layout presents information on monitoring monthly change implementation management process. It is also available for immediate download and adjustment. So, changes can be made in the color, design, graphics or any other component to create a unique layout.
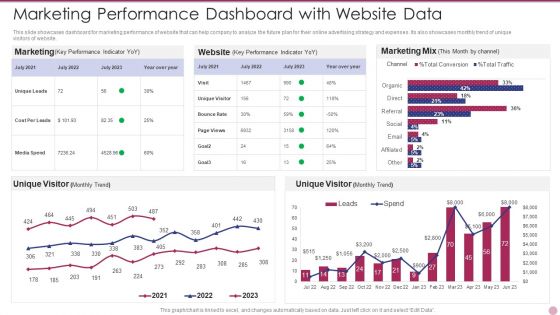
Marketing Performance Dashboard With Website Data Elements PDF
This slide showcases dashboard for marketing performance of website that can help company to analyze the future plan for their online advertising strategy and expenses. Its also showcases monthly trend of unique visitors of website. Pitch your topic with ease and precision using this Marketing Performance Dashboard With Website Data Elements PDF. This layout presents information on Marketing Performance Dashboard With Website Data. It is also available for immediate download and adjustment. So, changes can be made in the color, design, graphics or any other component to create a unique layout.
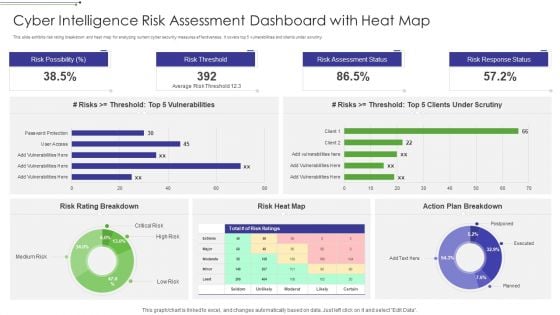
Cyber Intelligence Risk Assessment Dashboard With Heat Map Portrait PDF
This slide exhibits risk rating breakdown and heat map for analyzing current cyber security measures effectiveness. It covers top 5 vulnerabilities and clients under scrutiny. Pitch your topic with ease and precision using this Cyber Intelligence Risk Assessment Dashboard With Heat Map Portrait PDF This layout presents information on Risk Rating Breakdown, Action Plan Breakdown, Risk Possibility It is also available for immediate download and adjustment. So, changes can be made in the color, design, graphics or any other component to create a unique layout.
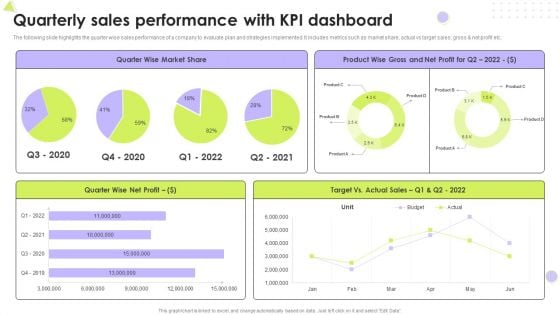
Quarterly Sales Performance With Kpi Dashboard Introduction PDF
The following slide highlights the quarter wise sales performance of a company to evaluate plan and strategies implemented. It includes metrics such as market share, actual vs target sales, gross and net profit etc. Pitch your topic with ease and precision using this Quarterly Sales Performance With Kpi Dashboard Introduction PDF. This layout presents information on Market Share, Net Profit, Target. It is also available for immediate download and adjustment. So, changes can be made in the color, design, graphics or any other component to create a unique layout.
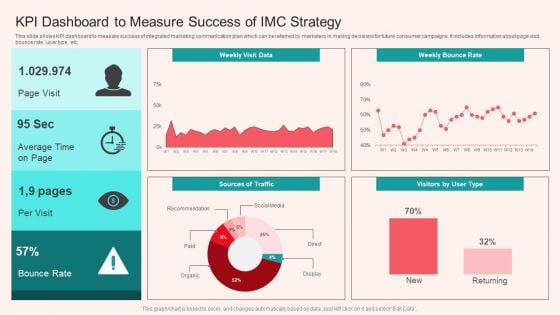
KPI Dashboard To Measure Success Of IMC Strategy Microsoft PDF
This slide shows KPI dashboard to measure success of integrated marketing communication plan which can be referred by marketers in making decisions for future consumer campaigns. It includes information about page visit, bounce rate, user type, etc. Pitch your topic with ease and precision using this KPI Dashboard To Measure Success Of IMC Strategy Microsoft PDF. This layout presents information on Average, Bounce Rate. It is also available for immediate download and adjustment. So, changes can be made in the color, design, graphics or any other component to create a unique layout.

Project Metrics Dashboard With Average Margin Sample PDF
This slide focuses on project management dashboard which covers number of active projects, average margin, revenues, costs, tasks status, resources with planned and actual efforts, available hours, tasks assignments with project deadlines, client, etc. Pitch your topic with ease and precision using this Project Metrics Dashboard With Average Margin Sample PDF. This layout presents information on Average Margin, Revenue, Cost. It is also available for immediate download and adjustment. So, changes can be made in the color, design, graphics or any other component to create a unique layout.
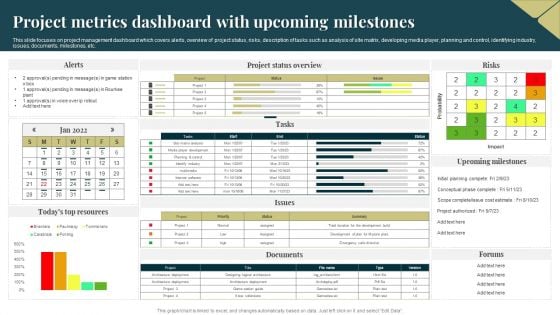
Project Metrics Dashboard With Upcoming Milestones Demonstration PDF
This slide focuses on project management dashboard which covers alerts, overview of project status, risks, description of tasks such as analysis of site matrix, developing media player, planning and control, identifying industry, issues, documents, milestones, etc. Pitch your topic with ease and precision using this Project Metrics Dashboard With Upcoming Milestones Demonstration PDF. This layout presents information on Probability, Project, Risks. It is also available for immediate download and adjustment. So, changes can be made in the color, design, graphics or any other component to create a unique layout.
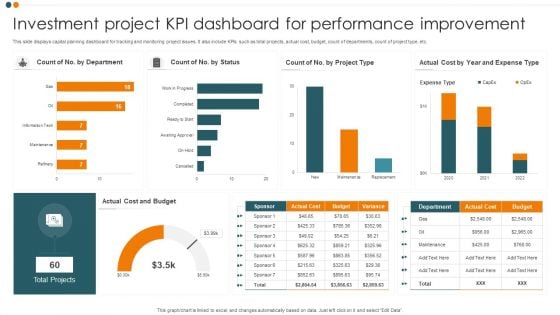
Investment Project KPI Dashboard For Performance Improvement Guidelines PDF
This slide displays capital planning dashboard for tracking and monitoring project issues. It also include KPIs such as total projects, actual cost, budget, count of departments, count of project type, etc. Pitch your topic with ease and precision using this Investment Project KPI Dashboard For Performance Improvement Guidelines PDF. This layout presents information on Cost And Budget, Total Projects, Expense Type. It is also available for immediate download and adjustment. So, changes can be made in the color, design, graphics or any other component to create a unique layout.
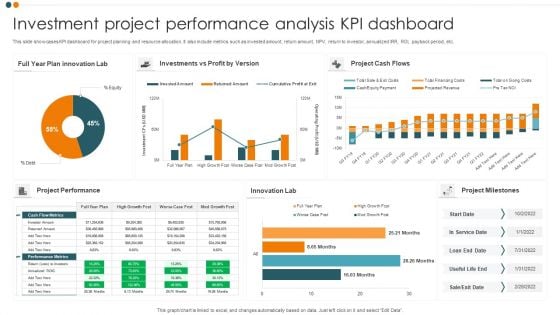
Investment Project Performance Analysis KPI Dashboard Professional PDF
This slide showcases KPI dashboard for project planning and resource allocation. It also include metrics such as invested amount, return amount, NPV, return to investor, annualized IRR, ROI, payback period, etc. Pitch your topic with ease and precision using this Investment Project Performance Analysis KPI Dashboard Professional PDF. This layout presents information on Project Cash Flows, Project Performance, Innovation Lab. It is also available for immediate download and adjustment. So, changes can be made in the color, design, graphics or any other component to create a unique layout.
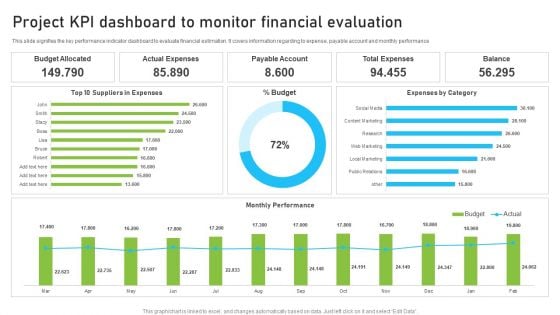
Project KPI Dashboard To Monitor Financial Evaluation Background PDF
This slide signifies the construction project management projection plan. It covers information regarding to the estimate ID, Task, effort hours, resource quantity, performance factor and duration evaluation. Pitch your topic with ease and precision using this Project KPI Dashboard To Monitor Financial Evaluation Background PDF. This layout presents information on Actual Expenses, Payable Account, Budget Allocated. It is also available for immediate download and adjustment. So, changes can be made in the color, design, graphics or any other component to create a unique layout.
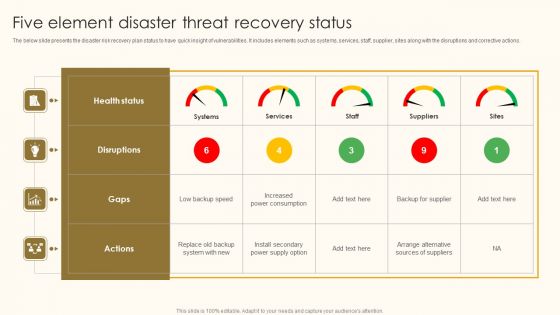
Five Element Disaster Threat Recovery Status Ppt Outline Inspiration PDF
The below slide presents the disaster risk recovery plan status to have quick insight of vulnerabilities. It includes elements such as systems, services, staff, supplier, sites along with the disruptions and corrective actions. Pitch your topic with ease and precision using this Five Element Disaster Threat Recovery Status Ppt Outline Inspiration PDF. This layout presents information on Health Status, Disruptions, Gaps. It is also available for immediate download and adjustment. So, changes can be made in the color, design, graphics or any other component to create a unique layout.
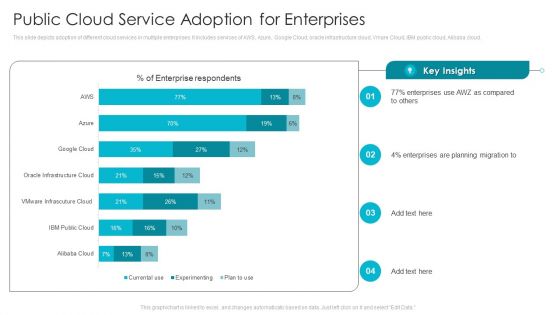
Public Cloud Service Adoption For Enterprises Ppt Inspiration Graphic Images PDF
This slide depicts adoption of different cloud services in multiple enterprises. It includes services of AWS, Azure, Google Cloud, oracle infrastructure cloud, Vmare Cloud, IBM public cloud, Alibaba cloud. Pitch your topic with ease and precision using this Public Cloud Service Adoption For Enterprises Ppt Inspiration Graphic Images PDF. This layout presents information on Planning Migration, Alibaba Cloud, IBM Public Cloud. It is also available for immediate download and adjustment. So, changes can be made in the color, design, graphics or any other component to create a unique layout.
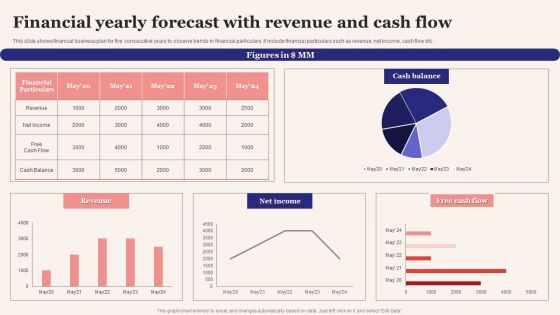
Financial Yearly Forecast With Revenue And Cash Flow Formats PDF
This slide shows financial business plan for five consecutive years to observe trends in financial particulars. It include financial particulars such as revenue, net income, cash flow etc. Pitch your topic with ease and precision using this Financial Yearly Forecast With Revenue And Cash Flow Formats PDF. This layout presents information on Financial Particulars, Cash Balance, Free Cash Flow. It is also available for immediate download and adjustment. So, changes can be made in the color, design, graphics or any other component to create a unique layout.
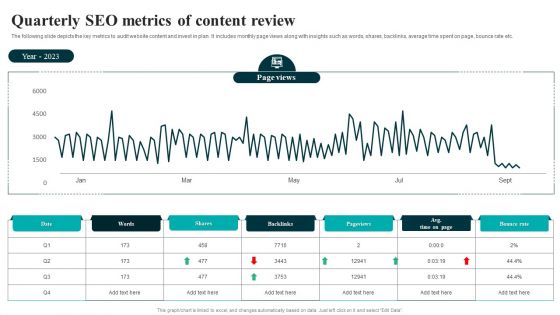
Quarterly SEO Metrics Of Content Review Structure PDF
The following slide depicts the key metrics to audit website content and invest in plan. It includes monthly page views along with insights such as words, shares, backlinks, average time spent on page, bounce rate etc. Pitch your topic with ease and precision using this Quarterly SEO Metrics Of Content Review Structure PDF. This layout presents information on Quarterly SEO, Metrics Of Content Review. It is also available for immediate download and adjustment. So, changes can be made in the color, design, graphics or any other component to create a unique layout.
Dashboard For Tracking Progress Of Media Relations Management Strategies Slides PDF
This slide provides dashboard showcasing impact of media relations plan which helps track campaign performance. It provides information regarding consumer engagement, bounce rate, lead generation, conversion rates and top channels used. Pitch your topic with ease and precision using this Dashboard For Tracking Progress Of Media Relations Management Strategies Slides PDF. This layout presents information on Dashboard For Tracking, Progress Of Media, Relations Management Strategies. It is also available for immediate download and adjustment. So, changes can be made in the color, design, graphics or any other component to create a unique layout.
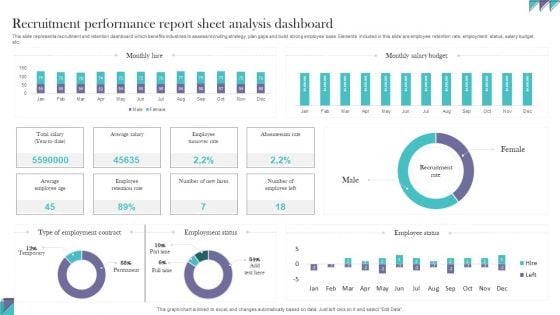
Recruitment Performance Report Sheet Analysis Dashboard Information PDF
This slide represents recruitment and retention dashboard which benefits industries to assess recruiting strategy, plan gaps and build strong employee base. Elements included in this slide are employee retention rate, employment status, salary budget, etc. Pitch your topic with ease and precision using this Recruitment Performance Report Sheet Analysis Dashboard Information PDF. This layout presents information onRecruitment Performance, Report Sheet Analysis. It is also available for immediate download and adjustment. So, changes can be made in the color, design, graphics or any other component to create a unique layout.
Tracking School Communication Strategy Performance Rules PDF
The following slide highlights tracking performance of school communication plan. It includes parameters such as parents satisfaction with guidance and resources provided by schools, parents want teachers to reduce frequency of contacting them, parents want teachers to communicate more often etc. Pitch your topic with ease and precision using this Tracking School Communication Strategy Performance Rules PDF. This layout presents information on Strongly Agree, Agree, Improved Methods. It is also available for immediate download and adjustment. So, changes can be made in the color, design, graphics or any other component to create a unique layout.
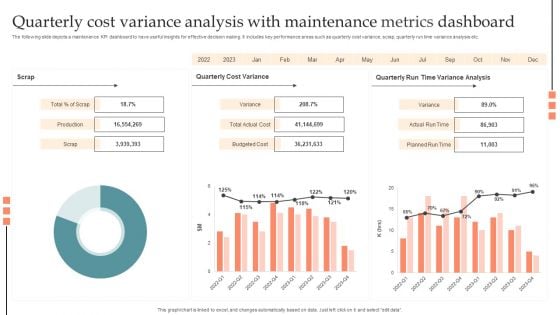
Quarterly Cost Variance Analysis With Maintenance Metrics Dashboard Information PDF
The following slide depicts a maintenance KPI dashboard to have useful insights for effective decision making. It includes key performance areas such as quarterly cost variance, scrap, quarterly run time variance analysis etc. Pitch your topic with ease and precision using this Quarterly Cost Variance Analysis With Maintenance Metrics Dashboard Information PDF. This layout presents information on Production, Budgeted Cost, Planned Run Time, Actual Run Time. It is also available for immediate download and adjustment. So, changes can be made in the color, design, graphics or any other component to create a unique layout.
Tracker For Time Based Quality Kpis In Project Management Ideas PDF
This slide displays project wise comparative analysis on the basis of planned and actual time it takes for completion. It includes details such as number of tasks and work completed, average number of hours, start and end dates, etc. Pitch your topic with ease and precision using this Tracker For Time Based Quality Kpis In Project Management Ideas PDF. This layout presents information on Time, Work Completed, Avg Number, Hours Per Task. It is also available for immediate download and adjustment. So, changes can be made in the color, design, graphics or any other component to create a unique layout.
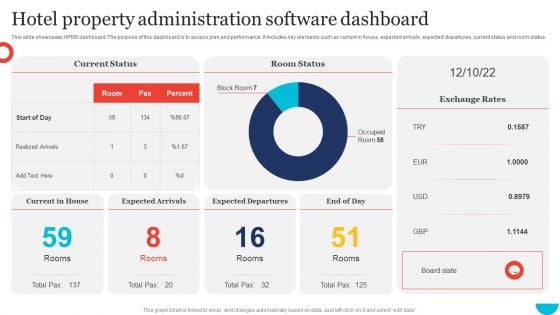
Hotel Property Administration Software Dashboard Guidelines PDF
This slide showcases HPMS dashboard. The purpose of this dashboard is to access plan and performance. It includes key elements such as current in house, expected arrivals, expected departures, current status and room status. Pitch your topic with ease and precision using this Hotel Property Administration Software Dashboard Guidelines PDF. This layout presents information on Current Status, Room Status, Exchange Rates. It is also available for immediate download and adjustment. So, changes can be made in the color, design, graphics or any other component to create a unique layout.
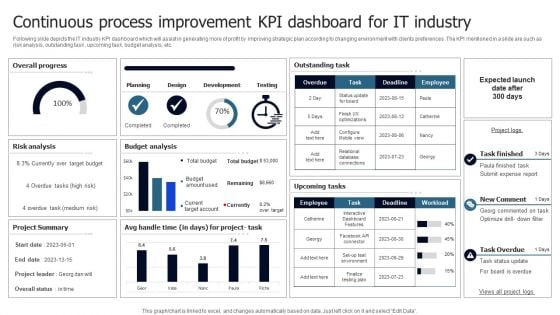
Continuous Process Improvement KPI Dashboard For IT Industry Clipart PDF
Following slide depicts the IT industry KPI dashboard which will assist in generating more of profit by improving strategic plan according to changing environment with clients preferences .The KPI mentioned in a slide are such as risk analysis, outstanding task , upcoming task, budget analysis, etc. Pitch your topic with ease and precision using this Continuous Process Improvement KPI Dashboard For IT Industry Clipart PDF. This layout presents information on Overall Progress, Risk Analysis, Budget Analysis. It is also available for immediate download and adjustment. So, changes can be made in the color, design, graphics or any other component to create a unique layout.
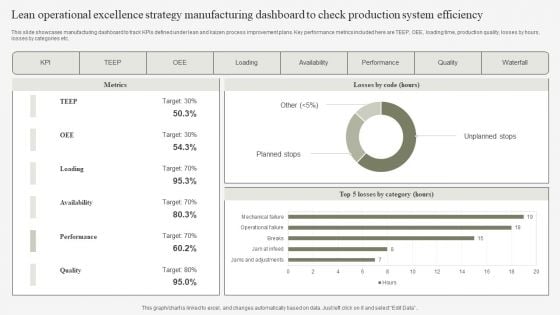
Lean Operational Excellence Strategy Manufacturing Dashboard To Check Production System Efficiency Pictures PDF
This slide showcases manufacturing dashboard to track KPIs defined under lean and kaizen process improvement plans. Key performance metrics included here are TEEP, OEE, loading time, production quality, losses by hours, losses by categories etc. Pitch your topic with ease and precision using this Lean Operational Excellence Strategy Manufacturing Dashboard To Check Production System Efficiency Pictures PDF. This layout presents information on Loading, Availability, Performance. It is also available for immediate download and adjustment. So, changes can be made in the color, design, graphics or any other component to create a unique layout.
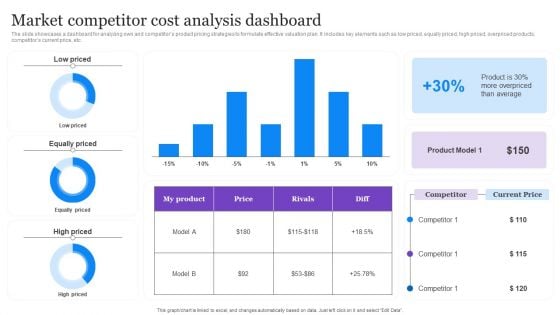
Market Competitor Cost Analysis Dashboard Graphics PDF
The slide showcases a dashboard for analyzing own and competitors product pricing strategies to formulate effective valuation plan. It includes key elements such as low priced, equally priced, high priced, overpriced products, competitors current price, etc. Pitch your topic with ease and precision using this Market Competitor Cost Analysis Dashboard Graphics PDF. This layout presents information on Average, Product Model, Cost Analysis Dashboard. It is also available for immediate download and adjustment. So, changes can be made in the color, design, graphics or any other component to create a unique layout.


 Continue with Email

 Home
Home


