Infographic Icons
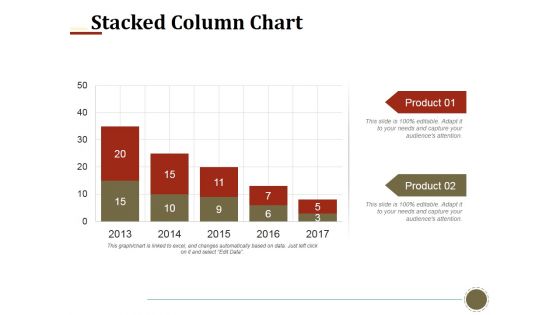
Stacked Column Chart Ppt PowerPoint Presentation Infographics Smartart
This is a stacked column chart ppt powerpoint presentation infographics smartart. This is a two stage process. The stages in this process are stacked column chart, business, finance, marketing, strategy.
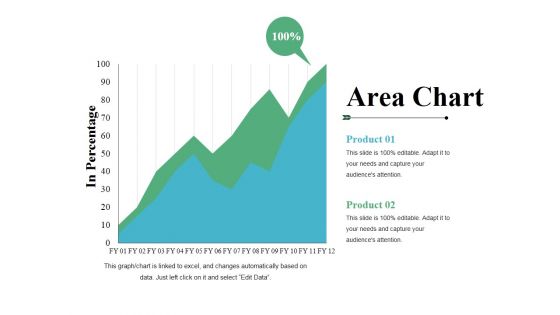
Area Chart Ppt PowerPoint Presentation Infographics Visual Aids
This is a area chart ppt powerpoint presentation infographics visual aids. This is a two stage process. The stages in this process are product, area chart, in percentage, growth, success.
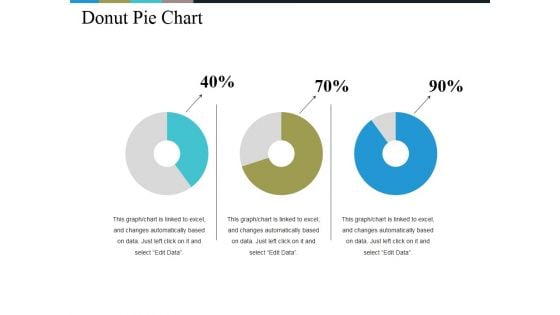
Donut Pie Chart Ppt PowerPoint Presentation Infographics Background Images
This is a donut pie chart ppt powerpoint presentation infographics background images. This is a three stage process. The stages in this process are chart, percentage, business, management, process.
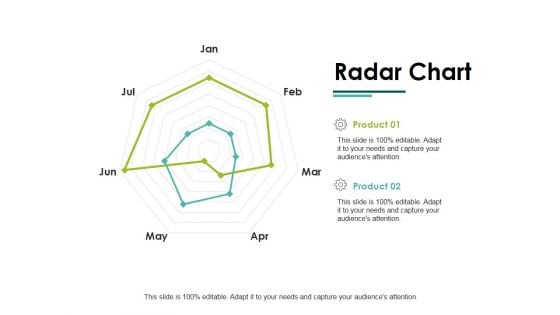
Radar Chart Ppt PowerPoint Presentation Infographics Slide Download
This is a radar chart ppt powerpoint presentation infographics slide download. This is a two stage process. The stages in this process are radar chart, finance, marketing, strategy, business.
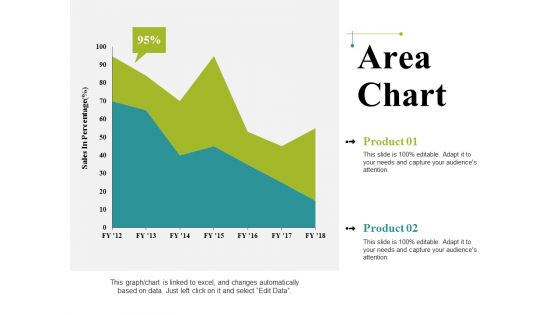
Area Chart Ppt PowerPoint Presentation Infographics Graphics Pictures
This is a area chart ppt powerpoint presentation infographics graphics pictures. This is a two stage process. The stages in this process are business, sales in percentage, area chart, marketing, graph.
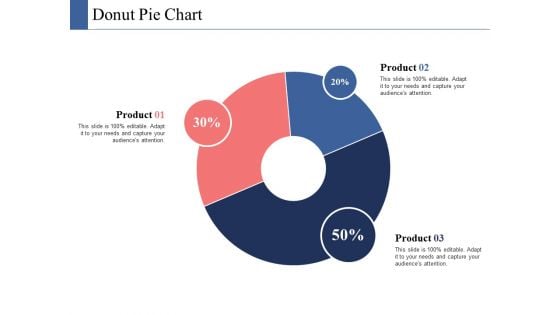
Donut Pie Chart Ppt PowerPoint Presentation Infographics Ideas
This is a donut pie chart ppt powerpoint presentation infographics ideas. This is a three stage process. The stages in this process are donut pie chart, finance, marketing, strategy, analysis.
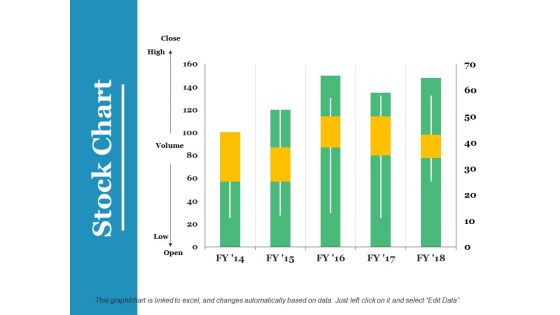
Stock Chart Ppt PowerPoint Presentation Infographics Graphics Example
This is a stock chart ppt powerpoint presentation infographics graphics example. This is a five stage process. The stages in this process are stock chart, finance, business, planning, marketing.

Area Chart Finance Ppt PowerPoint Presentation Infographics Layouts
This is a area chart finance ppt powerpoint presentation infographics layouts. This is a one stages process. The stages in this process are area chart, financial, marketing, planning, business.
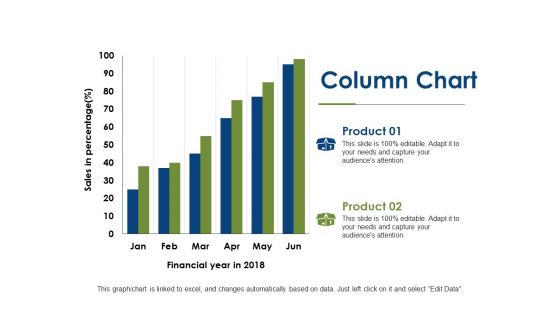
Column Chart Finance Ppt PowerPoint Presentation Infographics Backgrounds
This is a column chart finance ppt powerpoint presentation infographics backgrounds. This is a two stage process. The stages in this process are column chart, investment, marketing, finance, analysis.
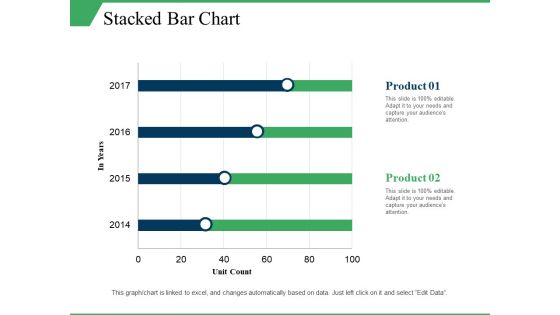
Stacked Bar Chart Ppt PowerPoint Presentation Infographics Elements
This is a stacked bar chart ppt powerpoint presentation infographics elements. This is a two stage process. The stages in this process are stacked bar chart, product, unit count, in year.
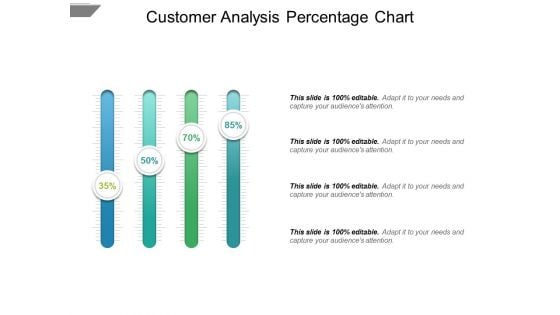
Customer Analysis Percentage Chart Ppt PowerPoint Presentation Infographics Master Slide
This is a customer analysis percentage chart ppt powerpoint presentation infographics master slide. This is a four stage process. The stages in this process are comparison chart, comparison table, comparison matrix.
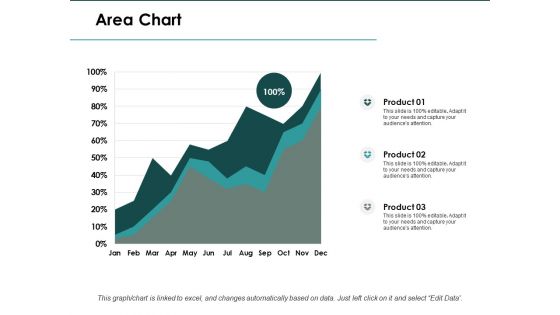
Area Chart Finance Ppt PowerPoint Presentation Infographics Slide
This is a area chart finance ppt powerpoint presentation infographics slide. This is a three stage process. The stages in this process are area chart, finance, marketing, analysis, investment.
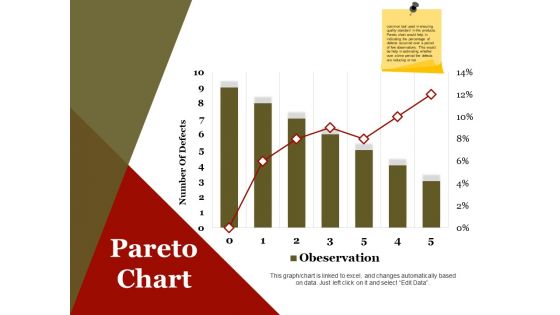
Pareto Chart Ppt PowerPoint Presentation Infographics Design Inspiration
This is a pareto chart ppt powerpoint presentation infographics design inspiration. This is a seven stage process. The stages in this process are number of defects, business, marketing, finance.
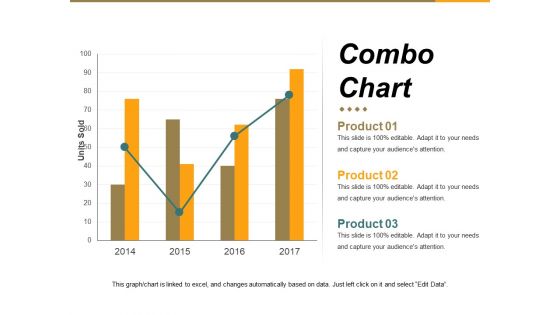
Combo Chart Ppt PowerPoint Presentation Infographics Example Introduction
This is a combo chart ppt powerpoint presentation infographics example introduction. This is a four stage process. The stages in this process are units sold, business, marketing, graph, growth.

Line Chart Ppt PowerPoint Presentation Infographics Graphic Images
This is a line chart ppt powerpoint presentation infographics graphic images. This is a two stage process. The stages in this process are sales in percentage, financial years, growth, business, marketing.
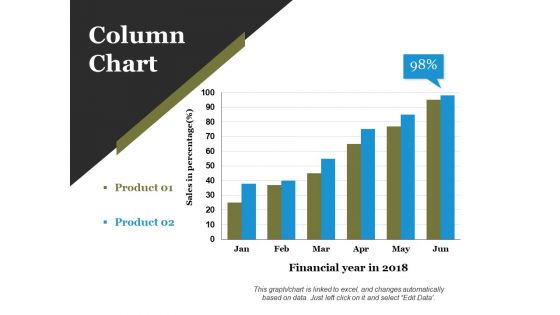
Column Chart Ppt PowerPoint Presentation Infographics Layout Ideas
This is a column chart ppt powerpoint presentation infographics layout ideas. This is a two stage process. The stages in this process are financial year in, business, marketing, growth, graph.
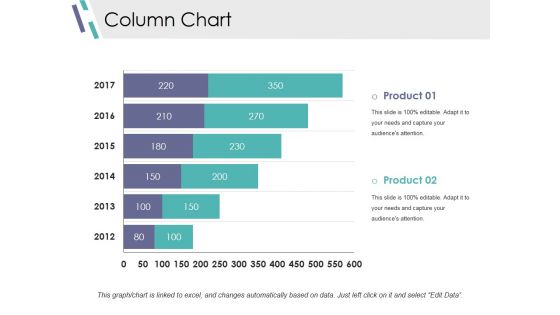
Column Chart Ppt PowerPoint Presentation Infographics Design Inspiration
This is a column chart ppt powerpoint presentation infographics design inspiration. This is a two stage process. The stages in this process are slide bar, marketing, strategy, finance, planning.
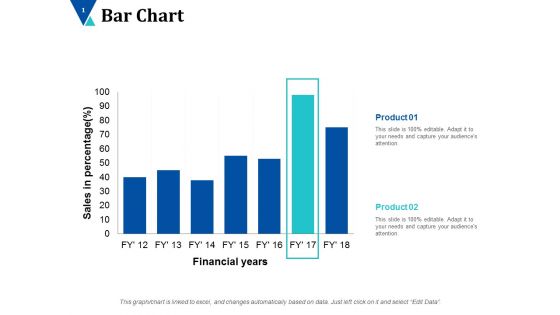
Bar Chart Finance Ppt PowerPoint Presentation Infographics Background Images
This is a bar chart finance ppt powerpoint presentation infographics background images. This is a seven stages process. The stages in this process are alpha testing, beta testing, full scale show.
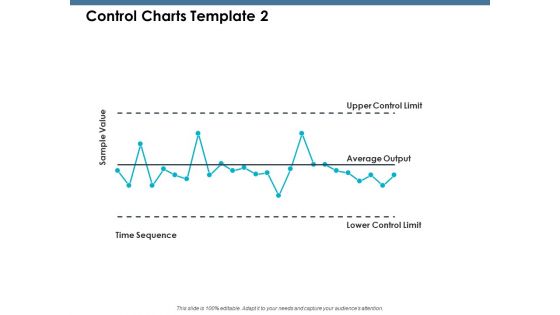
Control Charts Sample Value Ppt PowerPoint Presentation Infographics Demonstration
This is a control charts sample value ppt powerpoint presentation infographics demonstration. This is a five stage process. The stages in this process are product, percentage, marketing, business, management.
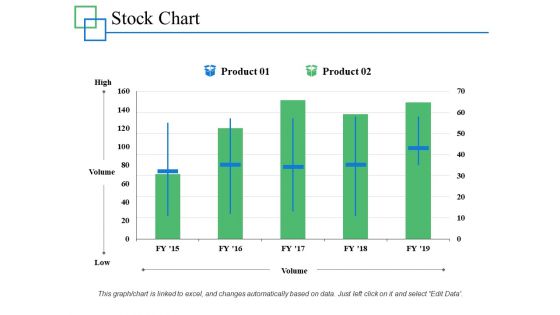
Stock Chart Management Investment Ppt PowerPoint Presentation Infographics Professional
This is a stock chart management investment ppt powerpoint presentation infographics professional. This is a two stage process. The stages in this process are marketing, business, management, percentage, product.
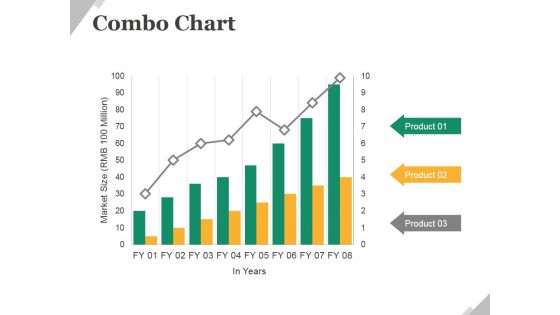
Combo Chart Ppt PowerPoint Presentation Infographics Example Topics
This is a combo chart ppt powerpoint presentation infographics example topics. This is a eight stage process. The stages in this process are business, marketing, growth, combo chart, management.
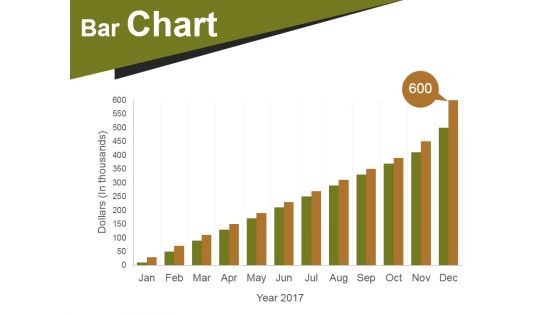
Bar Chart Ppt PowerPoint Presentation Infographics Designs Download
This is a bar chart ppt powerpoint presentation infographics designs download. This is a twelve stage process. The stages in this process are bar chart, business, marketing, strategy, success.
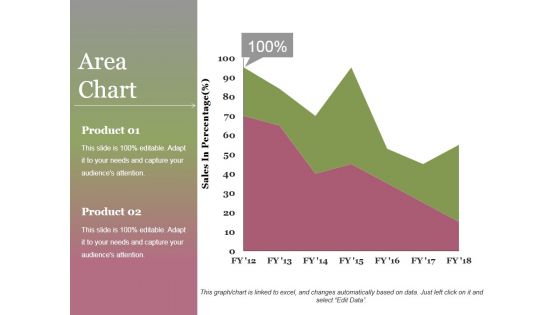
Area Chart Ppt PowerPoint Presentation Infographics File Formats
This is a area chart ppt powerpoint presentation infographics file formats. This is a two stage process. The stages in this process are area chart, product, sales in percentage, growth, success.

Area Chart Ppt PowerPoint Presentation Infographics Example Topics
This is a area chart ppt powerpoint presentation infographics example topics. This is a two stage process. The stages in this process are area chart, finance, marketing, strategy, business.
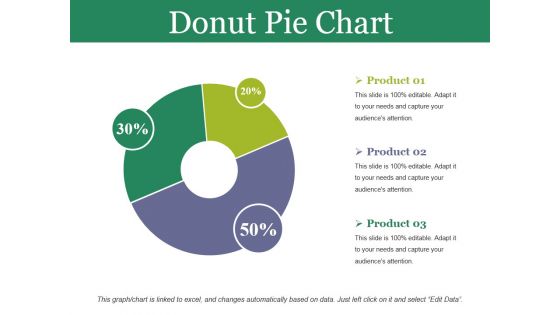
Donut Pie Chart Ppt PowerPoint Presentation Infographics Design Inspiration
This is a donut pie chart ppt powerpoint presentation infographics design inspiration. This is a three stage process. The stages in this process are donut pie chart, business, marketing, strategy, planning.
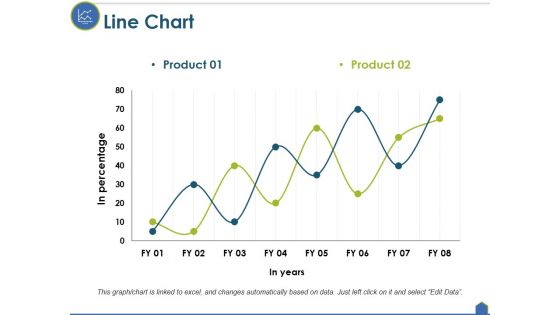
Line Chart Ppt PowerPoint Presentation Infographics File Formats
This is a line chart ppt powerpoint presentation infographics file formats. This is a two stage process. The stages in this process are line chart, growth, strategy, analysis, business.

Radar Chart Ppt PowerPoint Presentation Infographics Visual Aids
This is a radar chart ppt powerpoint presentation infographics visual aids. This is a two stage process. The stages in this process are radar chart, product, finance, business, marketing.
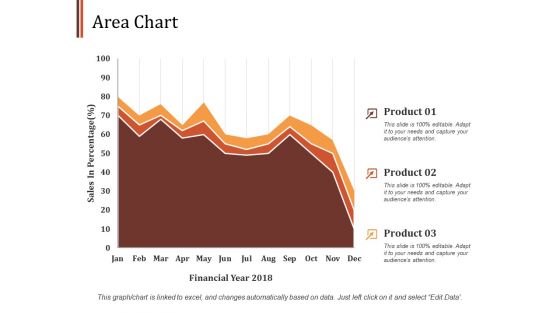
Area Chart Finance Ppt PowerPoint Presentation Infographics Design Ideas
This is a area chart finance ppt powerpoint presentation infographics design ideas. This is a three stage process. The stages in this process are area chart, finance, marketing, management, investment.
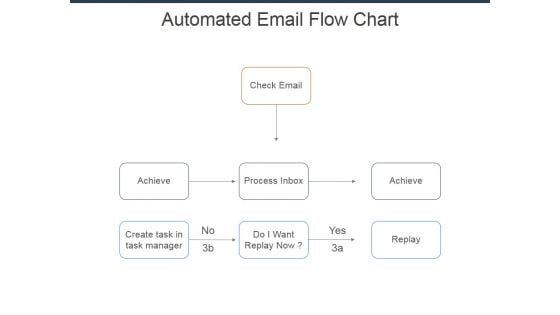
Automated Email Flow Chart Ppt Powerpoint Presentation Infographics Show
This is a automated email flow chart ppt powerpoint presentation infographics show. This is a three stage process. The stages in this process are check email, achieve, process inbox, do i want replay now, create task in task manager.

Donut Pie Chart Ppt PowerPoint Presentation Infographics Outfit
This is a donut pie chart ppt powerpoint presentation infographics outfit. This is a three stage process. The stages in this process are business, strategy, analysis, planning, dashboard, finance.

Scatter Bubble Chart Ppt PowerPoint Presentation Infographics Backgrounds
This is a scatter bubble chart ppt powerpoint presentation infographics backgrounds. This is a five stage process. The stages in this process are highest sale, in price, growth, success, business.
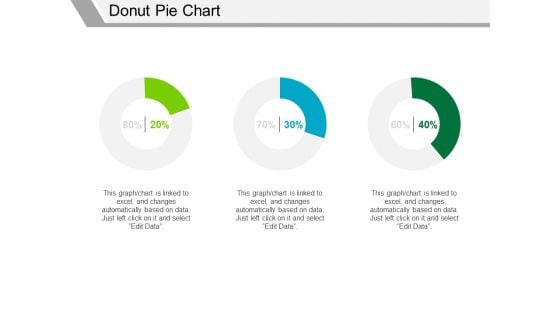
Donut Pie Chart Ppt PowerPoint Presentation Infographics Background Designs
This is a donut pie chart ppt powerpoint presentation infographics background designs. This is a three stage process. The stages in this process are finance, business, marketing, strategy, percentage.
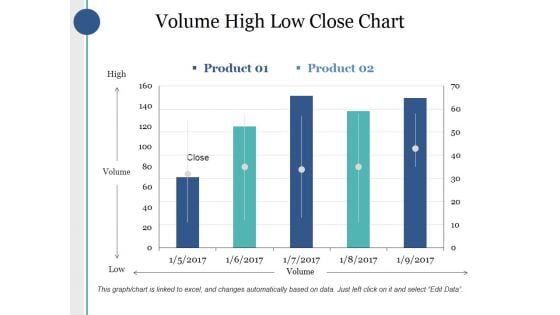
Volume High Low Close Chart Ppt PowerPoint Presentation Infographics Good
This is a volume high low close chart ppt powerpoint presentation infographics good. This is a two stage process. The stages in this process are high, volume, low, product, close.
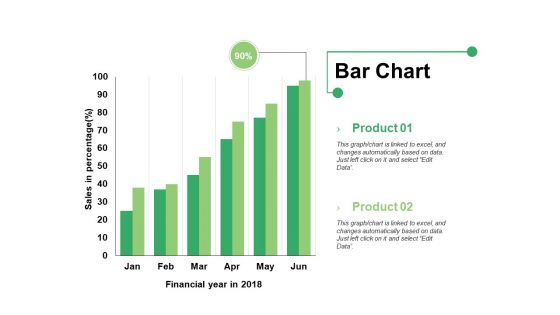
Bar Chart Ppt PowerPoint Presentation Infographics Format Ideas
This is a bar chart ppt powerpoint presentation infographics format ideas. This is a two stage process. The stages in this process are bar graph, product, financial year, sales in percentage.
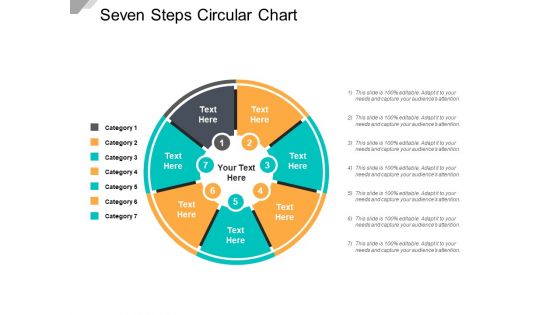
Seven Steps Circular Chart Ppt PowerPoint Presentation Infographics Designs
This is a seven steps circular chart ppt powerpoint presentation infographics designs. This is a seven stage process. The stages in this process are sectioned circle, segmented circle, partitioned circle.
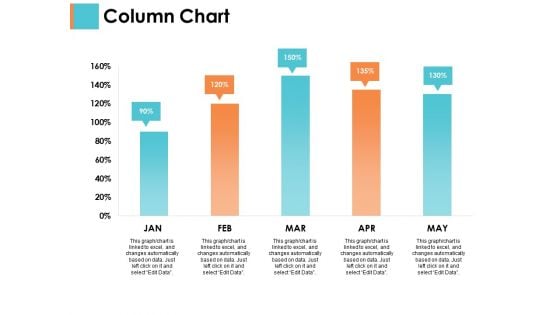
Column Chart Sample Budget Ppt Ppt PowerPoint Presentation Infographics Brochure
This is a column chart sample budget ppt ppt powerpoint presentation infographics brochure. This is a two stage process. The stages in this process are business, management, strategy, analysis, marketing.
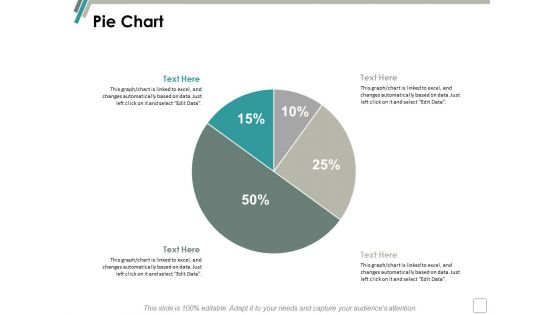
Pie Chart Finance Marketing Ppt Powerpoint Presentation Infographics Background
This is a pie chart finance marketing ppt powerpoint presentation infographics background. This is a two stage process. The stages in this process are finance, marketing, management, investment, analysis.
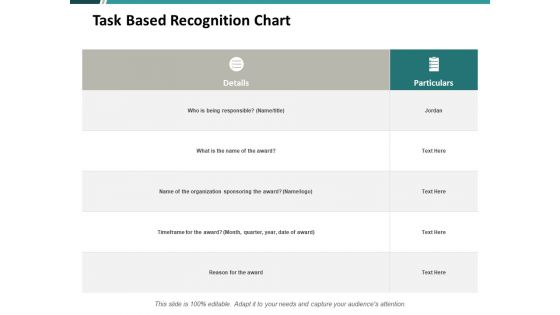
Task Based Recognition Chart Ppt PowerPoint Presentation Infographics Pictures
This is a task based recognition chart ppt powerpoint presentation infographics pictures. This is a three stage process. The stages in this process are compare, marketing, business, management, planning.
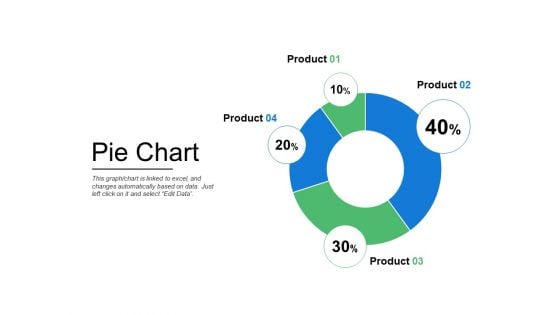
Pie Chart Finance Ppt PowerPoint Presentation Infographics Mockup
This is a pie chart finance ppt powerpoint presentation infographics mockup . This is a four stage process. The stages in this process are finance, marketing, management, investment, analysis.
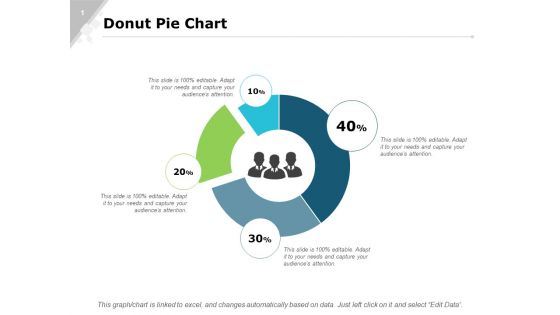
Donut Pie Chart Bar Ppt PowerPoint Presentation Infographics Slide Portrait
This is a donut pie chart bar ppt powerpoint presentation infographics slide portrait. This is a four stage process. The stages in this process are finance, marketing, analysis, investment, million.
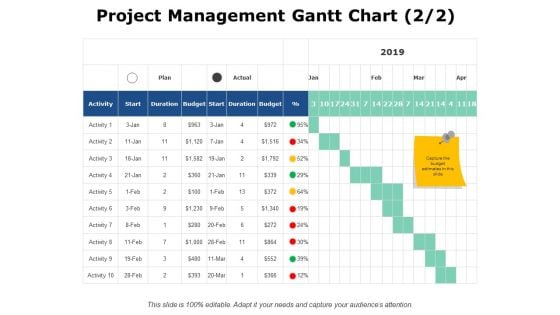
Project Management Gantt Chart Finance Ppt PowerPoint Presentation Infographics Files
This is a project management gantt chart finance ppt powerpoint presentation infographics files. This is a six stage process. The stages in this process are business, planning, strategy, marketing, management.
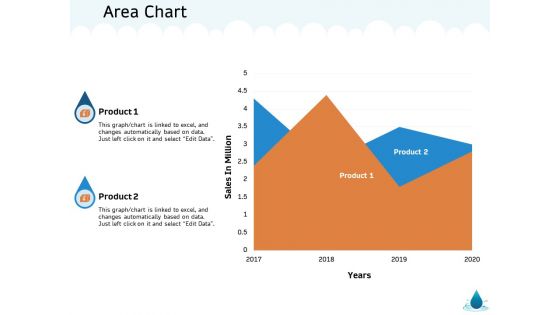
Water NRM Area Chart Ppt Infographics Themes PDF
Presenting this set of slides with name water nrm area chart ppt infographics themes pdf. The topics discussed in these slides are product 1, product 2. This is a completely editable PowerPoint presentation and is available for immediate download. Download now and impress your audience.
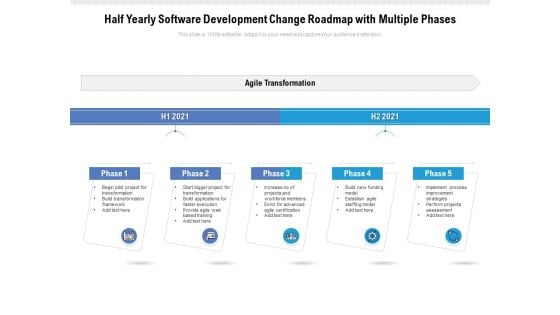
Half Yearly Software Development Change Roadmap With Multiple Phases Infographics
A cohesive work plan is essential for achieving the desired target. Communicate your vision and lay a firm ground in front of your audience with our PowerPoint layout. Align your project milestones, budgets, deliverables, deadlines, and all the requisite information for a dynamic presentation by employing this amazingly designed half yearly software development change roadmap with multiple phases infographics. Maximize team efficiency and streamline a work plan efficiently by introducing our ready made roadmap PowerPoint theme. You can quickly establish coordination between different activities across the organization and present an insight to your colleagues by utilizing this useful business tool. Color code specific tasks, prioritize, and keep a close eye on the deadlines with the help of our eye catchy PowerPoint template. Download our half yearly software development change roadmap with multiple phases infographics for excelling at productive management.
Project Accomplishment Tracking With Different Phases Infographics PDF
Showcasing this set of slides titled project accomplishment tracking with different phases infographics pdf. The topics addressed in these templates are project accomplishment tracking with different phases. All the content presented in this PPT design is completely editable. Download it and make adjustments in color, background, font etc. as per your unique business setting.
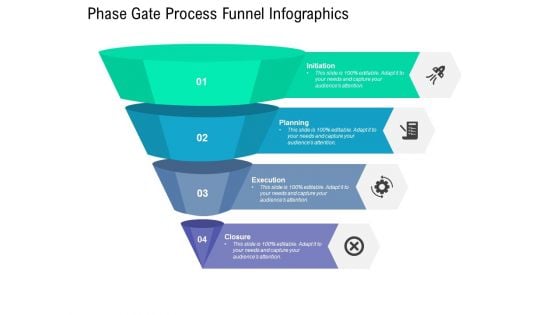
Phase Gate Process Funnel Infographics Ppt PowerPoint Presentation Layouts Layout
Presenting this set of slides with name phase gate process funnel infographics ppt powerpoint presentation layouts layout. This is a four stage process. The stages in this process are project funnel, performance management, planning. This is a completely editable PowerPoint presentation and is available for immediate download. Download now and impress your audience.
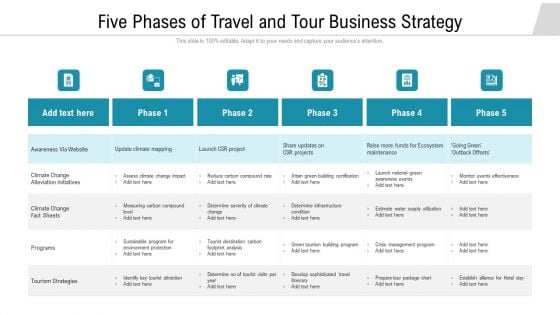
Five Phases Of Travel And Tour Business Strategy Infographics PDF
Showcasing this set of slides titled five phases of travel and tour business strategy infographics pdf. The topics addressed in these templates are climate change alleviation initiatives, tourism strategies, infrastructure. All the content presented in this PPT design is completely editable. Download it and make adjustments in color, background, font etc. as per your unique business setting.
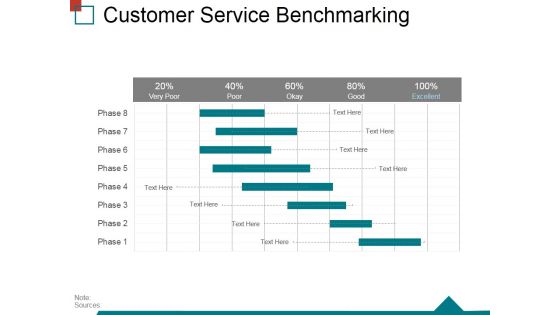
Customer Service Benchmarking Template 1 Ppt PowerPoint Presentation Infographics Themes
This is a customer service benchmarking template 1 ppt powerpoint presentation infographics themes. This is a five stage process. The stages in this process are business, process, marketing, management, customer service benchmarking.
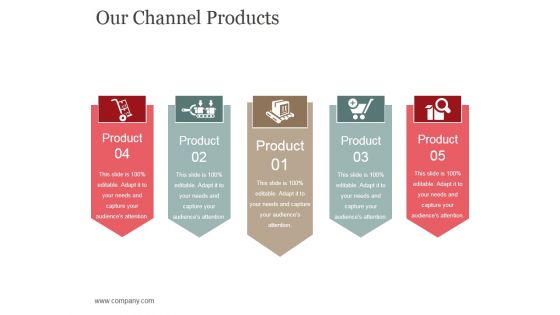
Our Channel Products Template 1 Ppt PowerPoint Presentation Infographics Themes
This is a our channel products template 1 ppt powerpoint presentation infographics themes. This is a five stage process. The stages in this process are channel, business, marketing, innovation, management.
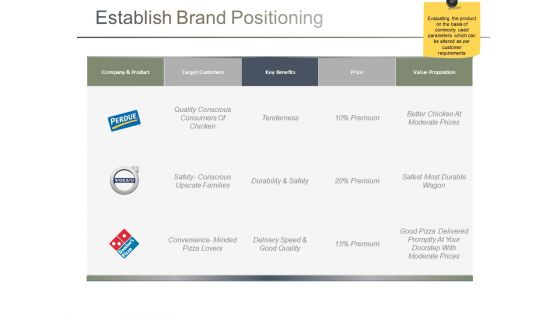
Establish Brand Positioning Ppt PowerPoint Presentation Infographics Themes
This is a establish brand positioning ppt powerpoint presentation infographics themes. This is a three stage process. The stages in this process are target customers, company and product, key benefits, price, value proposition.
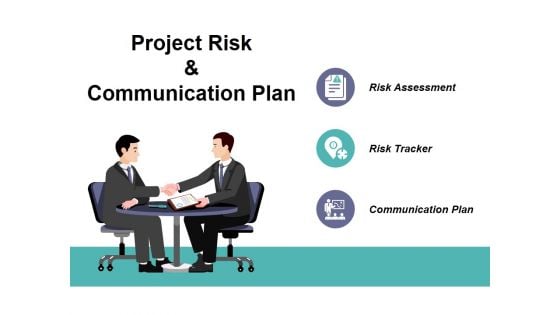
Project Risk And Communication Plan Ppt PowerPoint Presentation Infographics Themes
This is a project risk and communication plan ppt powerpoint presentation infographics themes. This is a three stage process. The stages in this process are risk assessment, risk tracker, communication plan.
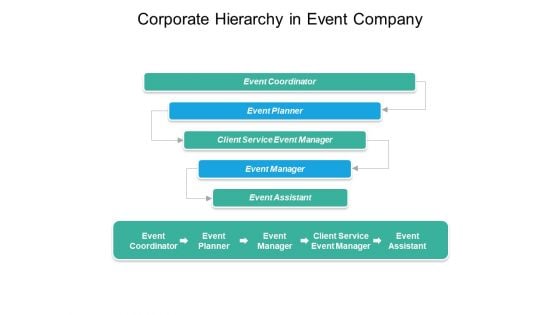
Corporate Hierarchy In Event Company Ppt PowerPoint Presentation Infographics Themes
This is a corporate hierarchy in event company ppt powerpoint presentation infographics themes. This is a five stage process. The stages in this process are project management, event management, event planning.

Cost Performance Index Ppt PowerPoint Presentation Infographics Themes
This is a cost performance index ppt powerpoint presentation infographics themes. This is a two stage process. The stages in this process are cost performance index, ev term, value, finance.
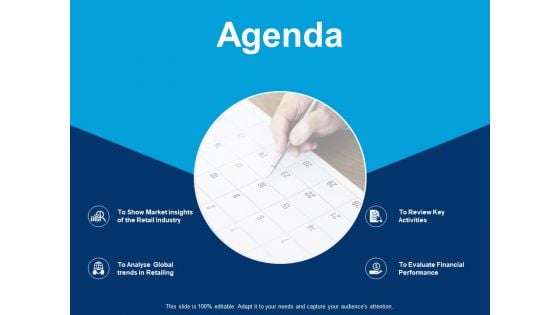
Agenda To Review Key Activities Ppt PowerPoint Presentation Infographics Themes
This is a agenda to review key activities ppt powerpoint presentation infographics themes. This is a four stage process. The stages in this process are business, management, strategy, analysis, marketing.
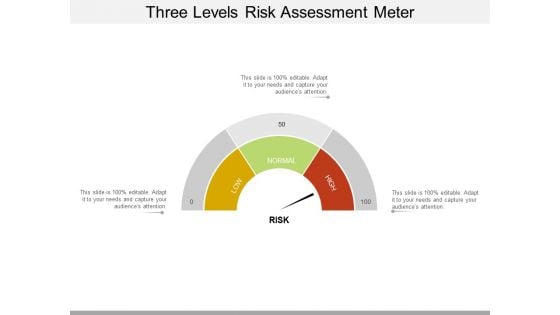
Three Levels Risk Assessment Meter Ppt PowerPoint Presentation Infographics Themes
This is a three levels risk assessment meter ppt powerpoint presentation infographics themes. This is a three stage process. The stages in this process are risk meter, risk speedometer, hazard meter.
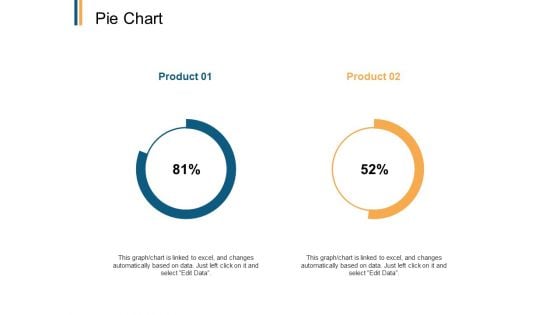
Pie Chart Analysis Ppt PowerPoint Presentation Infographics Diagrams
Presenting this set of slides with name pie chart analysis ppt powerpoint presentation infographics diagrams. The topics discussed in these slides are pie chat, product 01, product 02. This is a completely editable PowerPoint presentation and is available for immediate download. Download now and impress your audience.
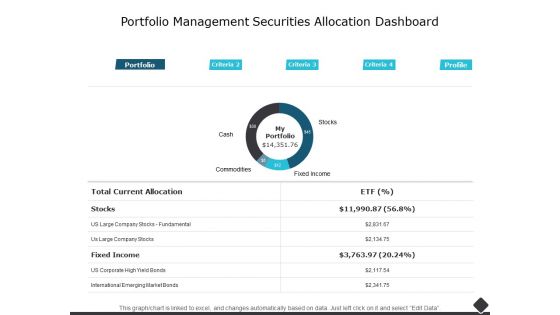
Portfolio Management Securities Allocation Dashboard Ppt PowerPoint Presentation Infographics Examples
This is a portfolio management securities allocation dashboard ppt powerpoint presentation infographics examples. The topics discussed in this diagram are finance, marketing, management, investment, analysis. This is a completely editable PowerPoint presentation, and is available for immediate download.
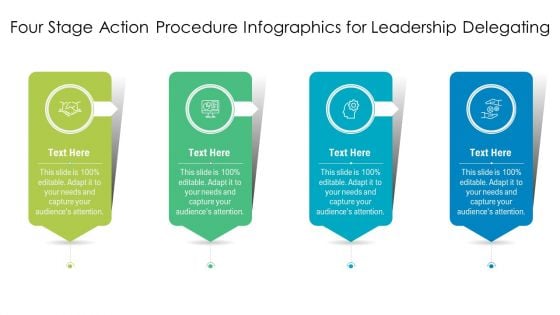
Four Stage Action Procedure Infographics For Leadership Delegating Download PDF
Presenting four stage action procedure infographics for leadership delegating download pdf to dispense important information. This template comprises four stages. It also presents valuable insights into the topics including four stage action procedure infographics for leadership delegating. This is a completely customizable PowerPoint theme that can be put to use immediately. So, download it and address the topic impactfully.
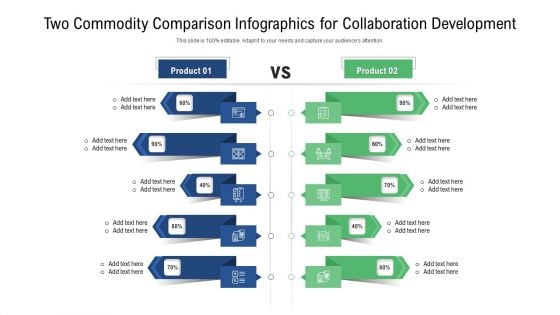
Two Commodity Comparison Infographics For Collaboration Development Background PDF
Presenting two commodity comparison infographics for collaboration development background pdf to dispense important information. This template comprises two stages. It also presents valuable insights into the topics including two commodity comparison infographics for collaboration development. This is a completely customizable PowerPoint theme that can be put to use immediately. So, download it and address the topic impactfully.

Business Diagram Four Staged Infographics Design Presentation Template
Our above slide displays Four Staged Infographics Design. Download our above diagram to express information in a visual way. This diagram offers a way for your audience to visually conceptualize the process.

Our Mission Template 2 Ppt PowerPoint Presentation Infographics Diagrams
This is a our mission template 2 ppt powerpoint presentation infographics diagrams. This is a one stage process. The stages in this process are our mission, business, success, planning, marketing.

Market Sizing Template 1 Ppt PowerPoint Presentation Infographics Diagrams
This is a market sizing template 1 ppt powerpoint presentation infographics diagrams. This is a three stage process. The stages in this process are total available market, serviceable market, our market share.
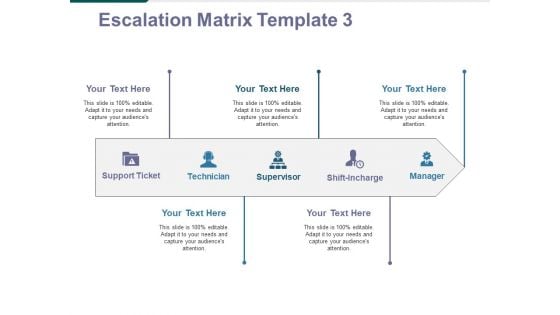
Escalation Matrix Template 3 Ppt PowerPoint Presentation Infographics Diagrams
This is a escalation matrix template 3 ppt powerpoint presentation infographics diagrams. This is a five stage process. The stages in this process are support ticket, technician, supervisor, shift incharge, manager.
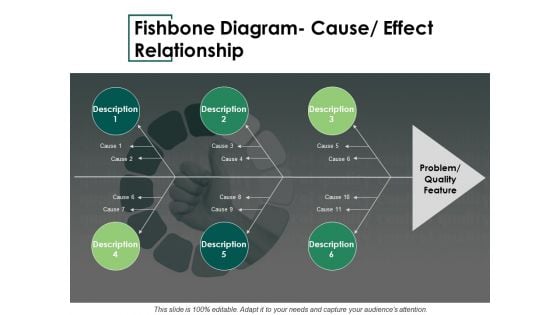
Fishbone Diagram Cause Effect Relationship Ppt PowerPoint Presentation Infographics Slideshow
This is a fishbone diagram cause effect relationship ppt powerpoint presentation infographics slideshow. This is a six stage process. The stages in this process are description, cause, problem quality feature.
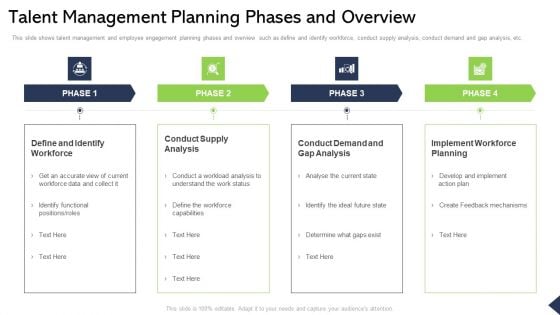
Talent Management Planning Phases And Overview Ppt Infographics Diagrams PDF
This slide shows talent management and employee engagement planning phases and overview such as define and identify workforce, conduct supply analysis, conduct demand and gap analysis, etc. Presenting talent management planning phases and overview ppt infographics diagrams pdf to provide visual cues and insights. Share and navigate important information on four stages that need your due attention. This template can be used to pitch topics like identify workforce, conduct supply analysis, conduct demand and gap analysis, implement workforce planning. In addtion, this PPT design contains high resolution images, graphics, etc, that are easily editable and available for immediate download.

Five Phases Of Recruitment Process Timeline Infographics PDF
The following slide highlights various phases of employment process timeline. The timeline phase begins with candidate screening, application review, interviews, document verification, conditional offer and job offer letter. Presenting five phases of recruitment process timeline infographics pdf to dispense important information. This template comprises five stages. It also presents valuable insights into the topics including application, technical interview, employee onboarding. This is a completely customizable PowerPoint theme that can be put to use immediately. So, download it and address the topic impactfully.
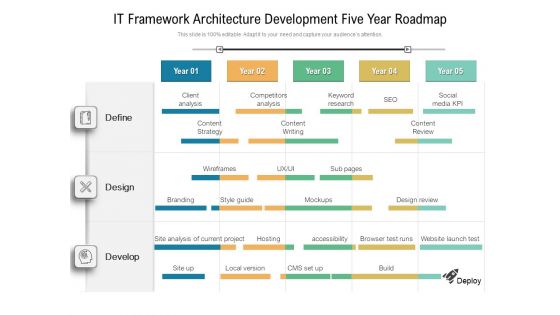
IT Framework Architecture Development Five Year Roadmap Infographics
We present our it framework architecture development five year roadmap infographics. This PowerPoint layout is easy-to-edit so you can change the font size, font type, color, and shape conveniently. In addition to this, the PowerPoint layout is Google Slides compatible, so you can share it with your audience and give them access to edit it. Therefore, download and save this well-researched it framework architecture development five year roadmap infographics in different formats like PDF, PNG, and JPG to smoothly execute your business plan.
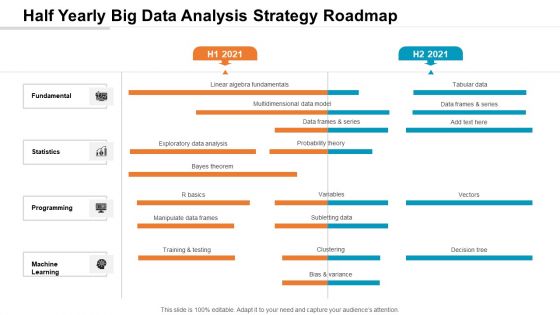
Half Yearly Big Data Analysis Strategy Roadmap Infographics
We present our half yearly big data analysis strategy roadmap infographics. This PowerPoint layout is easy-to-edit so you can change the font size, font type, color, and shape conveniently. In addition to this, the PowerPoint layout is Google Slides compatible, so you can share it with your audience and give them access to edit it. Therefore, download and save this well-researched half yearly big data analysis strategy roadmap infographics in different formats like PDF, PNG, and JPG to smoothly execute your business plan.
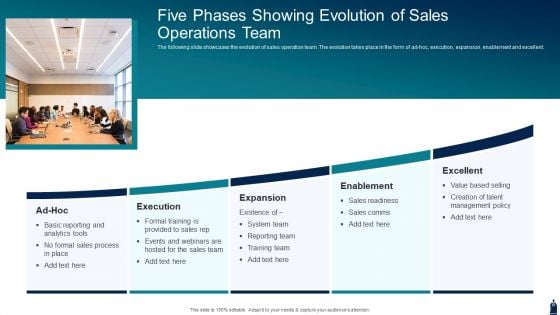
Five Phases Showing Evolution Of Sales Operations Team Infographics PDF
The following slide showcases the evolution of sales operation team. The evolution takes place in the form of ad hoc, execution, expansion, enablement and excellent. Presenting five phases showing evolution of sales operations team infographics pdf to dispense important information. This template comprises five stages. It also presents valuable insights into the topics including execution, expansion, enablement. This is a completely customizable PowerPoint theme that can be put to use immediately. So, download it and address the topic impactfully.
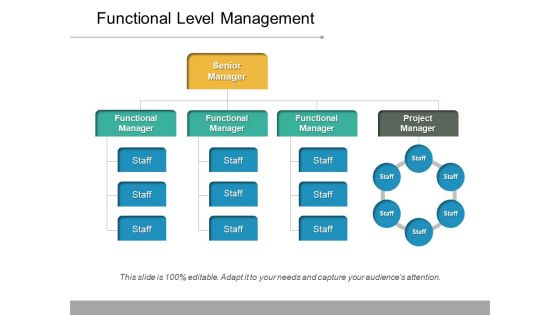
Functional Level Management Ppt PowerPoint Presentation Infographics Images
This is a functional level management ppt powerpoint presentation infographics images. This is a three stage process. The stages in this process are organization chart, org chart, project team structure.
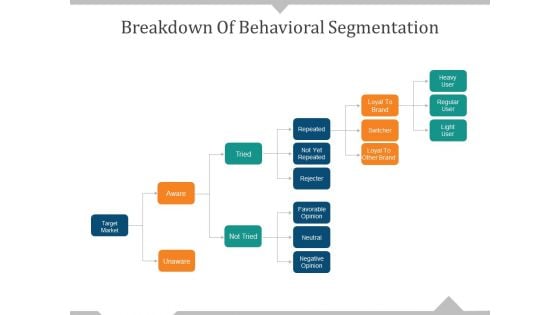
Breakdown Of Behavioral Segmentation Ppt PowerPoint Presentation Infographics Slide Portrait
This is a breakdown of behavioral segmentation ppt powerpoint presentation infographics slide portrait. This is a five stage process. The stages in this process are target market, aware, unaware, not tried, tried, negative opinion.
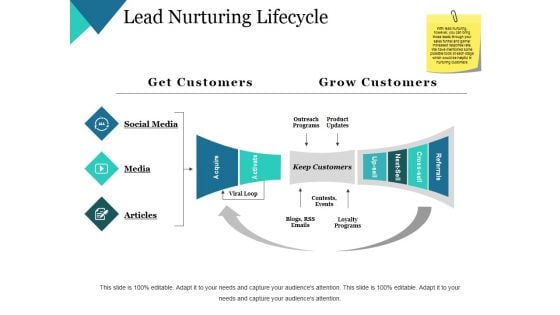
Lead Nurturing Lifecycle Ppt PowerPoint Presentation Infographics Designs
This is a lead nurturing lifecycle ppt powerpoint presentation infographics designs. This is a two stage process. The stages in this process are social media, media, articles, outreach programs, product updates.
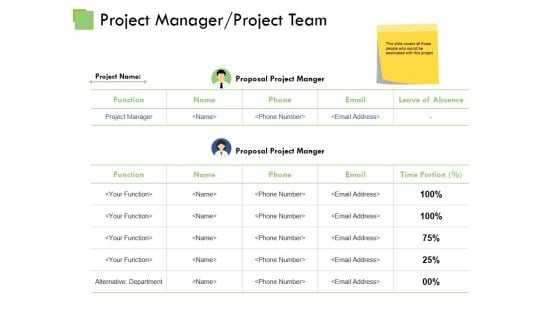
Project Manager Project Team Ppt PowerPoint Presentation Infographics Maker
This is a project manager project team ppt powerpoint presentation infographics maker. This is a four stage process. The stages in this process are business, marketing, strategy, planning, communication.
Software Product Development Process Ppt PowerPoint Presentation Infographics Pictures Cpb
This is a software product development process ppt powerpoint presentation infographics pictures cpb. This is a two stage process. The stages in this process are software product development process.
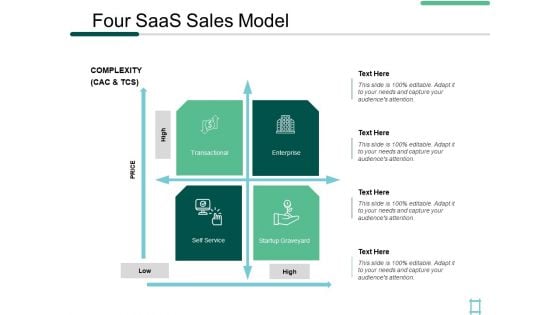
Four Saas Sales Model Enterprise Ppt PowerPoint Presentation Infographics Sample
This is a four saas sales model enterprise ppt powerpoint presentation infographics sample. This is a four stage process. The stages in this process are transactional, enterprise, self service, startup graveyard, planning.
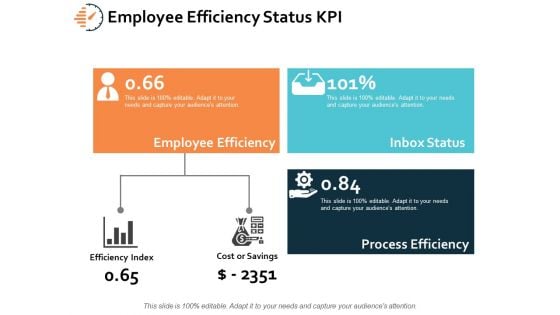
Employee Efficiency Status KPI Ppt PowerPoint Presentation Infographics Images
This is a employee efficiency status kpi ppt powerpoint presentation infographics images. This is a three stage process. The stages in this process are employee efficiency, process efficiency, efficiency index, planning, marketing.

Graph Indicating Clinical Trial Phases Probability Of Success Infographics PDF
This slide compares and visually presents the success rate of each stage with preceding one of the clinical research procedures to represent the achievement of the drug efficacy objective of the firm.Deliver and pitch your topic in the best possible manner with this Graph Indicating Clinical Trial Phases Probability Of Success Infographics PDF Use them to share invaluable insights on Graph Indicating Clinical Trial Phases Probability Of Success and impress your audience. This template can be altered and modified as per your expectations. So, grab it now.
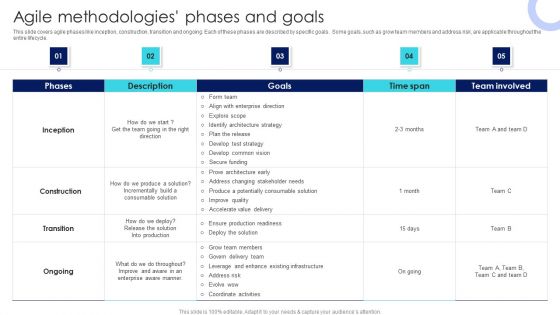
IT Agile Framework Agile Methodologies Phases And Goals Infographics PDF
This slide covers agile phases like inception, construction, transition and ongoing. each of these phases are described by specific goals. some goals, such as grow team members and address risk, are applicable throughout the entire lifecycle. Do you have to make sure that everyone on your team knows about any specific topic I yes, then you should give IT Agile Framework Agile Methodologies Phases And Goals Infographics PDF a try. Our experts have put a lot of knowledge and effort into creating this impeccable IT Agile Framework Agile Methodologies Phases And Goals Infographics PDF. You can use this template for your upcoming presentations, as the slides are perfect to represent even the tiniest detail. You can download these templates from the Slidegeeks website and these are easy to edit. So grab these today.
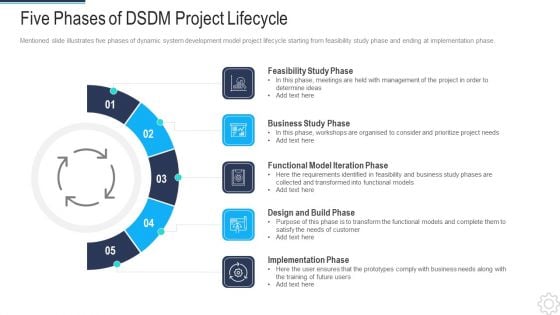
DSDM IT Five Phases Of Dsdm Project Lifecycle Infographics PDF
This is a dsdm it five phases of dsdm project lifecycle infographics pdf template with various stages. Focus and dispense information on five stages using this creative set, that comes with editable features. It contains large content boxes to add your information on topics like feasibility study phase, business study phase, design and build phase. You can also showcase facts, figures, and other relevant content using this PPT layout. Grab it now.
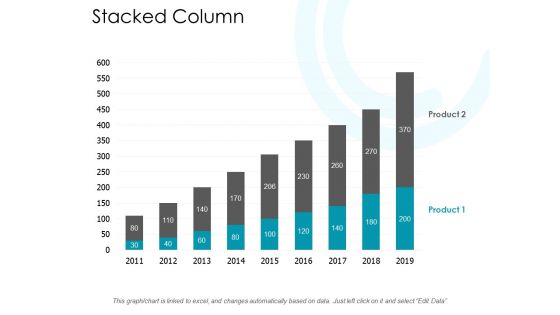
Stacked Column Analysis Ppt PowerPoint Presentation Infographics Themes
Presenting this set of slides with name stacked column analysis ppt powerpoint presentation infographics themes. The topics discussed in these slides are finance, marketing, management, investment, analysis. This is a completely editable PowerPoint presentation and is available for immediate download. Download now and impress your audience.
Weekly Project Schedule Progress Tracking Gantt Chart Infographics PDF
The slide highlights the weekly project plan progress tracking Gantt chart depicting development phase, testing phase and launch phase. Showcasing this set of slides titled Weekly Project Schedule Progress Tracking Gantt Chart Infographics PDF. The topics addressed in these templates are Development, Increased Demand, Increased Anticipation. All the content presented in this PPT design is completely editable. Download it and make adjustments in color, background, font etc. as per your unique business setting.
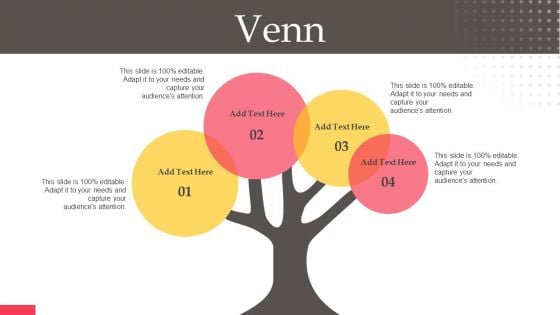
Executing Automotive Marketing Tactics For Sales Boost Venn Infographics PDF
Are you searching for a Executing Automotive Marketing Tactics For Sales Boost Venn Infographics PDF that is uncluttered, straightforward, and original Its easy to edit, and you can change the colors to suit your personal or business branding. For a presentation that expresses how much effort you have put in, this template is ideal With all of its features, including tables, diagrams, statistics, and lists, its perfect for a business plan presentation. Make your ideas more appealing with these professional slides. Download Executing Automotive Marketing Tactics For Sales Boost Venn Infographics PDF from Slidegeeks today.
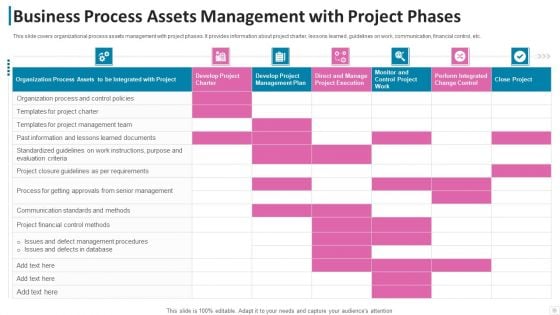
Business Process Assets Management With Project Phases Infographics PDF
This slide covers organizational process assets management with project phases. It provides information about project charter, lessons learned, guidelines on work, communication, financial control, etc. Pitch your topic with ease and precision using this business process assets management with project phases infographics pdf. This layout presents information on business process assets management with project phases. It is also available for immediate download and adjustment. So, changes can be made in the color, design, graphics or any other component to create a unique layout.
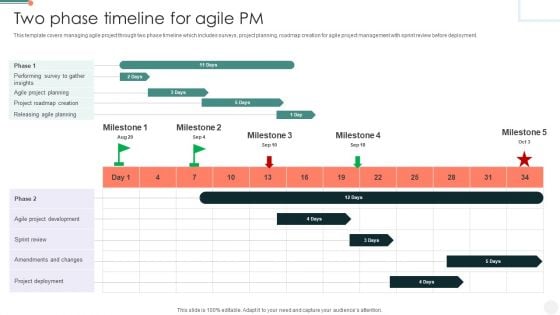
Two Phase Timeline For Agile PM Infographics PDF
This template covers managing agile project through two phase timeline which includes surveys, project planning, roadmap creation for agile project management with sprint review before deployment. Showcasing this set of slides titled Two Phase Timeline For Agile PM Infographics PDF. The topics addressed in these templates are Agile Project Development, Project Roadmap Creation, Phase Timeline. All the content presented in this PPT design is completely editable. Download it and make adjustments in color, background, font etc. as per your unique business setting.
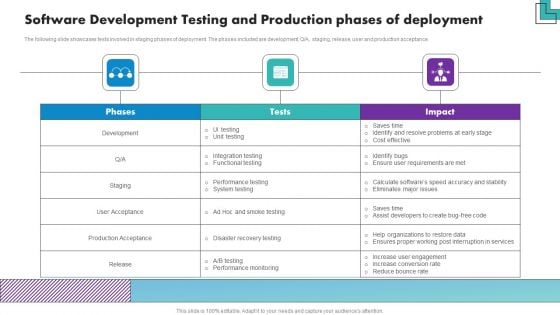
Software Development Testing And Production Phases Of Deployment Infographics PDF
The following slide showcases tests involved in staging phases of deployment. The phases included are development, Q or A, staging, release, user and production acceptance. Showcasing this set of slides titled Software Development Testing And Production Phases Of Deployment Infographics PDF. The topics addressed in these templates are Development, Staging, User Acceptance, Production Acceptance, Release. All the content presented in this PPT design is completely editable. Download it and make adjustments in color, background, font etc. as per your unique business setting.
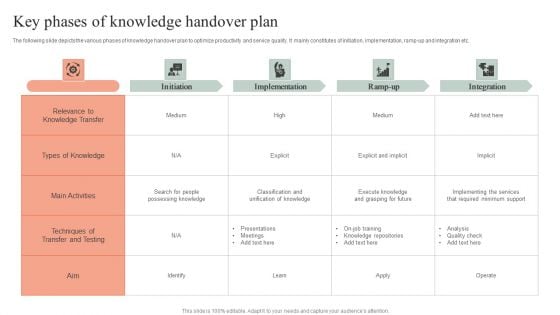
Key Phases Of Knowledge Handover Plan Infographics PDF
The following slide depicts the various phases of knowledge handover plan to optimize productivity and service quality. It mainly constitutes of initiation, implementation, ramp-up and integration etc. Pitch your topic with ease and precision using this Key Phases Of Knowledge Handover Plan Infographics PDF. This layout presents information on Implementation, Required Minimum Support, Analysis. It is also available for immediate download and adjustment. So, changes can be made in the color, design, graphics or any other component to create a unique layout.
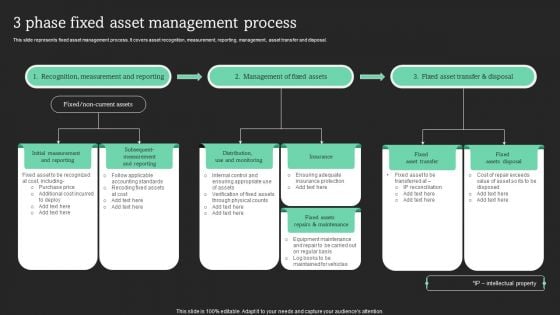
3 Phase Fixed Asset Management Process Infographics PDF
This slide represents fixed asset management process. It covers asset recognition, measurement, reporting, management, asset transfer and disposal. Find a pre designed and impeccable 3 Phase Fixed Asset Management Process Infographics PDF. The templates can ace your presentation without additional effort. You can download these easy to edit presentation templates to make your presentation stand out from others. So, what are you waiting for Download the template from Slidegeeks today and give a unique touch to your presentation.
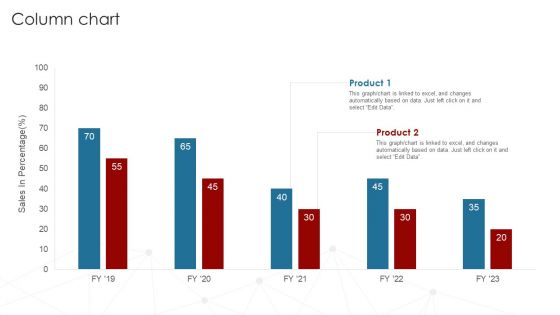
Deployment Of Business Process Column Chart Ppt Infographics Smartart PDF
Get a simple yet stunning designed Deployment Of Business Process Column Chart Ppt Infographics Smartart PDF. It is the best one to establish the tone in your meetings. It is an excellent way to make your presentations highly effective. So, download this PPT today from Slidegeeks and see the positive impacts. Our easy-to-edit Deployment Of Business Process Column Chart Ppt Infographics Smartart PDF can be your go-to option for all upcoming conferences and meetings. So, what are you waiting for Grab this template today.
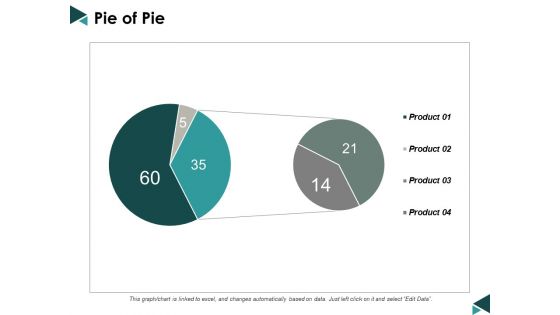
Pie Of Pie Ppt Powerpoint Presentation Infographics Layout Ideas
This is a pie of pie ppt powerpoint presentation infographics layout ideas. This is a four stage process. The stages in this process are pie chart, marketing, business, analysis, management.
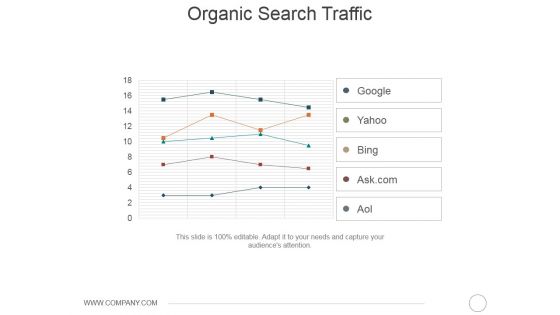
Organic Search Traffic Ppt PowerPoint Presentation Infographics Show
This is a organic search traffic ppt powerpoint presentation infographics show. This is a five stage process. The stages in this process are google, yahoo, bing, ask com, aol.
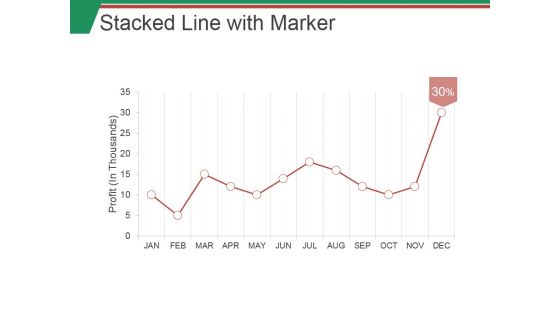
Stacked Line With Marker Ppt PowerPoint Presentation Infographics Images
This is a stacked line with marker ppt powerpoint presentation infographics images. This is a twelve stage process. The stages in this process are business, marketing, strategy, finance, success.
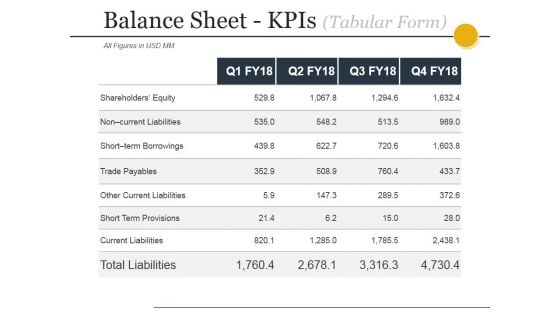
Balance Sheet Kpis Tabular Form Ppt PowerPoint Presentation Infographics Good
This is a balance sheet kpis tabular form ppt powerpoint presentation infographics good. This is a four stage process. The stages in this process are current assets, current liabilities, total assets, total liabilities.
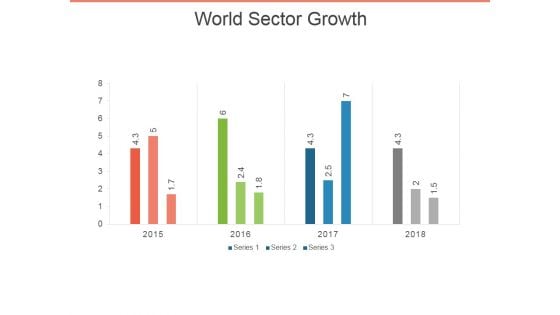
World Sector Growth Ppt PowerPoint Presentation Infographics Objects
This is a world sector growth ppt powerpoint presentation infographics objects. This is a four stage process. The stages in this process are bar graph, business, marketing, success, presentation.
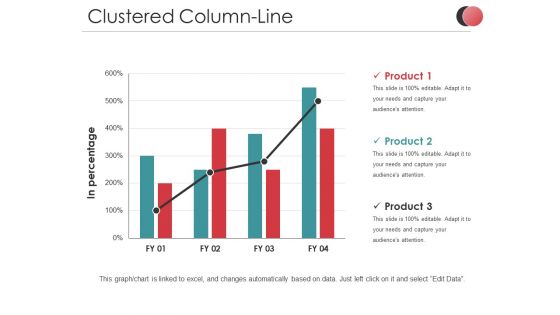
Clustered Column Line Ppt PowerPoint Presentation Infographics Templates
This is a clustered column line ppt powerpoint presentation infographics templates. This is a three stage process. The stages in this process are in percentage, business, marketing, product, finance, graph.
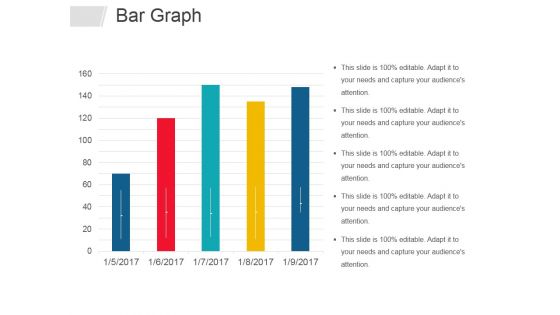
Bar Graph Ppt PowerPoint Presentation Infographics Graphics Design
This is a bar graph ppt powerpoint presentation infographics graphics design. This is a five stage process. The stages in this process are bar graph, business, years, marketing, management.
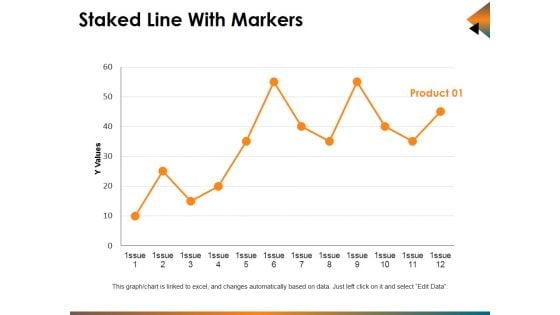
Staked Line With Markers Ppt PowerPoint Presentation Infographics Show
This is a staked line with markers ppt powerpoint presentation infographics show. This is a one stage process. The stages in this process are business, marketing, finance, line, analysis.
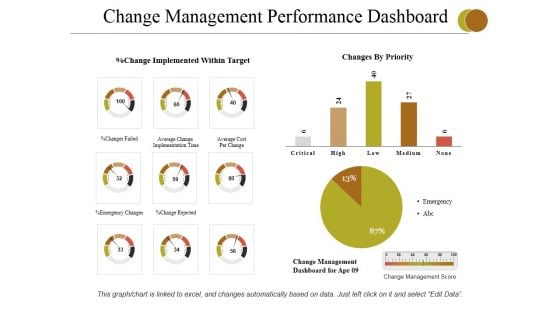
Change Management Performance Dashboard Ppt PowerPoint Presentation Infographics Topics
This is a change management performance dashboard ppt powerpoint presentation infographics topics. This is a Three stage process. The stages in this process are emergency changes, change rejected, changes failed, average cost per change, emergency.
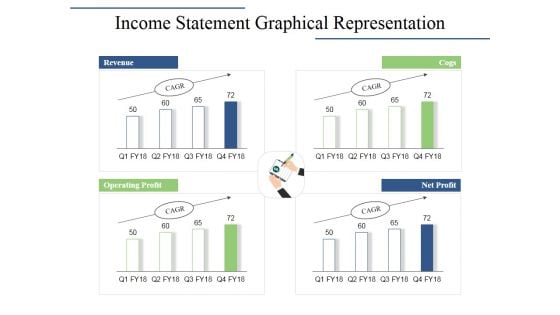
Income Statement Graphical Representation Ppt PowerPoint Presentation Infographics Layouts
This is a income statement graphical representation ppt powerpoint presentation infographics layouts. This is a four stage process. The stages in this process are revenue, cogs, operating profit, net profit.
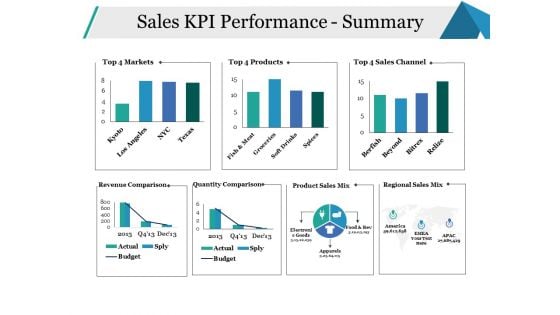
Sales KPI Performance Summary Ppt PowerPoint Presentation Infographics Model
This is a sales kpi performance summary ppt powerpoint presentation infographics model. This is a seven stage process. The stages in this process are sales channel, revenue comparison, quantity comparison, business, marketing.
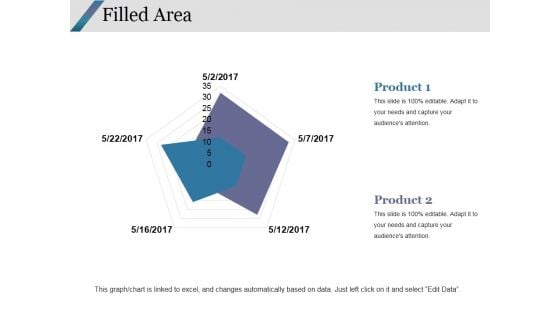
Filled Area Ppt PowerPoint Presentation Infographics Graphics Design
This is a filled area ppt powerpoint presentation infographics graphics design. This is a two stage process. The stages in this process are filled area, finance, marketing, strategy, analysis.
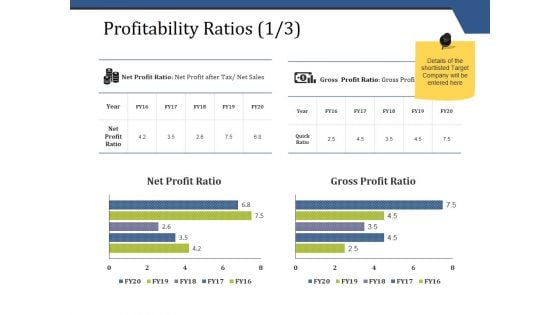
Profitability Ratios Template 1 Ppt PowerPoint Presentation Infographics Mockup
This is a profitability ratios template 1 ppt powerpoint presentation infographics mockup. This is a two stage process. The stages in this process are business, finance, marketing, strategy, analysis.
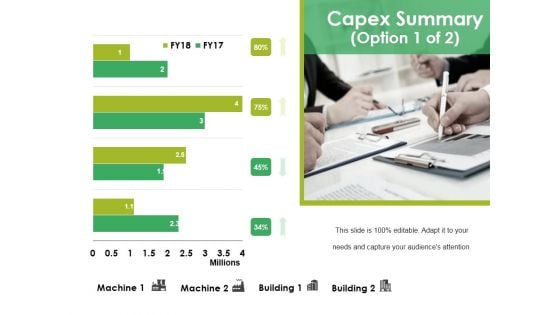
Capex Summary Template 1 Ppt PowerPoint Presentation Infographics Mockup
This is a capex summary template 1 ppt powerpoint presentation infographics mockup. This is a four stage process. The stages in this process are finance, marketing, business, analysis, strategy.
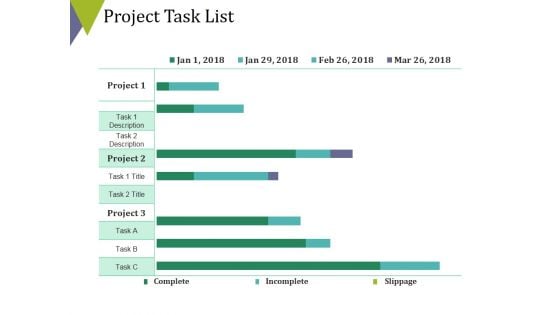
Project Task List Template 2 Ppt PowerPoint Presentation Infographics Brochure
This is a project task list template 2 ppt powerpoint presentation infographics brochure. This is a three stage process. The stages in this process are finance, business, marketing, analysis, strategy.
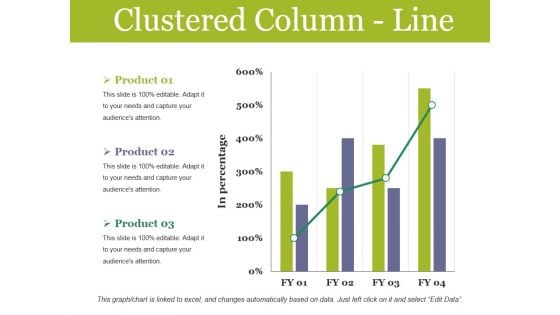
Clustered Column Line Ppt PowerPoint Presentation Infographics Graphics Design
This is a clustered column line ppt powerpoint presentation infographics graphics design. This is a three stage process. The stages in this process are finance, marketing, business, analysis, management.
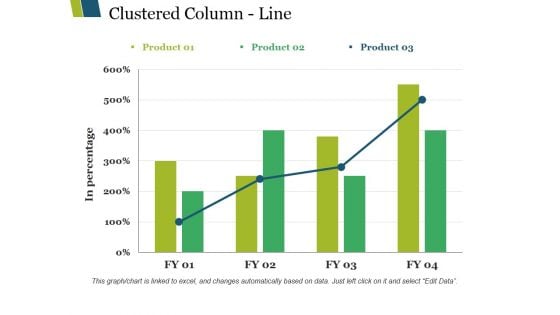
Clustered Column Line Ppt PowerPoint Presentation Infographics Background Images
This is a clustered column line ppt powerpoint presentation infographics background images. This is a three stage process. The stages in this process are clustered column line, finance, analysis, marketing, business.
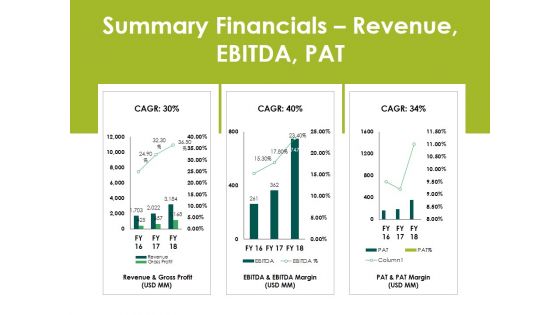
Summary Financials Revenue Ebitda Pat Ppt PowerPoint Presentation Infographics Ideas
This is a summary financials revenue ebitda pat ppt powerpoint presentation infographics ideas. This is a three stage process. The stages in this process are business, finance, analysis, marketing, strategy.
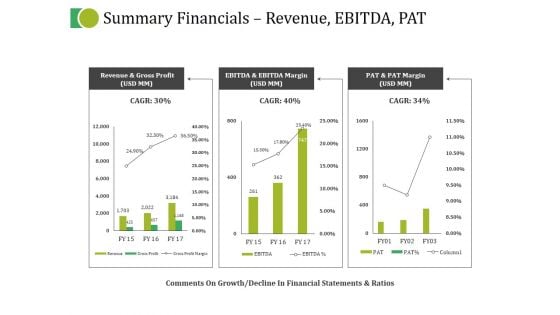
Summary Financials Revenue Ebitda Pat Ppt PowerPoint Presentation Infographics Inspiration
This is a summary financials revenue ebitda pat ppt powerpoint presentation infographics inspiration. This is a three stage process. The stages in this process are business, marketing, strategy, planning, finance.
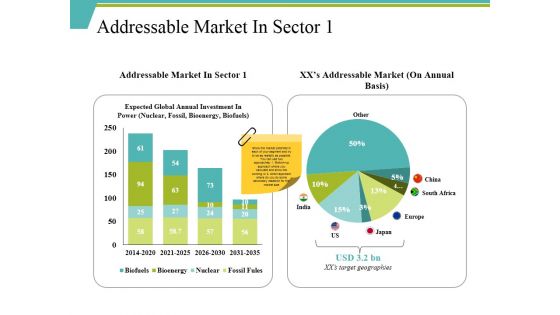
Addressable Market In Sector 1 Ppt PowerPoint Presentation Infographics Show
This is a addressable market in sector 1 ppt powerpoint presentation infographics show. This is a two stage process. The stages in this process are india, japan, europe, south africa, us.
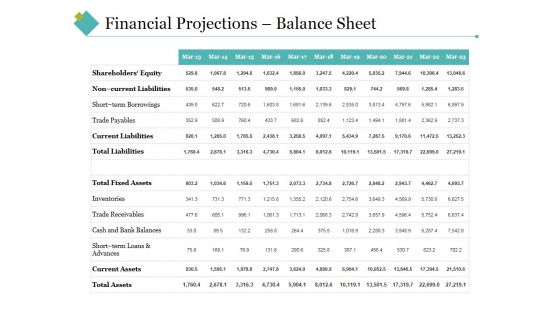
Financial Projections Balance Sheet Ppt PowerPoint Presentation Infographics Clipart Images
This is a financial projections balance sheet ppt powerpoint presentation infographics clipart images. This is a two stage process. The stages in this process are total liabilities, total fixed assets, trade receivables, total assets, inventories.
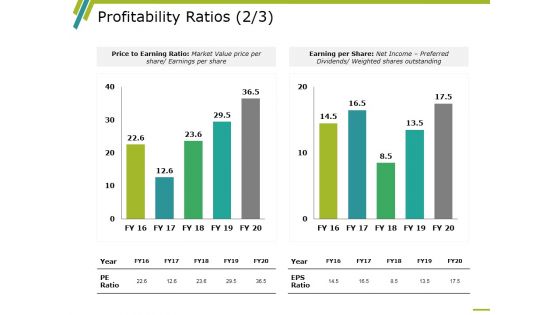
Profitability Ratios Template 4 Ppt PowerPoint Presentation Infographics Rules
This is a profitability ratios template 4 ppt powerpoint presentation infographics rules. This is a two stage process. The stages in this process are business, marketing, graph, price to earning ratio, earning per share.
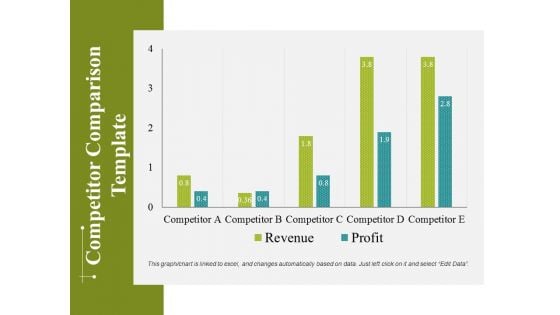
Competitor Comparison Template 2 Ppt PowerPoint Presentation Infographics Objects
This is a competitor comparison template 2 ppt powerpoint presentation infographics objects. This is a five stage process. The stages in this process are business, marketing, graph, finance, strategy.
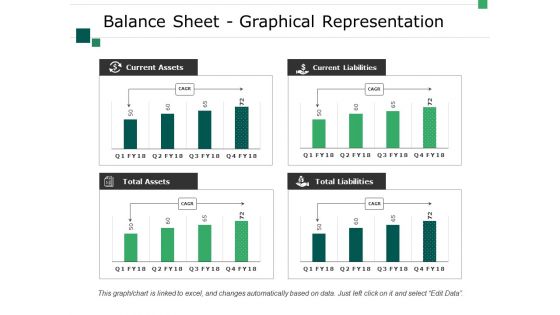
Balance Sheet Graphical Representation Ppt PowerPoint Presentation Infographics Layouts
This is a balance sheet graphical representation ppt powerpoint presentation infographics layouts. This is a four stage process. The stages in this process are business, current assets, total assets, total liabilities, current liabilities.
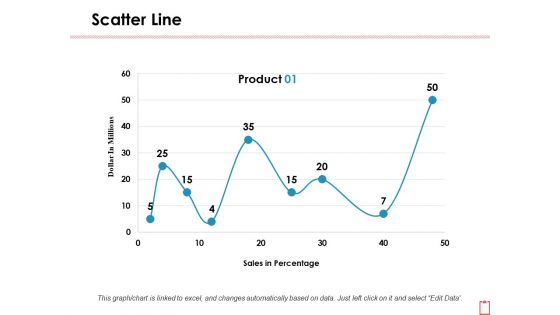
Scatter Line Ppt PowerPoint Presentation Infographics Background Images
This is a scatter line ppt powerpoint presentation infographics background images. This is a one stage process. The stages in this process are dollar in millions, product, sales in percentage.
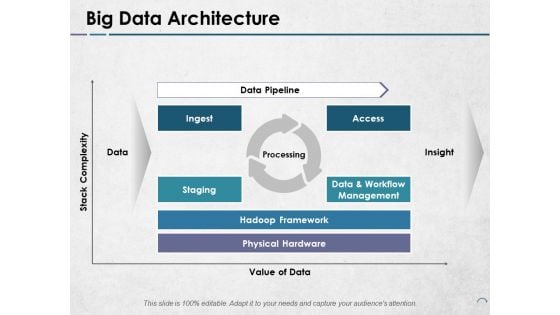
Big Data Architecture Ppt PowerPoint Presentation Infographics Design Inspiration
This is a big data architecture ppt powerpoint presentation infographics design inspiration. This is a four stage process. The stages in this process are data pipeline, processing, insight, value of data, staging.
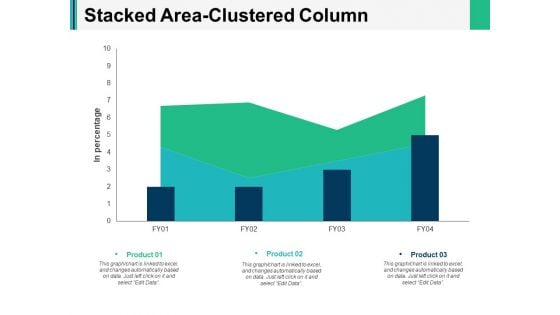
Stacked Area Clustered Column Ppt PowerPoint Presentation Infographics Backgrounds
This is a stacked area clustered column ppt powerpoint presentation infographics backgrounds. This is a three stage process. The stages in this process are finance, marketing, management, investment, analysis.
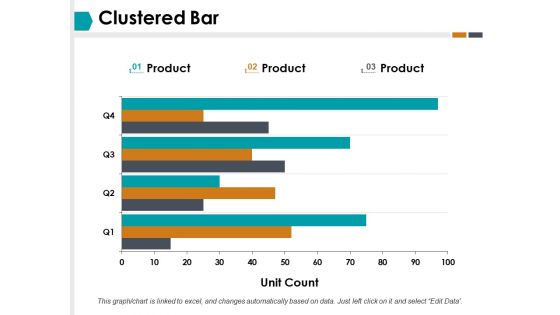
Clustered Bar Finance Ppt PowerPoint Presentation Infographics Graphics Template
This is a clustered bar finance ppt powerpoint presentation infographics graphics template. This is a three stage process. The stages in this process are clustered bar, finance, business, investment, marketing.
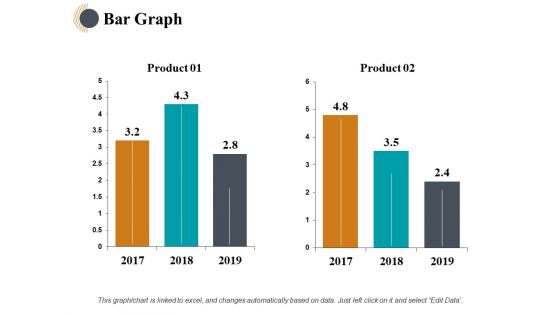
Bar Graph Finance Ppt PowerPoint Presentation Infographics Background Designs
This is a bar graph finance ppt powerpoint presentation infographics background designs. This is a two stage process. The stages in this process are finance, analysis, business, investment, marketing.
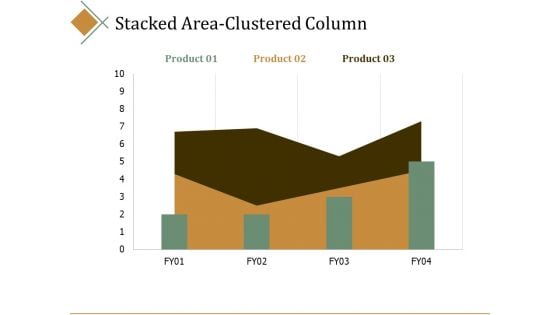
Stacked Area Clustered Column Ppt PowerPoint Presentation Infographics Portrait
This is a stacked area clustered column ppt powerpoint presentation infographics portrait. This is a three stage process. The stages in this process are percentage, product, business, management, marketing.
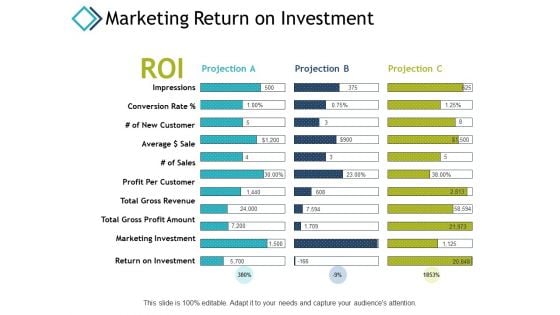
Marketing Return On Investment Ppt PowerPoint Presentation Infographics Files
This is a marketing return on investment ppt powerpoint presentation infographics files. This is a three stage process. The stages in this process are marketing investment, impressions, return on investment, finance, marketing.
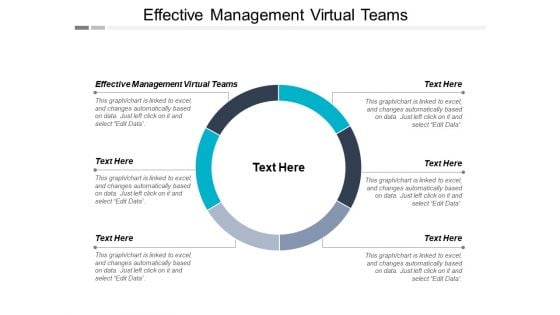
Effective Management Virtual Teams Ppt PowerPoint Presentation Infographics Ideas Cpb
This is a effective management virtual teams ppt powerpoint presentation infographics ideas cpb. This is a six stage process. The stages in this process are effective management virtual teams.
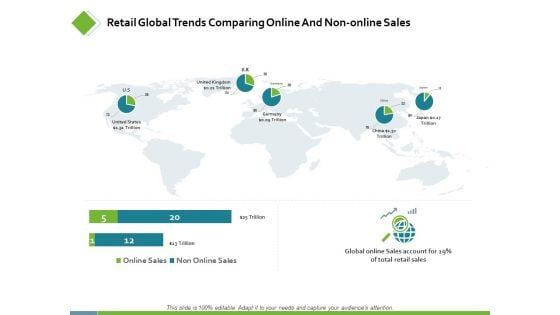
Retail Global Trends Comparing Online Ppt PowerPoint Presentation Infographics Guide
This is a retail global trends comparing online ppt powerpoint presentation infographics guide. This is a two stage process. The stages in this process are finance, analysis, business, investment, marketing.

 Home
Home